GOLD Awaiting Sell Reaction at Peak & Buy Pullback Support🔍 Market Context
After a series of strong Break of Structure (BoS) , gold has reached a new ATH at 4,385 USD – marking a sustainable uptrend over the past 3 sessions.
However, this peak area is currently acting as a significant psychological and technical barrier . Buying momentum is temporarily slowing as the price reacts to the Liquidity Zone around 4,351 – 4,385 USD .
The market is in a phase of liquidity rebalancing .
The major trend remains upward, but the current price area may see a short-term correction before further wave expansion.
💎 Technical Analysis
ATH GOLD: 4,385 USD
Sell Liquidity Zone: 4,430 – 4,435 USD → high liquidity resistance zone, potential for short-term sell reactions.
Liquidity Zone $$$: 4,284 – 4,282 USD → nearby support zone, confluence with trendline.
Order Block | Fibonacci Zone: 4,226 – 4,230 USD → deep discount zone confluencing with Fibo 0.618, high reversal potential.
Overall Structure: remains bullish , but showing short-term signs of weakness as the price fails to hold above 4,360.
📈 Trading Scenarios
1️⃣ SELL Setup – Rejection at peak area 4,385 – 4,433 USD
Entry: 4,430 - 4,435
SL: 4,440
TP: 4,425 → 4,420 →4,415→4,410→4405
✅ Condition: Appearance of rejection or strong bearish engulfing candles at high Liquidity zone.
➡️ This is a liquidity reaction setup – sell when the price sweeps the peak and clear sell signals from major players appear.
2️⃣ BUY Setup #1 – Pullback at 4,284 – 4,282 USD
Entry: 4,284 – 4,282
SL: 4,272
TP: 4,290 → 4,300 → 4,310/Open
✅ Condition: Strong H1 candle reaction at support or minor reversal structure.
➡️ Buy with the main trend, taking advantage of a slight pullback around the support Liquidity zone.
3️⃣ BUY Setup #2 – OB Deep Zone 4,226 – 4,230 USD
Entry: 4,226 – 4,230
SL: 4,190
TP: 4,235 → 4,240 → 4,250/Open
✅ Condition: Appearance of bullish BoS or confirming bullish engulfing candle.
➡️ This is a deep discount zone, suitable for swing orders following the main trend.
⚠️ Risk Management
Avoid FOMO buying at high zones (4,360+).
Prioritize observing price behavior at 4,284 and 4,226 before entering orders.
Sell orders at 4,385–4,430 are only triggered if there is a clear confirmation signal.
Maintain moderate volume, avoid averaging down without confirmation.
💬 Conclusion
Gold is accumulating after reaching the peak of 4,385 USD , this is a crucial phase to determine the correction before the new upward wave.
The most effective strategy now is sell reaction at the high peak area 4,385 – 4,430 and buy with the trend at 4,284 – 4,226 USD when confirmation appears.
👉 Reasonable Strategy:
Sell Reaction: 4,385 – 4,430 → TP 4,284 – 4,226
Buy Pullback: 4,284 – 4,282
Buy OB Deep: 4,226 – 4,230
Fibonacci

BTC eyes on 105.5k: Semi-Major Genesis fib is CRITICAL support Shown here is a single fib series in 3 different timeframes.
The Genesis Sequience has called all major turns since 2015.
We called the recent top at 125,550 by the Genesis Sequence.
Prices are from Coinbase, others will vary a bit.
$ 105,541.85 is the Semi-Major fib just below.
$ 111,661.25 above is a minor ratio and resistance.
$ 96,769.44 would be the sub-100k stop hunt level.
.
Last Analysis that called the EXACT TOP:

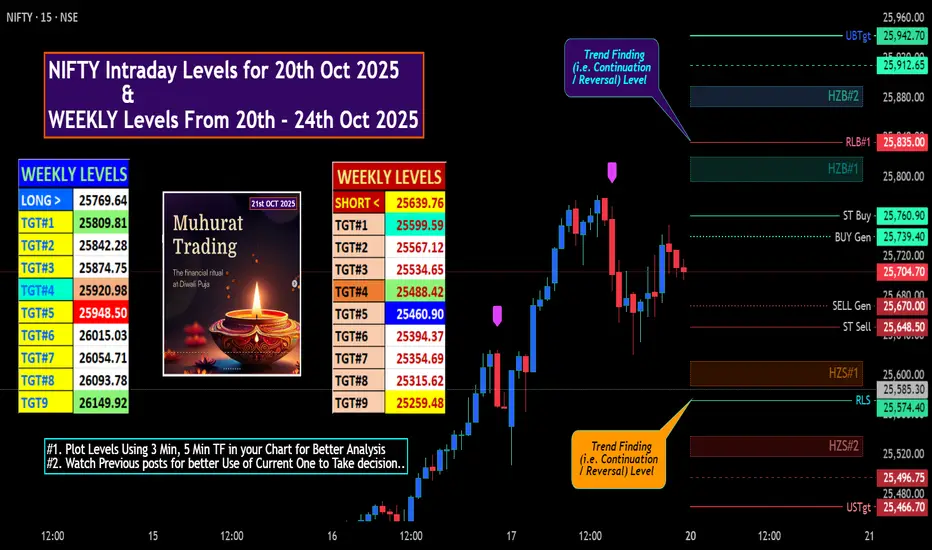
NIFTY Intraday & Swing Levels for 20th Oct 2025🚀 "WEEKLY Levels" mentioned in BOX format.
🌡️Plot Levels Using 3 Min, 5 Min Time frame in your Chart for Better Analysis
L#1: If the candle crossed & stays above the “Buy Gen”, it is treated / considered as Bullish bias.
L#2: Possibility / Probability of REVERSAL near RLB#1 & UBTgt
L#3: If the candle stays above “Sell Gen” but below “Buy Gen”, it is treated / considered as Sidewise. Aggressive Traders can take Long position near “Sell Gen” either retesting or crossed from Below & vice-versa i.e. can take Short position near “Buy Gen” either retesting or crossed downward from Above.
L#4: If the candle crossed & stays below the “Sell Gen”, it is treated / considered a Bearish bias.
L#5: Possibility / Probability of REVERSAL near RLS#1 & USTgt
HZB (Buy side) & HZS (Sell side) => Hurdle Zone,
*** Specialty of “HZB#1, HZB#2 HZS#1 & HZS#2” is Sidewise (behaviour in Nature)
📊 Rest Plotted and Mentioned on Chart
Color code Used:
Green =. Positive bias.
Red =. Negative bias.
RED in Between Green means Trend Finder / Momentum Change
/ CYCLE Change and Vice Versa.
Notice One thing: HOW LEVELS are Working.
Use any Momentum Indicator / Oscillator or as you "USED to" to Take entry.
⚠️ DISCLAIMER:
The information, views, and ideas shared here are purely for educational and informational purposes only. They are not intended as investment advice or a recommendation to buy, sell, or hold any financial instruments. I am not a SEBI-registered financial adviser.
Trading and investing in the stock market involves risk, and you should do your own research and analysis. You are solely responsible for any decisions made based on this research.
"As HARD EARNED MONEY IS YOUR's, So DECISION SHOULD HAVE TO BE YOUR's".
Do comment if Helpful .
✍🏽️ In depth Analysis will be added later (If time Permits)

BNB: The Party's Over. Here's the Short Setup.Yo.
Quick-fire analysis on BNB/USDT, looking across the M15 to H4 timeframes. The market gave us a technical bounce, a relief rally for the amateurs. Don't be fooled. The party is over, and the bears are now in control.
The Setup
Let's recap the recent chaos. After last Friday's mass liquidation event, BNB staged an absurd rally, tapping a new ATH around 1375 within three days. Hope you survived the volatility. That move, however, was pure euphoria, completely detached from the broader market reality.
While BNB was flying, BTC showed extreme weakness, failing to reclaim any meaningful levels. This divergence was a massive red flag. It was inevitable that BNB's gravity-defying move would correct, and correct hard.
My setup is classic, no-nonsense technical analysis: multi-timeframe Fibonacci levels, a hard focus on volume profile, and a tactical eye on order flow. The blue Fib levels are drawn on the H4 chart (macro trend), and the red Fibs are for the M15 chart (micro trend since the Friday low).
What's Happening Now
The chart is screaming "SELL" at a major point of technical confluence. For anyone who can read price action, this is crystal clear.
After a first test yesterday, the critical 0.618 Fibonacci support on the H4 timeframe was decisively broken today, October 17th. This wasn't just any Fib level; it was perfectly aligned with the Point of Control (POC) from the entire last uptrend—the area with the highest traded volume. Losing this level means the bulls have lost their single most important line of defense. The structure is broken.
The Levels That Matter
We've already hit our first target at 1022, which corresponds perfectly to the 1.272 Fibonacci extension from the H4 structure. The playbook from here is simple. We are now watching for a pullback to reload short positions.
- Short Entry Zone: I'm watching for a weak pullback into the 1093 zone. This area represents the '1' point of the H4 Fib retracement and is the ideal spot to the bag. Any bounce to this level that shows signs of exhaustion is a gift.
- Invalidation (Stop Loss): The line in the sand is a clean break and hold above 1125. A move above this level would negate the current bearish market structure and signal that the downtrend is compromised.
- Targets: I’m reaching two price
- The 1.414 Fibonacci extension, which brings us to the $988 area.
- A full leg down to the 1.272 extension on the M15 Fib, targeting the $865 region. This level also aligns with the previous major low, making it a powerful magnet for price.
I'm not betting on hope; I'm trading the evidence. The evidence shows the path of least resistance is down. Let's see how it plays out. As always, don't get rekt.


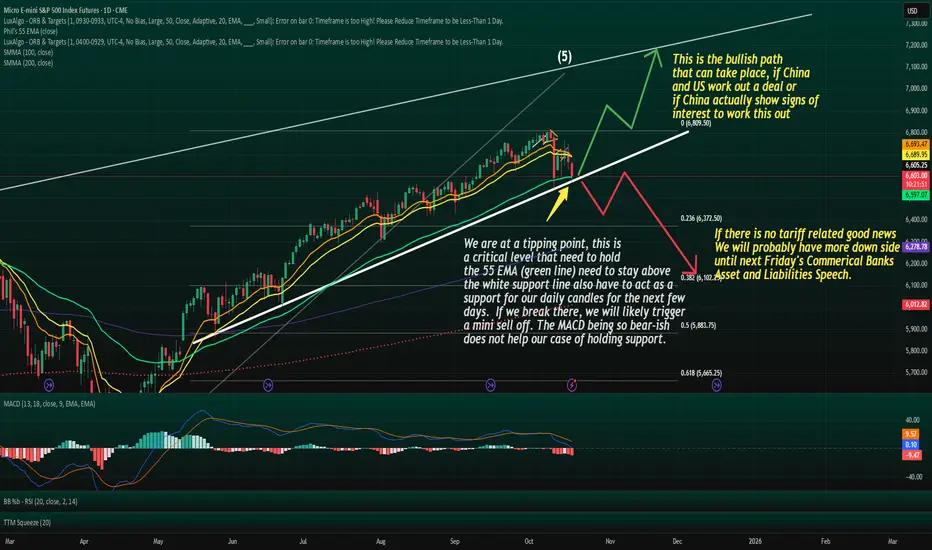
We are at a tipping point that can potentally trigger a bear run
The 55 EMA is widely watched by institutions and swing traders as a medium-term trend gauge.
When price tests this line after a strong run or selloff:
Holding above often leads to trend continuation or strong bounce as seen in the path on my chart.
Losing it convincingly tends to signal a deeper correction or even a trend reversal.
Right now, ES is coiling around the 55EMA, which is the kind of tension point where volatility can explode.
Lower Trend Line = Structural Support
The fact that the EMA test with the lower trend line can adds weight to the downward movement.
When a support trend line and EMA level line up, it becomes a confluence zone meaning breakouts or breakdowns from here are often decisive.
A breakdown of this confluence could open the door to:
A larger corrective Wave A or C leg down.
Possibly a multi-month correction into year end if macro news doesn’t provide support.
Fundamental Catalyst Is Lurking
Tariff or trade-deal headlines can be the kind of fundamental catalyst that aligns perfectly with this technical pressure point.
That alignment is classic in Elliott Wave:
The technicals create the setup.
The news provides the spark.
The breakout or breakdown is fast and aggressive.
⚠️ This is why these zones are dangerous for complacent positioning both bulls and bears can get steamrolled when the move starts.
Two Clear Scenarios
Bullish: candle hold above 55 EMA + trend line then bounce toward upper channel, possibly Wave B or new Wave 3
Bearish: clean daily close below support with 55 EMA dropping below can trigger a multi week(s) correction, potential acceleration downward if no positive news
Bull case → initial target near upper trendline / Fib extension levels.
Bear case → retest of previous swing lows or even 0.618 retrace of the entire rally.
Risk Management Matters Most Here
This is the kind of zone where:
Stops should be clearly defined — not “mental.”
Position size should respect that a big move can be triggered fast.
Targets should be realistic, because reactions off the 55 EMA can be sharp.
“When technicals and fundamentals line up, the market doesn’t tiptoe, it sprints.”
OKLO: watching for top formation NYSE:OKLO : as long as price remains below the 175–183 local resistance zone, I’m watching for at least a mid-term top formation, with selling pressure likely to start dominating. The first support levels to watch are 135–125.
A confirmed break above 183 would shift the odds toward one more upside leg into the 210 macro-resistance area.
Chart:
Macro view:
Previously:
On macro-bottom potential (May 1): www.tradingview.com

ETH will print another explosive impulseETH, as long as we don't invalidate the impulse, will revisit higher prices (if we'll have a bullish Q4 as expected).
Looking for a reaction at the FVG which has many confluences

GOLD → Positive backdrop. Consolidation before growth?FX:XAUUSD is consolidating after a shake-down in the Asian and Pacific sessions. The price hit a new low of 4278, but bulls are aggressively buying up two liquidations (manipulation?). The metal is preparing for its ninth consecutive week in positive territory, with an 8% increase over the week.
Key drivers: Fed members confirmed their readiness to cut rates in October and pointed to risks for the labor market. The situation with the trade war between China and the US is still tense.
However, negotiations between the presidents of three countries on the conflict in Eastern Europe have raised hopes for de-escalation, which has temporarily reduced demand for defensive assets. The shutdown continues, which supports the price of gold.
The correction in gold is a temporary pause, and any decline will be used for purchases.
Technically, the focus is on the global trading range of 4280-4380, with consolidation within 4350-4330. A breakout of the accumulation zone could trigger a move in the direction of the breakout
Resistance levels: 4350, 4380
Support levels: 4320, 4300, 4280
Technically, before rising, the price may test the liquidity zone located below the specified support zones. However, it is also worth watching the 4350 trigger—a breakout of resistance and a close above this level could trigger continued growth within the current bullish trend.
Best regards, R. Linda!

GBPCAD → The hunt for liquidity ahead of growthFX:GBPCAD , after breaking through the resistance of the ascending triangle consolidation pattern and updating its high to 1.8915, is forming a correction to retest the zone of interest before continuing its growth
The British pound is forming an uptrend, which supports the price of the currency pair.
The currency pair is forming a breakout of resistance. After updating the maximum, the price is rolling back to retest the previously broken consolidation border. Liquidity capture relative to 1.8825 - 1.8807 could lead to a shift in the imbalance towards buyers and provoke continued growth.
Resistance levels: 1.8915
Support levels: 1.8825, 1.8808
If, during the retest of support, the bulls keep the price above this zone, then the chances of a reversal and growth will be high. 1.8915 - 1.900 can be considered as a potential target.
Best regards, R. Linda!

BTC update. Support zones did not hold - new ones belowOk, quick update.
We have to now give a thought that $100K is pretty close already. We are few weekly close/open levels as support but if market makers don't front run as again the 100K is there up for grabs.
What speaks for 100K is that there is Major Swing 0.5 fib level very close forming a strong psychological zone together. Breaking below will break also havoc, fear and panic which is of course all the market makers wet dream to get us to sell our Bitcoin to them with bargain and good discount.
BIG QUESTION: Will you sell you Bitcoin at $100K or cheaper?

5 waves have completed, lets see which Fib floor we land onThe 5 wave pattern with the leading first wave have played now, now we get to play ABC corrective. I think 94k is in play.
Please do not over leverage in this environment

EURUSD — Decline from Supply ZoneEURUSD pair, after testing the 1.1780–1.1820 supply zone, shows a clear sellers’ reaction and forms a descending channel. Volume profile confirms bearish pressure, indicating a potential continuation of the downward move. Key downside targets are located at 1.1610, 1.1557, and 1.1200. As long as the price remains below 1.1720, the short bias remains valid.
From the fundamental side, euro weakness is driven by dovish ECB comments and strong U.S. data, while the dollar index holds near local highs. This supports the continuation of the bearish scenario in the coming weeks.
Conclusion: bearish setup remains valid below 1.1720–1.1780, with targets 1.1550–1.1200.

Ep. 4 - BTC Prediction By Channels, Secret Fib & Unique Gann FanBitcoin Price Prediction Using Channels, Fibonacci & Gann Fan | Signal & Structure Episode 4
In this concise yet powerful episode, we combine three advanced technical analysis tools to identify high-probability support zones for Bitcoin's current correction. This multi-confluence approach demonstrates how stacked logarithmic channels, Fibonacci retracements, and Gann fans work together to pinpoint critical price levels.
Techniques Demonstrated:
1. Channel Validation Theory
- Proves that any trend line can become a valid channel
- Shows how to convert the COVID crash to bear market bottom trendline into a working channel
- Demonstrates perfect alignment with historical tops
2. Stacked Channel Refinement
- Creates a smaller channel where the top touches the midline of the larger channel
- This subdivides the original channel into quarters
- Provides additional confluence levels for support/resistance
3. Fibonacci Retracement Application
- Maps the key retracement levels from recent bottom to top
- Focuses on the "Golden Pocket" (0.618-0.786)
- Identifies 0.702 as the Optimal Trade Entry (OTE) level
4. Gann Fan on Logarithmic Scale (Unique Technique)
- Anchors 45-degree angle from the peak
- Aligns Gann Fan 1x1 line with the 45-degree angle
- Uses Gann lines to track momentum decay:
- 1/8 → 1/4 → 1/3 (bearish progression)
- 1/1 as recovery signal
- 8/1 as ultimate resistance breakout
Key Confluence Zone Identified:
The analysis reveals a critical support box between:
- 0.618 - 0.786 Fibonacci levels
- Validated by 1/3 Gann Fan line
- Supported by stacked channel structure
This triple confluence creates a high-probability reversal zone where multiple technical factors align.
Trading Insights:
Current Market Position:
- Price following bearish momentum path along Gann lines
- Moving from 1/8 toward 1/3 line
- Range-bound action expected until 1/1 line reclaimed
Recovery Signals to Watch:
- Breaking above 1/1 Gann line (45-degree angle) = trend recovery
- Ultimate bullish confirmation: Breaking 8/1 line
- Support zone provides optimal risk/reward entry area
Technical Setup:
- Timeframe: Weekly chart
- Scale: Logarithmic (essential for both channels and Gann)
- Tools: TradingView's Fib Retracement, Gann Fan, Parallel Channel
This episode demonstrates how combining multiple technical tools on logarithmic scale can identify precise support/resistance zones. The convergence of three independent methods at the same price area significantly increases the probability of a meaningful reaction.
The unique application of Gann Fan on log scale, aligned with the 45-degree angle, provides a momentum roadmap that most traders miss. This technique is particularly powerful for tracking trend strength degradation and identifying potential reversal points.
Feel free to teach out for partnership opportunities. I'm open to provide TA and educational services.

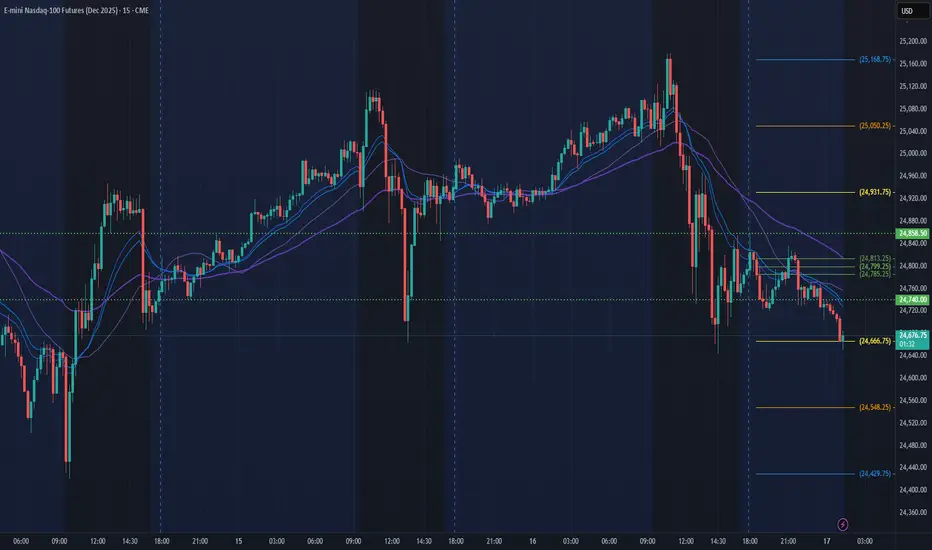
NQ Power Range Report with FIB Ext - 10/17/2025 SessionCME_MINI:NQZ2025
- PR High: 24858.50
- PR Low: 24740.25
- NZ Spread: 263.5
Key scheduled economic events:
08:30 | Nonfarm Payrolls
- Average Hourly Earnings
- Unemployment Rate
Session Open Stats (As of 12:45 AM)
- Session Open ATR: 391.21
- Volume: 43K
- Open Int: 283K
- Trend Grade: Long
- From BA ATH: -2.7% (Rounded)
Key Levels (Rounded - Think of these as ranges)
- Long: 26020
- Mid: 23571
- Short: 21939
Keep in mind this is not speculation or a prediction. Only a report of the Power Range with Fib extensions for target hunting. Do your DD! You determine your risk tolerance. You are fully capable of making your own decisions.
BA: Back Adjusted
BuZ/BeZ: Bull Zone / Bear Zone
NZ: Neutral Zone