NASDAQ NQ A Breakout Can Come, Wait For The ConfirmationAs I posted earlier, all of our FCP levels and zones have been working great and have given us tremendous opportunities. Now NQ is back at the upper zone and the momentum is looking great. If this breakouts we can test previous high and possibly go to all time highs.
I have updated a few new levels on the chart.
Trade what you see, wait for the confirmations and manage the risk as always.
Follow for more. Please support this analysis by liking, commenting, and sharing with friends, colleagues, traders, and trading communities. Thanks👍🙂
Fibonaccianalysis

NFLX (Netflix) Possible Buy OpportunityNetflix along with several other NASDAQ stocks have been taking good levels of corrections. I posted about Microsoft yesterday too.
Netflix is running inside an ABCD pattern which can bring it down to the 50% retracement level around 75.66. However, this can only happen if the current support is broken and a bull trap is set. There are a few more levels which can be good levels to BUY or for Dollar Cost Averaging but they are not in the scope of this simple analysis as of now.
Lets wait and watch and always this is not and advice but just an observation. Risk management is extremely important as always.
Follow for more. Please support this analysis by liking, commenting, and sharing with friends, colleagues, traders, and trading communities. Thanks👍🙂

Star Cement — The Quiet Phase Before the Next Big Move?📉 Star Cement — Primary Wave-4 & Wave-5 Context (Elliott Wave Study)
This post is an educational Elliott Wave structure study 📚 based on the current weekly and daily chart of Star Cement.
Star Cement completed a strong multi-year advance 🚀 from the 2022 lows, peaking near the ₹308–310 region . This advance shows classic characteristics of a Primary Wave-3 , including strong momentum, broad participation, and a terminal phase near the highs.
After the peak, price behaviour shifted from trending to overlapping and corrective , suggesting the market has transitioned into a Primary Wave-4 phase . Among the common corrective patterns, a Flat (A-B-C) structure currently best explains the price action.
Within this interpretation, Wave A declined from ~₹308 to ~₹245 and showed overlapping characteristics rather than a clean impulse. Wave B retraced weakly toward ~₹270 and lacked impulsive strength, which is typical behaviour within flat corrections. Wave C is currently unfolding with overlapping internal swings and reduced momentum, supporting the view that this is a corrective decline rather than the start of a new impulsive downtrend.
From a structural and Fibonacci perspective 📐, the chart highlights a broader confluence area between ₹195 and ₹205 , corresponding to the 0.618 retracement of the entire Primary Wave-3 and the 1.272 extension of Wave A. An extended confluence area is also visible around ₹185–190 , near the 0.786 retracement of Primary Wave-3. These zones are presented purely as areas of analytical interest where flat corrections often mature, not as signals.
In educational terms 🎓, a Flat-C phase typically ends quietly rather than dramatically . Behaviour consistent with a maturing correction would include price stabilising within the ₹185–205 zone , smaller and overlapping candles, failed breakdown attempts with quick recoveries, and the emergence of a clean directional move away from the zone. In contrast, continuation of the correction would be suggested by impulsive downside expansion below ~₹185 , increasing range and volume on declines, and weak rebounds that remain capped below prior resistance zones.
The projected Primary Wave-5 🔵 (shown in blue on the chart) is included strictly for higher-degree context. Wave-5 scenarios are only studied after Wave-4 has fully resolved and the structure transitions from corrective to impulsive. Historically, Primary Wave-5 advances tend to be more selective, often shorter than Wave-3, and occur only after prolonged consolidation or correction. The Fibonacci extension zones associated with Wave-5 are theoretical reference levels that illustrate how analysts frame potential future paths, not expectations.
At this stage, Star Cement remains in a Primary Wave-4 corrective environment . The focus is on observing structure, momentum, and confirmation rather than anticipating outcomes 🧠. Higher-degree trend continuation can only be discussed after the correction completes and the market clearly proves a change in behaviour.
📉 Star Cement — Blue Wave-4 on Daily Timeframe (Elliott Study)
After the advance into the ₹308–310 zone 🚀, price behaviour shifted from trending to overlapping and corrective , marking the development of blue Wave-4 on the daily chart. This phase is characterised by segmented declines , frequent counter-trend bounces, and fading momentum , rather than impulsive selling.
Blue Wave-4 is interacting with a key ₹195–205 confluence zone 📐, with a deeper reference near ₹185–190 , areas where corrective waves often stabilise. Wave-4 corrections typically resolve quietly through time and overlap ⏳, not sharp reversals.
This study is shared strictly for educational and analytical discussion and does not constitute investment advice ⚠️.

The Silver Bullet
Silver is back on the rise and showing increasingly strong bullish momentum despite the numerous large accounts on social media trying to pin the top and boast short entries that are currently suffering severely.
On 10/29/24 I described a breakout move occurring where price would see an initial rejection of the $53-$57 range before exploding to a target range of $79 and $132. I don't care to explain where these levels are derived from in great detail in order to preserve a part of my edge through a unique application of Fibonacci.
Aside from the 2.618 @ $132.01 being primary target at this stage in the parabola:
Special interest to the $108-$110 range just ahead here upon break of $96.72. Method implies the next intermediary rejection and reconsolidation begins there, with true support laying at $79.81 in the event of a rejection.
Good luck!

Gold/Silver Ratio Has Reached An Important LevelGold/Silver Ratio Has Reached A Crucial Level which can provide support. We have 78.6 Fibonacci level along with structure support. Both of them if the market allows, it can bounce from here.

PM | Tobacco On The Rise | LONGPhilip Morris International, Inc. is a holding company, which engages in the business of delivering a smoke-free future and evolving a portfolio for the long term to include products outside of the tobacco and nicotine sector. It operates through the following geographical segments: Europe Region (Europe), South and Southeast Asia, Commonwealth of Independent States, Middle East, and Africa Region (SSEA, CIS, and MEA), East Asia, Australia, and PMI Duty Free Region (EA, AU, and PMI DF), and Americas Region (Americas). The Europe segment includes all the European Union countries, Switzerland, the United Kingdom, Ukraine, Moldova, and Southeast Europe. The SSEA, CIS, and MEA segment focuses on South and Southeast Asia, the African continent, the Middle East, Turkey, Israel, Central Asia, Caucasus, and Russia. The EA, AU, and PMI DF segment is involved in the consolidation of international duty-free business with East Asia and Australia. The Americas segment is comprised of the United States, Canada, and Latin America. The company was founded by Philip Morris in 1847 and is headquartered in Stamford, CT.

Possible M pattern on GBPAUD for quick one, confirmation neededPossible M pattern on GBPAUD for quick one, confirmation needed
M pattern completed
Trend Line
Support

USDCAD Possible W Pattern and other scenariosUSDCAD has been very bullish in recent times.
However it is now forming and nearly has completed a W pattern. Tuis can create a correction.
If the price stay bullish and the previous high become support then it can rise much higher the the anticipated level.
Trade what you see.
Please support this analysis by liking, commenting, and sharing with friends, colleagues, traders, and trading communities. Follow me for more of these. Thanks👍🙂

BTC — Cypher Pattern, Fading Momentum & What Comes NextAfter the –36% drop from ATH, Bitcoin has found support in the 80K–90K range, where price has now been chopping sideways for almost 60 days. This kind of consolidation is pretty typical after a sharp selloff.
Back in June 2025, I already mentioned that a potential Cypher harmonic could be forming on BTC. At the time it was still early, but months later the structure is lining up very cleanly and looks like it’s playing out step by step.
The 86K–82K zone remains a key support area that bulls need to defend. Losing this zone would be a big deal technically and would likely open the door for further downside.
Macro Context
Cypher patterns are powerful because they combine:
impulse exhaustion
failed continuation
deep retracement psychology
They tend to appear near major cycle inflection points, especially after extended bullish phases and distribution-style highs. This makes them particularly relevant in the current market environment.
Let’s break the structure down step by step.
Cypher Structure Breakdown (X–A–B–C–D)
BTC has respected the key Fibonacci relationships of a Cypher extremely well.
X → A: Impulse Move
This was a strong, clean impulsive leg showing clear bullish dominance and participation.
Psychology:
Late bears trapped, early longs confident
A → B: Pullback
Price retraced to 0.579, sitting nicely within the Cypher sweet spot (0.382–0.618).
Structure held, which is crucial.
Psychology:
Doubt kicks in → “Is the move over?” → weak hands get shaken out.
B → C: Expansion & Euphoria
BTC pushed to the 1.274 extension of XA, clearly exceeding point A.
This is where optimism peaked and momentum chasing kicked in.
Psychology:
FOMO → breakout buying → late-cycle confidence
C → D: Reversal Zone
This is the most important part of the structure.
0.786 retracement of XC
Completion zone around 65.5K
Strong overlap with:
2021 ATH
2024 trading range
Psychology:
Euphoria → disbelief → forced selling → acceptance.
Where We Are Now
Bitcoin is currently trading between C and D, meaning:
we’re in a corrective phase
volatility has faded
and for the first time in four years, we’re seeing a clear bearish bias after a long period of bullish momentum
100K psychological level remains the major overhead barrier. As long as price stays below this level, bulls are on the defensive.
Macro Check
The broader technical picture remains cautious:
Below previous yearly open (93.5K)
Above yearly open (87.6K)
Below weekly 21 EMA/SMA (98K-102K)
Above monthly 21 EMA/SMA (87K–89K)
Structurally, this looks very similar to previous cycle transitions where momentum slowly faded before deeper moves followed.
Scenarios Going Forward
🔴 Primary Scenario
If the Cypher continues to play out:
downside pressure persists
volatility expands near liquidity pockets
target zone sits around:
66K–64K, centered near the 0.786 Fib (~65.5K)
This would be a healthy macro correction.
🟢 Invalidation Scenario
The bearish structure weakens if:
BTC reclaims and holds above prior value
price shows acceptance above 100K
momentum flips bullish again
In that case, the Cypher either gets delayed or invalidated.
Final Thoughts
Right now, the data favors patience and caution.
The most ideal path would be:
a push into the 97K–100K resistance zone
followed by continuation lower toward the 74.5K year low, which I’d like to see taken out
In choppy conditions like this, no trade is still a trade. Staying flat, preserving capital, and waiting for clarity is often the smartest move. Plan your levels, set alerts, and only act when the market gives you a high-probability setup.
_________________________________
💬 If you found this helpful, drop a like and comment!

GBPUSD Swing Reversal Trade Possible ZonesGBPUSD has reached an FCP zone which can act as resistance. A W pattern has alco completed there.
If this one does not gold, then we have a level and another FCP zone above which should make the market go in to a correction at least for a little while.
Trade what you see, manage the risk.

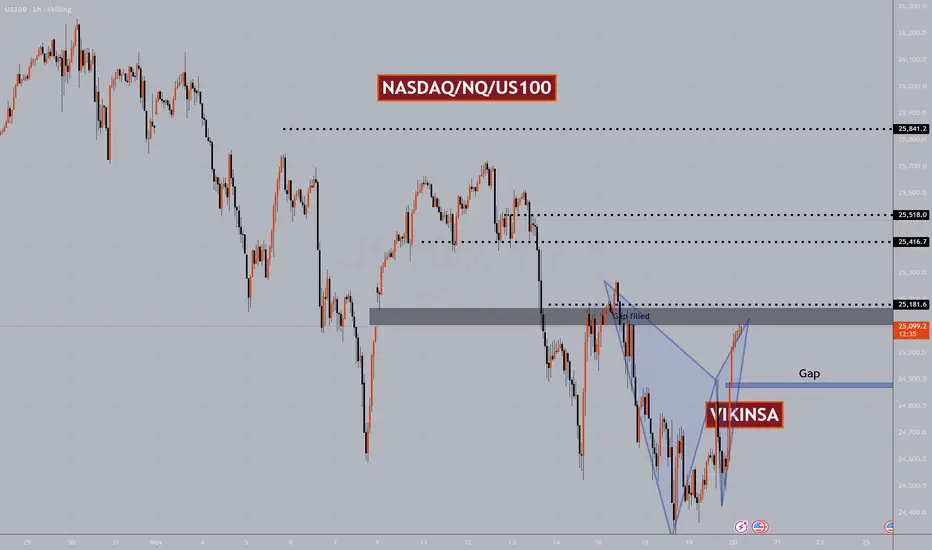
$NQ NASDAQ/US100 Bearish W Pattern Target Hit, Next Quick UpdateHi
The W pattern completed as expected and after that it fell. It reached the first bearish target. I personally am not looking for any more bearishness. I an bullish from the current levels. However I trade what I see and will plan after seeing the latest price action.
There was a big gap let. All these gaps may or may not get filled but they are important levels. So if the markets becomes bullish again, it may try to go higher from the current levels o fill that gap to the upside.
These is a previous gap level which can also provide support if the market falls from the current levels.
Trade what you see, wait for the confirmations and manage the risk as always.
Follow for more. Please support this analysis by liking, commenting, and sharing with friends, colleagues, traders, and trading communities. Thanks👍🙂

MY THOUGHTS ON USD/JPYIn my analysis of USD/JPY on the 4HR CHART, This currency pair is moving BEARISHLY to the next level of resistance at price of $114.302. In this analysis, I used the Fib and Trendline Analysis. OANDA:USDJPY

GOLD $GC XAUUSD Target Hit - UpdateTraders and Investors,
W pattern completed as expected and posted about a few days ago. This has given us a great long swing opportunity and then several long and short opportunities on smaller time frames. We have been trading around the levels and zones taking one of them at a time. Whereas one swing long position has been running for this W pattern completion target.
When W pattern completes the market take a correction, this is why today price fell a bit from the FCP zone as expected. It is now consolidating. Lets see if see a further correction or a breakout in the NY session.
Trade what you see, wait for the confirmations and manage the risk as always.
Follow for more. Please support this analysis by liking, commenting, and sharing with friends, colleagues, traders, and trading communities. Thanks👍🙂

GOLD $GC Levels and Patterns AnalysisTraders and Investors,
Gold (XAUUSD) has been consolidating mostly but still has been giving a lot of great short term and swing trade opportunities.
I have updated the important levels and zones which can act as support and resistance. They should guide us a bit for the best possible trade opportunities.
There as possible W pattern forming. It has not formed or completed yet. It must first break the trend line and confirm the break. BTW, that trend line can also give us a good opportunities around it. Next, the price has to break the mid point of potential W pattern. Once it has done that, it can complete the W pattern.
Trade what you see, wait for the confirmations and manage the risk as always.
Follow for more. Please support this analysis by liking, commenting, and sharing with friends, colleagues, traders, and trading communities. Thanks👍🙂

NASDAQ $NQ US100 Major Levels And PatternsNasdaq bounced yesterday heavily and completed a W pattern. I personally have been able to capture majority of this move. You can consider yesterday's W pattern a sort of double bottom which means hat more bullishness is expected in the medium term.
On a short term, now that it has completed a W pattern and reached previous important zone which had a gap, so we can expect a correction here but this may not be a big one. In a rare case there may not be any correction here at all because NASDAQ is forming a pattern which when forms usually ignores all the smaller W and M patterns.
For that reason my Bias is bullish and I will look for buying opportunities mostly.
There are certain Higher time frame levels that I am watching closely which you will find on the chart.
Trade what you see, manage the risk.
Follow for more. Please support this analysis by liking, commenting, and sharing with friends, colleagues, traders, and trading communities. Thanks👍🙂
Support and resistance key guide (Volume, Trendlines, FVG, MA)Support and resistance key guide (Volume, Trendlines, FVG, MA)
1️⃣ Importance of Support and Resistance in Highly Volatile Crypto Markets
The cryptocurrency market operates 24/7/365, exhibiting far greater volatility than traditional financial markets. This volatility presents substantial profit opportunities, but it also triggers intense fear and greed among investors, creating significant psychological stress.
Support and resistance serve as key milestones in this chaos, signaling zones where price reactions are likely. Beyond mere technical analysis, they reflect the collective psychology of countless traders. Understanding them is essential for success in crypto trading.
2️⃣ The Nature of Support and Resistance and Their Psychological Basis
Support and resistance occur where buying and selling pressures strongly collide, slowing or halting price movement.
Support:
At this level, buyers see the asset as "cheap enough!" and stand ready, forming a psychological and physical barrier against further decline. Additionally, traders previously trapped in losing positions may sell at breakeven, adding resistance against further drops.
Resistance:
At this level, sellers perceive the asset as "expensive enough!" and offload positions, while traders previously trapped at highs may sell with a "better late than never" mindset, limiting upward movement.
※ Meaning of Support/Resistance Breakouts and “Fakeouts”:
When a support level is breached, existing buyers may panic and trigger stop-loss selling. Conversely, breaking resistance may prompt buyers to enter, accelerating the trend.
However, some breakouts can be “fakeouts,” designed to exploit trader psychology. Premature chasing of such moves should be avoided.
3️⃣ Key Support and Resistance Pattern Analysis
📈 Trendlines and Consolidation Zones: The Psychology Behind Market Order
Trendlines: Trendlines visually represent the shared expectation among traders that price will move in a certain direction. Touching an upward trendline triggers “buy at a bargain” psychology, while touching a downward trendline triggers “it can’t go higher” sentiment.
Consolidation Zones (Boxes): These are zones where buying and selling pressures balance each other. Traders plan trades around these zones, dominated by the “waiting for breakout” psychology to capture significant moves.
📈 FVG (Fair Value Gap): Market Inefficiency and Smart Money Footprints
FVGs occur when the market moves too rapidly through a price range, leaving a “price gap.” They often reflect sudden activity by smart money (institutions, whales).
Gap Filling:
Markets instinctively avoid leaving incomplete states (FVGs) unaddressed. When price re-enters an FVG zone, the players who drove the prior rapid move may close or re-enter positions, forming support/resistance. Beginners can treat FVGs as smart money footprints and follow their activity strategically.
📈 Moving Averages (MA): Collective Psychology and Trend Direction
Moving averages reflect the average price perceived by the market over a period. Being widely monitored, they act as psychological support/resistance levels.
Short-term MA (e.g., 50MA): Reflects short-term trader sentiment. Price below it can trigger “short-term trend broken?” anxiety, while above it fosters optimism.
Long-term MA (e.g., 200MA): Represents long-term trader psychology and trend direction. Price below 200MA creates fear of a long-term downtrend, while above inspires hope of a sustained uptrend. When acting as support/resistance, MAs carry strong psychological consensus as a widely observed benchmark.
📈 POC (Point Of Control) Volume Profile: Market Consensus and the Power of Volume
POC is the price level with the highest traded volume over a period. It indicates market agreement on price, with substantial volume concentrated there.
Price below POC: POC becomes strong resistance. Buyers trapped in losing positions may sell at breakeven, and sellers actively resist upward moves.
Price above POC: POC acts as strong support. Buyers believe “price won’t fall below this level,” and prior sellers may switch to buying.
POC represents the market’s “expected price” and the zone where loss-aversion psychology is strongest.
📈 Fibonacci: Natural Order and Human Expectation
Fibonacci retracements apply golden ratio mathematics to charts, reflecting the expectation that price will reverse at certain levels, forming support/resistance.
These levels are not coincidental; many traders plan trades around them, causing real market reactions.
Levels like 0.5 (50%) and 0.618 (61.8%) are psychologically significant, viewed by traders as buying or selling opportunities. Support/resistance forms through “herd psychology,” as many act in unison.
📈 CME Gap: Institutional Moves and Market Regression Instinct
CME gaps occur in Bitcoin futures dominated by institutional investors. They happen when the spot market moves over weekends while futures are closed, and the market tends to “fill the gap.”
Gap Filling: CME gaps represent periods without institutional activity, prompting the market to normalize these “abnormal” price zones.
Traders anticipate “the gap will eventually be filled,” making these zones potential strong support/resistance, reflecting future-oriented market psychology.
4️⃣ Managing Trading Psychology Using Support and Resistance
Even the best tools are ineffective without psychological discipline.
Confirmation bias and stop-loss discipline: Ignoring losses due to selective perception leads to ruin. When support breaks, acknowledge your prediction was wrong and act decisively to exit.
Overbought/oversold psychology and FOMO:
Avoid chasing price surges out of fear of missing out (“everyone else is profiting, why not me?”).
During crashes, resist panic selling at the bottom. Base trades on your rules derived from support and resistance.
Partial trading for risk management:
Avoid buying all at support or selling all at resistance at once. Splitting trades across multiple support/resistance levels provides psychological stability and reduces the impact of wrong predictions.
5️⃣ Comprehensive Strategy Formation and Practical Application Tips
Multi-level Support/Resistance Confluence: Overlapping zones (e.g., Fibonacci 0.618 + 200MA + POC + FVG bottom) create very strong support/resistance. These reflect collective trader agreement and can be traded with higher confidence.
Volume Analysis and Support/Resistance Strength: High volume at a zone confirms its significance. Reliable breakouts require strong volume, showing market participation and intent.
Develop Your Own Trading Plan: Don’t blindly follow all patterns. Choose indicators and methods that suit you to establish personal trading rules. Adhering to these rules maintains psychological stability and long-term success.
If you found this content helpful, please show your support with a Boost (🚀) and a comment (💬)! Your encouragement is a great motivation for us to create better analyses and content. You can also follow us to receive notifications about new posts.
FTSE 100 (UKX) | Targeting 17K → 23K → 50K The British Bull Awakens 🏴📈 | The British Bull Awakens 🏴📈 | The British Bull Awakens 🏴📈
Macro Wave 3 of SuperCycle 3 in full motion — 17K next, then 23K before Wave 4 reset and grand finale 50K .
The FTSE 100 is mid-way through its most powerful Elliott Wave phase in decades — Macro Wave (3) of SuperCycle (3).
A generational breakout is forming, with Fibonacci confluence and institutional flow pointing toward 17K and beyond. ⚡
🧩 The SuperCycle Map
📈 SuperCycle Wave (1) (1989–2000) → Globalization & tech boom = foundation of modern bull market.
📉 SuperCycle Wave (2) (2000–2009) → Dot-com + GFC reset the system with a 0.618 retrace.
⚡ SuperCycle Wave (3) (2009–Present) → Now in progress — a generational expansion wave unfolding.
Inside it:
Macro (1): 2009–2018 post-crisis recovery
Macro (2): 2018–2020 correction
Macro (3): 2020–Now → Targeting ~17,000
Macro (4): 2029–2033 est. → Retrace to 10–12K
Macro (5): 2033–2037 est. → Push to ~23,000
Then:
🌀 SuperCycle (4) = multi-year correction
🌟 SuperCycle (5) = grand finale toward ~50,000
💹 Wave Confluence & Fibonacci Geometry
2.618 extension → 17K (Macro 3 target)
3.618 extension → 23K (Macro 5 projection)
Historic 0.5–0.618 retraces at every cycle confirm proportional balance.
Long-term regression & wave symmetry both support this structure.
🧭 Smart Money & Market Structure
✅ Accumulation base: 7K–9K (institutional demand zones)
✅ Break of Structure (BoS) → confirmed expansion
✅ Fair Value Gaps below 9K → future liquidity magnets for Macro 4
✅ Continuous higher highs & order block footprints = Smart Money in control
📊 The FTSE remains in expansion phase , pushing through new structural highs as liquidity builds.
🌍 Macro Fundamentals
UK equities undervalued vs. global peers
Normalizing rates + disinflation = valuation tailwinds
Long-term flows into energy, AI, infrastructure
Institutional rotation into real assets supports the multi-decade rally
🎯 Targets Ahead
📍 Macro 3 (short-term): ~17,000
🔄 Macro 4 retrace: ~10–12K
🚀 Macro 5: ~23,000
🌀 SuperCycle 4 correction: multi-year base
🌟 SuperCycle 5: ~50,000
📈 This is the belief phase of a generational bull market — Macro Wave (3) within SuperCycle (3).
Patience now could pay off for decades.
💬 What’s your FTSE target — 17K, 23K, or 50K?
👇 Comment below and Follow for future wave updates & Smart Money confluence setups.
— Team FIBCOS
#FTSE100 #ElliottWave #SmartMoneyConcept #Fibonacci #WaveTheory #MarketStructure #MacroInvesting #TradingView #FIBCOS #BullMarket #Wave3 #PriceAction #UKX #Investing #MacroCycle

$IREN Fib projectionsNASDAQ:IREN has found support at the Fibonacci 1.0 level as well as the 55 EMA.
The next target to watch for is the 1.382 Fibonacci ratio, or potentially even the 1.618 Fibonacci extension.
So far, this could still be considered an ABC correction. However, if we surpass these targets in a five-wave downward movement, we might see even lower prices.
I do not currently hold a position in this stock, but I hope this information helps someone.

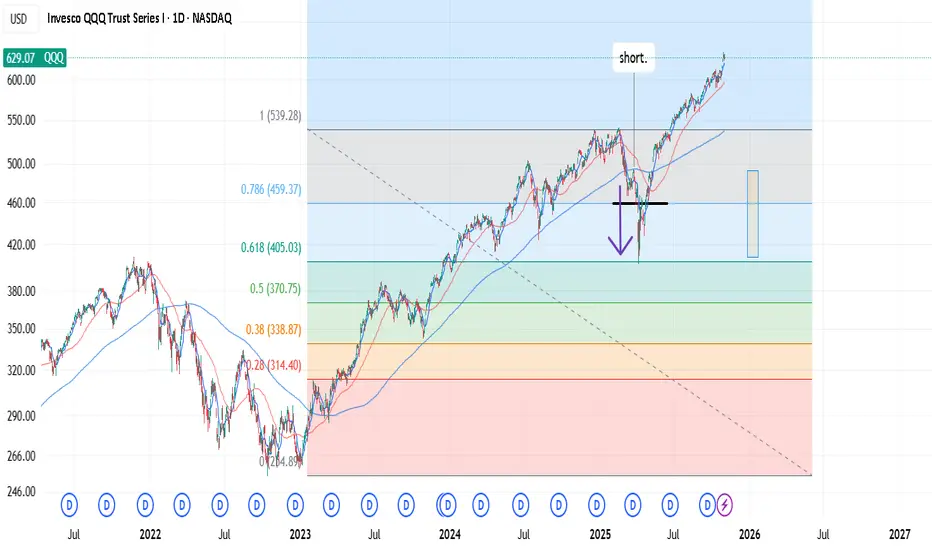
Fibonacci levels. Trading corrections.I saw a Lance B video saying that fibonacci is garbage that people use with a confirmation bias, and it doesn't work. (He says, anything besides the 50% FIB). His thesis is that fibonacci is a phenomenum from nature and at some point traders decide to test and apply it in markets.
I disagree. Using LOG trend, during corrections, prices respect the fib level ratio . It's math, more or less. I only trade tickers, if the moves are in the correlation with whole market (index). I also think, it's practical only on corrections, bear markets. 🤔
-> When the "key" level breaks, it tests the next level . Which isn't practical due to high variance.
-> which means, you build the shorts during last resistance . Where market forces pull over. (50dma death cross as a force).
(Your hedge is the inertia from 50dma DC).
I think this is a cool, powerful setup to keep it mind. 👏
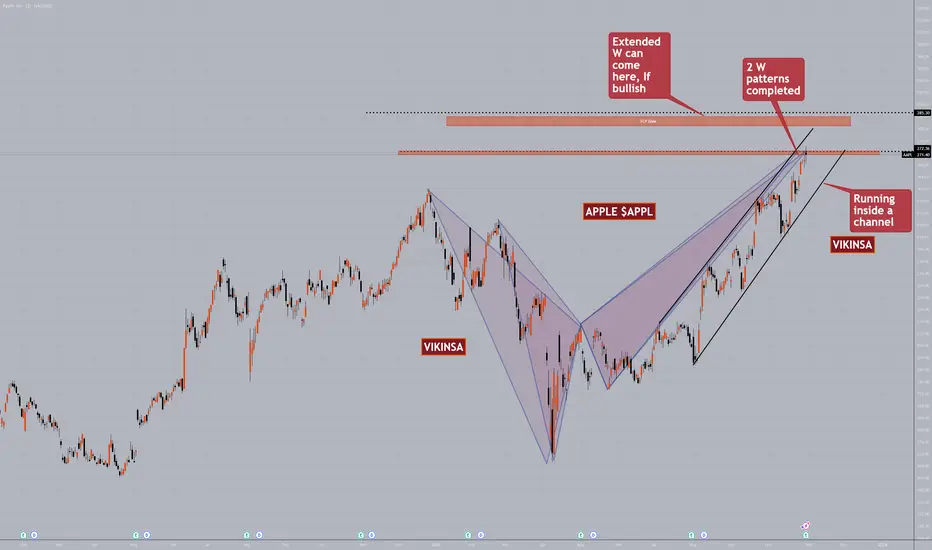
Is APPLE $APPL ready and primed for a correction?Apple BSE:APPL had a great run so far in the past few weeks. It has also been running inside a channel which has pushing the price upwards. However, now it has just completed an extended W pattern. In fact 2 of them got completed exactly at the same level.
The current price level is something that needs to eb watched very closely. When W patterns complete, markets tend to have a correction. Market is still bullish and is still inside the channel so even if the correction comes, we will have to be careful with the shorts.
If the market stay bullish from this point above at least on daily/weekly basis then we have an upper FCP zone where it can reach possibly take a correction from there.
In all cases, we must remember to wait for confirmations and obviously manage the risk.
DXY relative perf. to predict market tops.Using intermarket analysis. During expensive markets, demand for US dollar grows - and often it correlates with stock market tops. Step further - we can use intermarket analysis of DXY/SPX. Look for trend break out and Higher Lows in the structure. ✅

Bitcoin UpdateBTC/USD — The Range Squeeze Tightens: Volatility Decides Direction
Bitcoin remains confined within a bearish range between 113 000 and 116 000. Price sits on the sell side of deviation but has yet to return to discount since yesterday’s flush.
The active range squeeze forms between the bullish point of control near 104 000 and the bearish point of control near 111 000, where both sides continue to fight for conviction. Yesterday’s session cleared heavy bullish liquidation, leaving direction to whoever reclaims volume first.
Structure: Fibonacci geometry shows BTC pressing into bearish oversold zones. Momentum remains reactive—better suited for short, tactical trades.
Order Flow: Sellers defended the 114 000 region; volume still favors supply at the upper band.
Execution: Expect consolidation until a new catalyst breaks the compression.
Upcoming events—U.S. jobless claims, Fed remarks, and tech earnings—may reset volatility. Liquidity tone stays cautious; ETF inflows paused, and yields remain firm.
Patience isn’t waiting—it’s refusing to act in confusion.
For now, watch for a 1H structure shift lower or renewed bearish momentum.
Bounces toward 111–113 k remain tactical until a daily close confirms otherwise.
Bitcoin is coiled inside a range squeeze. One side will lose soon. Until then, probability—not prediction—defines discipline.
— CORE5DAN
Institutional Logic. Modern Technology. Real Freedom.

GOLD - BEARS PREPARING FOR THE NEXT MOVEGold has reached a strong resistance level around 4,380 and is currently showing signs of a pullback. After nine consecutive weeks of gains without a single red candle—a rare occurrence in gold’s history—market participants should anticipate a potential correction phase.
The 4,305–4,337 zone will be a key area to watch for a possible retest before the next move lower. If price fails to break above that zone, the downside targets remain at 4,110 and 4,040.
Overall bias stays bearish as long as gold trades below 4,380.
