GOLD → Consolidation before the next rally?FX:XAUUSD is trying to consolidate above the psychological threshold of 4200-4225 amid uncertainty surrounding the publication of US data after the end of the shutdown. Despite the resumption of government work, key reports for October may be lost...
Key factors: The House of Representatives has approved funding, ending the shutdown. However, data for October (including NFP and CPI) may not be published. We need to wait for confirmation... However, the restoration of statistics (possibly next week) will clarify the Fed's trajectory.
Fed support: 80% of economists surveyed by Reuters expect a 25 bp rate cut in December.
Gold retains its growth potential. The $4200 level is a key barrier, with the price entering a new trading range of 4200-4400. A breakout of the local trigger is possible if data is weak or the Fed confirms a rate cut in December...
Support levels: 4200, 4161, 4148
Resistance levels: 4239, 4274, 4317
Focus on local consolidation and the 4239 trigger. A breakout and close above this level could trigger further growth. Otherwise, the market may test 4220-4200 before resuming its rally. Overall, the market structure and sentiment are bullish.
Best regards, R. Linda!
Fibonacci Retracement

GOLD → Correction and retest 4150 FX:XAUUSD still retains its bullish structure. The price is entering a correction phase within the trading range. The key support level that may attract the attention of MM is 4150.
The probability of a decline in December fell to 51% (from 63% the day before) after hawkish statements by Fed officials. Government bond yields are rising. These factors are putting pressure on gold.
However, a weak dollar, a flight to safe assets amid global market sell-offs, and uncertainty surrounding US data (September reports may be published, but October data is likely to be lost) are providing support for the bullish trend.
Gold retains its growth potential due to macro risks. A short-term correction is possible due to profit-taking ahead of the weekend, but the $4150 level remains key support.
Resistance levels: 4211, 4239
Support levels: 4161, 4150, 4100
Within the current trading range, the focus is on support at 4161 - 4148. A false breakdown and bulls holding prices above key levels could trigger a rebound and growth to local resistance levels...
Best regards, R. Linda!

GOLD → Consolidation above 4100...FX:XAUUSD consolidates above $4,100 ahead of a key vote in the US House of Representatives on reopening the government. The rise is supported by weak employment data and expectations of Fed policy easing...
Key factors: Losses of more than 11,000 jobs per week until the end of October have heightened concerns about the labor market. The probability of a Fed rate cut in December has risen to 68%. Lower government bond yields and a weaker dollar have supported gold.
The resumption of data publication after the shutdown may change market sentiment (it is important to monitor actual data).
Gold retains its upside potential, but a short-term correction is possible. The outcome of the vote in Congress will determine the immediate dynamics.
Resistance levels: 4148, 4161
Support levels: 4097, 4075, 4046
If the bulls keep gold above 4100-4120, then in the short term, the market will be able to test resistance for a breakout. However, as a primary retest, I expect a rebound before the breakout and growth, provided that the fundamental background remains unchanged and continues to support the market...
Best regards, R. Linda!

BITCOIN → Flagship within the trading range BINANCE:BTCUSDT.P is trading within a wide trading range of 99K - 105K, with the market attempting to form an intermediate bottom at 101K. However, the trend is downward...
Bitcoin, within the downward trend, is rebounding from support at 101K and, against the backdrop of locally positive news, is striving towards resistance at 105300. However, the downward trend and the opening of the session far from the key zone of interest are negative prerequisites for the current situation. Within the daily rally, the potential for continued growth may be exhausted. There is a hunt for liquidity within the trading range. A retest of resistance may end in a false breakout and a decline in the trend...
Resistance levels: 105300, 107300
Support levels: 103000, 101130, 98900
The price is within the trading range, and there are no clear prerequisites for the price to break out of the current flat. Accordingly, I expect trading within these limits to continue. A false breakout of resistance (lack of momentum and potential for continued growth) could trigger a reversal of the local movement and a decline in price.
Best regards, R. Linda!

EURUSD → Correction for consolidation before growth FX:EURUSD is in a “liquidity hunt” phase, testing an intermediate support level, and may continue to rise if the dollar's decline intensifies...
On the daily timeframe, the price is within a wide trading range, but at the same time, it is breaking through the resistance of the local downtrend, which allows us to observe bullish sentiment in the market. The trend is changing, and there are local confirmations of the presence of bulls in the market...
Without reaching the resistance level of the range, the price is consolidating and correcting, testing the key support level of 1.1618. If the bulls hold this area, the price will continue to rise to 1.1667 - 1.1728.
Support levels: 1.1618, 1.1577
Resistance levels: 1.1667, 1.1728
A false breakdown and price consolidation above 1.1618 could lead to a continuation of the bullish momentum and the achievement of the first key target of 1.1667.
Best regards, R. Linda!

$BTC VERY Close to Forming a BOTTOMReceiving the end of cycle calls / texts from normie friends - one of my best indicators.
Bullish Divergence on the Daily.
Need some closes above the EMA9 ~$103k to confirm.
Then $107,5 next up.

EURUSD → An attempt to reverse the bearish trend...FX:EURUSD on the daily timeframe is breaking through the resistance of the downward price channel that has been developing for two months. Confirmation of the trend reversal is needed...
The dollar has been testing support at 99.3 for several days now, and the likelihood of a further decline is only increasing. The decline of the dollar will have a positive effect on the euro exchange rate.
The currency pair is forming a battle for the 1.1577 zone, a key area of support against the backdrop of an uptrend. If the bulls keep the price above this level, it will confirm the price entering a new trading range, which in turn will open the way to 1.1667.
Support levels: 1.1577, 1.1541
Resistance levels: 1.1622, 1.1667
A consolidation of the price above the support of the new trading range and a subsequent breakout of the local maximum could confirm a trend reversal, which could trigger a rally to 1.1667 - 1.174.
Best regards, R. Linda!

FINAL TRADE OF THE WEEK: CADJPY Follow-Through ExecutionSetup Analysis:
CADJPY formed a Momentum Low yesterday, followed by a sustained pullback/sideways pattern that established our structural point. This consolidation created the perfect setup for a continuation entry.
Trade Execution:
Entry triggered this afternoon after the break of the internal wave structure, confirming Sellers conviction and follow-through.
Trade Management:
Strong momentum immediately after entry
Target 2 (T2) achieved in under 2 hours
Profit: +50 pips
Exit Decision:
Position closed at T2 after price displayed strong reversal signals. This is mechanical trading—take profits when price action shows the move is exhausted.
Key Lesson:
The best trades are the ones where:
✅ Structure is clear
✅ Entry confirms momentum
✅ Price moves decisively in your favour
✅ You exit with discipline when reversal patterns emerge
This is the WavesOfSuccess methodology in action—patience for setup, precision on entry, discipline on exit.
Result: +50 pips in under 2 hours ✅
Have a blessed weekend! 🙏
👍 Hit the boost button if you found this valuable
👤 Follow for more educational trading content

Edelweiss Financial Services: Prempting a Big Breakout!🚀 Edelweiss Financial Services: Prempting a Big Breakout! 🚀
📉 CMP: ₹117
🔒 Stop Loss: ₹89
🎯 Targets: ₹145 | ₹159 | ₹195
🔍 Why Edelweiss Looks Ready for a Major Move?
✔️ Long-term Sideways Consolidation:
The stock has been consolidating for several months, indicating strong base formation.
✔️ Rounding Bottom Pattern:
Price structure shows a rounding bottom, suggesting accumulation at lower levels.
✔️ Box Compression:
Downside has been reducing with higher lows — a bullish sign of energy buildup.
✔️ Weekly Resistance Close:
Price is closing near resistance levels on a weekly timeframe, hinting at a potential breakout.
📈 Strategy:
Buy in tranches, since this is a pre-breakout entry. Gradual accumulation helps manage risk.
⚠️ Clarification:
This is an independent analysis based purely on technical and market study.
Religare Broking Limited is not involved in this view or recommendation.
📝 Important:
I am not responsible for any loss or profit.
I do not charge any fees – this is purely for educational and informational purposes.
📉 Disclaimer:
Not SEBI-registered. Please do your own research or consult a financial advisor before investing.

GOLD → The bullish trend continues its movement FX:XAUUSD is testing the $4,150 level, hitting a three-month high amid expectations of a resumption of US government operations and weak economic data. The weekly gain exceeded 3%.
Expectations of Fed easing - 64% probability of a rate cut in December, Consumer Sentiment Index (50.3) - lowest in 3.5 years.
Layoffs rose 183.1% in October.
The end of the shutdown will allow the release of missed data (NFP, CPI), which may confirm the need for a rate cut. All of this provides support for the metal.
Today, it is worth paying attention to ADP employment data (4-week average) — an assessment of the labor market.
Fundamentally, gold remains bullish thanks to a combination of monetary expectations and macro risks.
Resistance levels: 4150, 4160
Support levels: 4125, 4085
The trend is bullish and quite aggressive, with the market not allowing for deep pullbacks. Ahead lies resistance at 4150-4160, a fairly dense pool of liquidity that is likely to halt the current movement and trigger a small correction before continuing to rise to 4200-4250.
Best regards, R. Linda!

XRPUSDT → False breakout of resistance in a weak marketBINANCE:XRPUSDT faces strong resistance and forms a false breakout amid a weak market. Bearish pressure remains high...
Bitcoin failed to break through the 106K resistance and returned to the short zone, with the cryptocurrency market, including XRP, reacting with a decline... Overall, the market is in a weak phase and is not yet ready to move into strong growth. Consolidation may continue...
False breakout of resistance at 2.5530 amid a weak market. The market has no potential for continued growth, and a reversal pattern is forming, provoking a sell-off...
Resistance levels: 2.496 - 2.553
Support levels: 2.376, 2.24
A retest of the local base at 2.5 is possible before the decline continues. As part of the current movement, the market may test 2.37, but if the bulls fail to hold this zone, the coin may drop to 2.24.
Best regards, R. Linda!

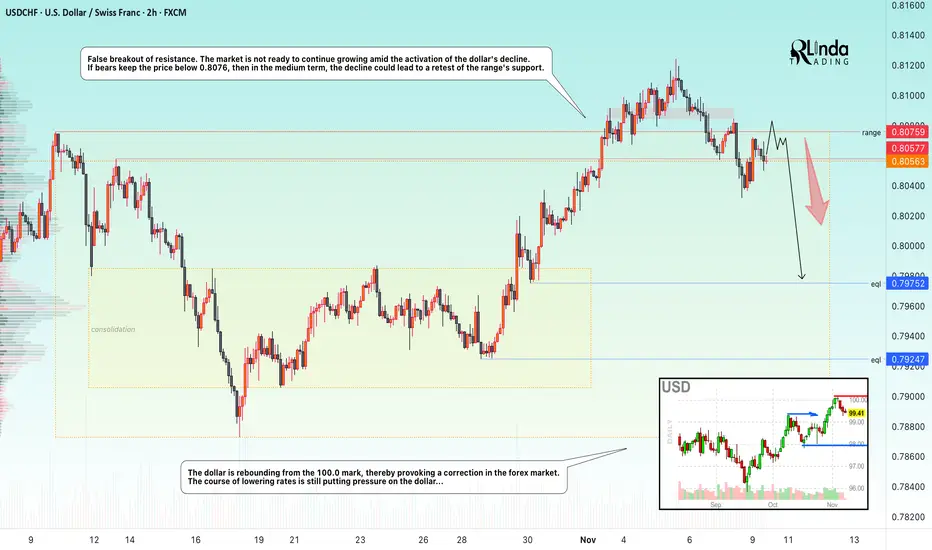
USDCHF → Manipulation? False breakout of resistance FX:USDCHF attempted to take advantage of the trend reversal opportunity after breaking out of a descending wedge, but the weak dollar hindered the rally...
The currency pair is facing resistance at 0.8076. There is no continuation of the momentum towards a breakout, and bearish pressure, which is intensifying as the dollar index declines, is negatively affecting the currency pair. The price has returned to the trading range, with an emphasis on 0.8057 - 0.8076. If the bears keep the price below this zone, this move could trigger further sell-offs.
Resistance levels: 0.8057, 0.8076
Support levels: 0.7957, 0.7925
The false breakout confirms that sellers currently have the upper hand and buyers lack the strength to push the price higher. Accordingly, consolidation below the key level could trigger a further decline towards the zone of interest at 0.7975.
Best regards, R. Linda!
USDJPY → Consolidation above key support. Growth?FX:USDJPY breaks the structure of downward resistance on the daily timeframe. A retest is forming as part of the correction, and bulls have every chance of growth...
The dollar is in an uptrend, which generally supports the currency pair.
Against this backdrop, the Japanese yen continues to weaken.
USDJPY is testing the previously broken resistance of the trading range as part of the correction.
However, the price was not allowed to fall and quickly returned to the long zone.
Accordingly, support at 153.0 - 153.2 plays a key role. Consolidation above this level could trigger further growth to 153.8 - 156.0.
Support levels: 153.23, 152.83
Resistance levels: 154.83, 156.0
The bullish trend may support the current movement, and a breakout of the trend resistance on D1 is a fairly strong sign of interest in growth against the backdrop of a strong dollar.
Best regards, R. Linda!

BTC/USD 1D Chart🧭 Overall Market Picture
Bitcoin is in a medium-term downtrend, as confirmed by:
a descending channel (marked with white lines),
lower highs and lower lows,
price below the key EMA and SMA.
The price is currently testing the upper boundary of this channel, so it will be crucial whether it manages to break out of it to the upside or rebounds further down.
🔹 Key Price Levels
Support:
$100,650 — short-term support, previously seen price reactions.
$98,550 — next demand level from late October.
$96,950 — lower boundary of the descending channel, potential target for continued declines.
Resistance:
$106,300–$106,500 — current resistance (upper boundary of the channel + SMA100).
$109,700–$110,000 — strong resistance converging with the EMA200 and SMA200.
$112,000+ — channel breakout and trend change.
🔸 Technical Indicators
1. MACD
The histogram is starting to turn positive (descending red).
The MACD line is attempting to cross the signal from below — a potential bullish signal, but not yet confirmed.
➡️ Indicates a possible short-term upward correction within a downtrend.
2. RSI (14)
Value: ~40.5 — low, but has rebounded from oversold levels.
No bullish divergence, but the RSI is rising from below, suggesting a potential technical bounce.
➡️ Still more upside than downside before entering the overbought zone.
🔹 Moving Averages
EMA50 (~109,970 USD) and EMA200 (~110,380 USD) are above the price, confirming the downtrend.
The EMA50 < EMA200 cross holds – a classic death cross.
SMA100 (~106,300 USD) has just been tested – a key level that could determine the direction of the coming days.
🔸 Short-Term Scenarios
🟩 Bullish (30–40% chance)
Breakthrough of the upper channel line (~106.5k USD) + daily close above 107k USD.
Confirmation of the MACD and RSI signal > 50.
Targets: 109,700 → 111,500 → 113,800 USD.
➡️ A medium-term trend reversal is then possible.
🟥 Bearish (60–70% chance)
Bounce from the upper channel line and fall below 102k–101k.
Continuation of the downtrend.
Targets: 100,600 → 98,500 → 96,900 USD.
➡️ In this scenario, the market will maintain a lower high/lower low structure.
⚙️ Summary
Trend: Down, but with a short-term rebound attempt.
Key moment: reaction to the 106k–107k USD level.
If the channel with volume breaks, a bullish reversal.
If a rebound, a new low around 97k–99k USD is very possible.

DXY, US DOLAAR UPDATEDXY — Structure & Flow Brief
DXY | Bullish Bias | Daily Frame | CORE5 View:
Dollar remains in short-term pullback mode inside a broader bullish structure, holding between 97.67 and 99.98 while traders watch this week’s macro lineup.
The key data hits Thursday and Friday — Jobless Claims, followed by PPI and Retail Sales.
Those reports will show if the economy is cooling or still running hot, shaping the next leg for the dollar.
Yields stay firm, keeping the tone quietly bullish, but most desks are flat until the data drops.
MSM — Market Structure Mapping (The Framework)
We’re trading inside a daily bearish candle, sliding into the imbalance near 98.964.
A close back above that cap would keep the broader trend context bullish.
If price doesn’t reclaim that level, the structure favors a move toward lower zones before the next leg.
VFA — Volume Flow Analytics (The Participation Map)
A main POC sits at 98.562, right inside the discount area of the range.
That’s a heavy-volume zone — price action can drive into it if downside momentum develops.
On news days, markets often run through these areas to clear liquidity before direction returns.
OFD — Order Flow Dynamics (The Behavior)
Price is currently parked inside an order-flow imbalance, filling single-print orders around 98.964.
It’s an absorption phase — volume is active, but larger players are keeping it balanced until catalysts arrive.
We’re seeing divergences across EURUSD, gold, and yields heading into Friday’s PPI and Retail Sales.
When the data hits, volatility often increases, and these imbalance zones tend to resolve.
PEM — Precision Execution Modeling (The Engagement Rules)
Trading the middle of the range is a low-edge play unless you’re scalping.
We’ve already had strong moves today, so there’s no reason to force new triggers here.
Within the CORE5 framework, we avoid engaging at the 50/50 range midpoint and wait for direction, confirmation, and flow alignment.
For now, it’s about risk control and patience until tomorrow’s data gives a clean framework signal.
CORE5 Rule of the Day:
Mid-range moves feed ego, not equity.
— CORE5DAN
Institutional Logic. Modern Technology. Real Freedom.

GOLD → False breakout of resistance after a rally...FX:XAUUSD is emerging from consolidation and entering a distribution phase. Spot metal is testing the 4085 mark, facing strong resistance amid progress in ending the US shutdown and weak economic data...
The US Senate has approved a funding bill, but the process takes time (voting in the House of Representatives and Trump's signature).
China: Gold ETFs rose 164% in the first nine months of 2025.
The People's Bank of China has been increasing its reserves for the 11th consecutive month (to 2,303.5 tons).
However, China's temporary easing of trade restrictions (exports of rare metals) supported risk-on sentiment. The probability of a Fed rate cut in December is estimated at 66%.
Technically, we have bullish signals, but after strong growth, there may be a pullback...
Resistance levels: 4085, 4100
Support levels: 4050, 4046, 4030
Gold is testing resistance as part of its bullish run, which is temporarily halting its strong growth. The market may lack the potential to break through resistance, and in order to build up this potential, the price may form a pullback or consolidation...
Best regards, R. Linda!

GOLD → Gold within the trading range...FX:XAUUSD is consolidating amid a pullback in the dollar and in anticipation of stronger key data as a driver for movement. Focus on the current trading range
On Friday, before the close of the session, the market formed a short squeeze, a strange volatility without news. It is important to monitor the Asian and European sessions and price behavior within the current trading range.
Earlier, we saw the dollar rise along with gold, indicating the strength of the metal and interest from the bulls. Let's assume that this situation has not yet run its course. In that case, after Friday's short squeeze, I expect MM to test liquidity in the 3985-3964 zone before a possible attempt to grow. Support from the upward channel may also affect the price. I still consider 4030 to be an important resistance level. If the bulls manage to break this barrier and keep the price above this level, gold will be able to end its correction and move into a growth phase. Otherwise, the market will tend to break out of the current consolidation downwards...
Resistance levels: 4020, 4030 - 4050
Support levels: 3985, 3963, 3931
Technically, while the price is within the trading range, it is worth considering trading relative to its boundaries. The fundamental background during the weekend is difficult to assess, so we will need to watch the situation during the European session...
Best regards, R. Linda!

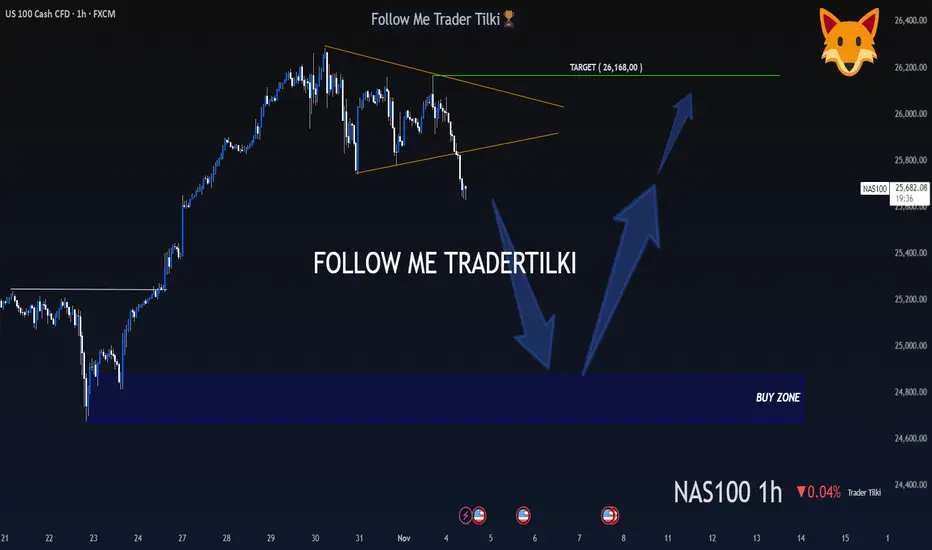
A Hunter Waits Patiently, Then Strikes Like a Lion - US100 - 1HMy dear friends, greetings,
My friends, I have set the buy levels for US100 at 24,872 and 24,677.
I will never enter a trade or put myself at unnecessary risk before these levels are reached.
My friends, in order to consistently win in this market and to become a successful trader, patience is essential.
If you act with patience and strategy, you will always be a winning trader, just like me.
I would also like you to know that my target is set at the 26,168 level.
My friends, every single like from you is my greatest motivation to share these analyses.
I sincerely thank everyone who supports me with their appreciation.
With my respect and love.
ETH/USDT 1D Chart📊 Current situation
• Price: approx. USDT 3,402
• Main trend: downwards - there is a clear downtrend line (black line) which acts as strong resistance.
• Key zones:
• Resistance: 3490-3990 USDT (green zones)
• Support: 3185 and 2700 USDT (red zones)
⸻
🧠 Market structure
• ETH moves below the trendline, confirming the dominance of sellers.
• After the recent decline, there was a rebound from the support at USDT 3185, but buyers' power is limited - daily candles have long upper wicks → supply pressure.
• If the price does not break through USDT 3,490–3,500, there is a risk of a retest of the USDT 3,185 support, and if it is broken, a possible decline to around USDT 2,700.
⸻
⚙️ Stochastic RSI (bottom of chart)
• Stochastic RSI is in the oversold zone (approx. 30), but the lines have not moved significantly upwards yet - i.e. there is no confirmed buy signal.
• If the indicator starts to curve upwards and crosses above 20, it could indicate a short-term rebound (upside potential to USDT 3,490).
⸻
🧭 Scenarios
🔺 Growth scenario (less likely)
• Breaking the trendline and staying above 3490 USDT will open the way to 3990 USDT.
• Requires increased buying volume (volume looks rather neutral for now).
🔻 Downside scenario (more likely)
• Rejection from 3490 USDT or from the trendline → drop to 3185 USDT.
• Breakout of 3185 = move to 2700 USDT (strong support from previous consolidations).
⸻
📈 Summary
• Trend: downward
• Short term: possible rebound to 3490, but the risk of further decline remains high.
• Key level to watch: 3,490 USDT (if it does not break, it is better to avoid longs).
• Potential long signal: only after breaking the trendline and retesting with confirmation of RSI > 50.

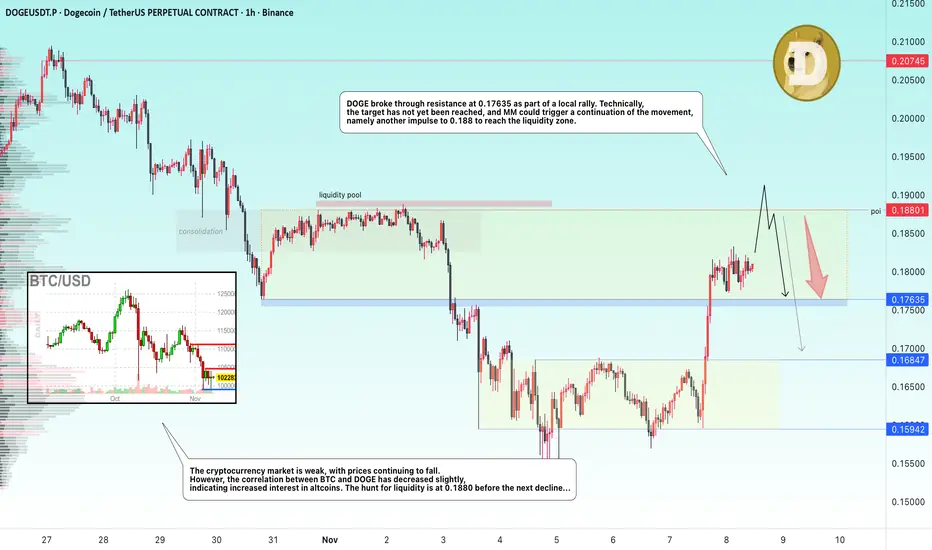
DOGE → The hunt for liquidity before the fallBINANCE:DOGEUSDT rose sharply on Friday. The reason is local news related to ETFs and Musk's tweet (it still works :) ). The growth potential may quickly exhaust itself...
The altcoin is strengthening, breaking resistance and consolidating between two important levels - 0.1763 and 0.188. The trend is bearish, the market is generally weak. I do not yet see any technical or fundamental potential for strong growth or a trend reversal.
In the current situation, DOGE may test the resistance zone of 0.188 due to the liquidity pool formed as part of local consolidation in early November. However, this liquidity pool may become a resistance to growth, which in turn may provoke a reversal and a fall.
Resistance levels: 0.188
Support levels: 0.1763
However, if the market does not allow the price to rise, it is worth watching the support level of 0.17635. Consolidation below this level will confirm the false breakout of the lower level and may trigger a decline.
Best regards, R. Linda!
LTC/USDT 1D🕵️♂️ The overall picture
• Price: 102.50 USDT
• Trend: The current downtrend is down (black downtrend line), but we are currently breaking above the trendline, which may signal a change in direction.
• Interval: Daily (1D)
⸻
📊 Key technical levels
• Resistance 1: 106.99 USDT
• Resistance 2: 119.25 USDT
• Support 1: 95.61 USDT
• Support 2: 89.65 USDT
• Support 3: 79.90 USDT
The current candle has broken above the downtrend line and the level of 95.6 USDT, which is a bullish signal.
⸻
🔥 Volume
• You can see a big increase in volume during today's bullish candle - this confirms that the buyers are in control.
• This is a classic example of a confirmed breakout from a downtrend.
⸻
📈 Candles
• Today's candle is a strong demand candle (green) with a large body.
• If today's close stays above the trend line (~100 USDT), it will be a technical confirmation of the breakout.
⸻
⚙️ Stochastic RSI indicator
• The blue line (RSI) is rebounding from the oversold area (<20) and heading upwards - this is a buy signal.
• The orange line begins to turn in the same direction, which may indicate the beginning of an upward impulse.
⸻
💡 Scenarios:
🟢 Growth scenario (more likely):
• Maintaining the price above 100 USDT = breakout confirmed.
• Potential targets:
• 106.99 USDT – first test of resistance, possible short pullback.
• 119.25 USDT – main target in the medium term (approx. +16%).
🔴 Downside scenario (if the breakout turns out to be false):
• Return below 95.6 USDT and closing of the daily candle there = false breakout signal.
• Then a possible decline to 89.65 USDT, and with further weakness even 79.90 USDT.

GOLD → The battle for the $4,000 zone. Are the bulls here?FX:XAUUSD is gradually recovering. The price is breaking through $4,000 and trying to stay above the key psychological level. Focus on 4,030–4,050...
Weak employment data, namely a sharp increase in layoffs in October, has heightened fears of an economic slowdown, a decline in government bond yields, and the ongoing correction of AI assets is fueling demand for safe havens.
The probability of a Fed rate cut in December has risen to 69%. The situation is stabilizing somewhat, there is no strong news today, and the market may try to maintain the current backdrop...
Gold retains its upside potential while macro risks remain. The $4000 level is currently acting as key support. Closing the week above this mark will open the way to test $4050.
Resistance levels: 4030 - 4050
Support levels: 4000, 3975, 3956
The dollar and gold are rising, and the inverse correlation is decreasing, indicating that bulls are still trying to keep the market from falling sharply. However, given the lack of drivers, strong news, and a clear fundamental backdrop, I would say that gold is not yet ready to break out of its current range. Consolidation above 4K could lead to a retest of 4030-4050, which in turn could trigger a pullback to local support.
Best regards, R. Linda!

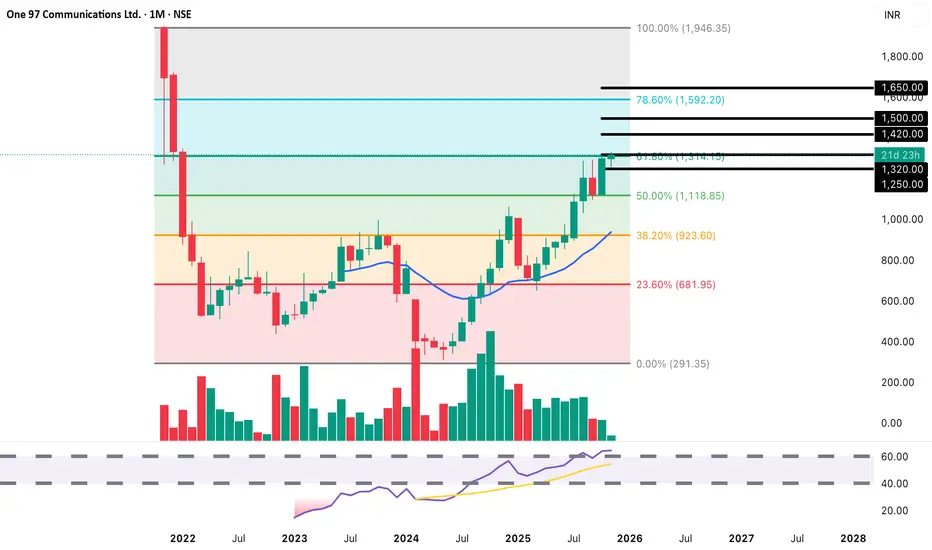
Paytm: 350% Recovery Rally! | Testing Key Fib Level BUY Setup 📱
Entry: ₹1,320-1,330 (Current Level)
Target 1: ₹1,400-1,420 (38.2% Fib)
Target 2: ₹1,500-1,550 (50% Fib)
Target 3: ₹1,650-1,700+ (Extended)
Stop Loss: ₹1,250
Technical Rationale:
MAJOR RECOVERY in progress from all-time lows around 290
Strong +1.34% gain today with exceptional volume (15.19M)
Testing critical 61.8% Fibonacci retracement level at 1,314 (marked "21d 23h")
Massive recovery rally from 290 to 1,320 = 350%+ move
Monthly chart showing strong uptrend with higher lows
RSI trending strongly upward around 60-65 zone
Breaking above multiple Fibonacci levels - bullish momentum
Volume consistently strong during recovery phase
Fintech sector regaining investor confidence
Clear support established at 1,200-1,250 zone
Next major resistance at 1,592 (78.6% Fib level)
Risk-Reward: Excellent 1:5+ ratio for extended targets
Pattern: Major recovery from bottom + Fibonacci retracement breakout on Monthly chart - extremely bullish long-term setup
Strategy: Long-term positional/investment approach
Book 20% at T1 (1,410), 20% at T2 (1,525), hold 60% for extended targets above 1,650+
Trail SL to 1,280 after crossing 1,400
This is a multi-month to year-long setup
Key Levels (Fibonacci):
Current Battle: 61.8% Fib at 1,314 (being tested now)
Next Resistance: 78.6% Fib at 1,592
Extended Targets: 1,946 (100% retracement to ATH from crash low)
Major Support: 1,118 (50% Fib), 1,000 (psychological)
Timeframe: Monthly chart - this is a long-term investment setup, not a quick trade
Historical Context:
Crashed from 1,950 to 290 (85% fall)
Now recovered 350%+ from bottom
Testing critical Fib level that often acts as last resistance before continuation
Volume: 15.19M - extremely strong for monthly timeframe, confirming institutional buying
For educational purposes only. Not SEBI registered.