BTC Trap & Reverse: The Power of SFPs in ActionBTC continues to chop in a tight range near its previous all-time high. While price action may appear messy at first glance, traders using a combination of structure, Fibonacci levels, and order flow tools are spotting clean opportunities — especially through Swing Failure Patterns (SFPs).
🔍 What Just Happened?
Bitcoin recently rejected from the 0.786 Fibonacci retracement level — a classic reaction zone. What made this move powerful was the SFP that formed at that level. Price swept above a prior high, triggering breakout buys, only to reverse. This type of move traps late longs and offers an ideal short entry.
🧠 Educational Insight: Why SFPs Are One of the Best Setups
SFPs (Swing Failure Patterns) are some of the highest-probability trades you can take for a few key reasons:
1️⃣ Liquidity-driven: They form where stop losses cluster — above highs or below lows — creating a magnet for price.
2️⃣ Clean invalidation: The wick high/low gives a natural stop-loss level, keeping risk tight.
3️⃣ Fast reaction: Once trapped traders are forced to exit, price often reverses sharply — giving you strong follow-through.
4️⃣ Confirmable with order flow: Using tools like Exocharts, you can see aggressive longs/shorts piling in just before the reversal. This adds conviction to the setup.
📏 Current Confluence:
Rejection from the 0.786 Fib retracement
SFP confirmed on high volume
1:1 trend-based Fib extension sits at ~$105,410
That level also lines up with the 0.666 Fib retracement
Anchored VWAP around $105K
Liquidity pool right at that zone too — a likely magnet
🎯 Trade Idea:
Short triggered at the SFP wick, stop just above it. First target: the 1:1 extension near $105.4K. Risk-reward is excellent with high probability if price continues to unwind late longs.
✅ Key Takeaway:
In ranges like this, you don’t need to guess direction — you need to react to structure. SFPs give you that edge. When paired with real-time tools like Exocharts and anchored VWAPs, these trades become sniper entries rather than coin flips.
Let the market show its hand — and trade the reaction, not the prediction.
📌 Summary:
This is how you avoid overtrading in chop: wait for key levels, watch how price reacts, and let trapped traders create the move. If BTC revisits the $105K region, it’s a major area to watch for reaction — or to take partials if you’re in a short.
The best trades come from patience + precision.
_________________________________
If you found this helpful, leave a like and comment below! Got requests for the next technical analysis? Let me know.
Fibonacci Retracement

GOLD → Consolidation ahead of news. Retest of resistanceFX:XAUUSD remained above the key support level of 3280 and is testing intermediate resistance. Against the backdrop of the dollar's decline, the metal has a chance to continue its growth...
Gold is trading in consolidation ahead of the Fed meeting minutes. Easing trade risks and the dollar's recovery triggered a correction from the recent peak of $3366. Against the backdrop of the dollar's correction, the metal is entering a phase of local rally and testing resistance at 0.5f
The Fed is maintaining a cautious tone, and the market is waiting for signals on interest rates. The escalation of the conflict in Ukraine and the threat of new sanctions from Trump did not cause significant concern in the markets. Investors are waiting for drivers
Resistance levels: 3322, 3348, 3363
Support levels: 3290, 3282, 3265
A small correction may form from 3322 before growth continues. The market is interested in liquidity in the 3348-3363 zone, and the price is likely to test this zone. However, further developments depend on the fundamental background. Rising economic risks or hints of interest rate cuts could support the price of gold.
Best regards, R. Linda!

EURJPY → False breakout of resistance. Reversal?FX:EURJPY is testing the resistance of the trading range as part of a distribution movement, but the situation ends with a false breakout and price consolidation within the flat.
Against the backdrop of the falling dollar, the Japanese yen is strengthening and thus exerting a corresponding influence on the currency pair. EURJPY is forming a false breakout of resistance within a distribution movement formed after a retest the support of the flat. The price returns to the channel. After a false breakout of resistance and a return of the price below a strong key level, a base is forming in the form of support at 163.2 (trigger).
Resistance levels: 163.4, 163.6
Support levels: 163.2, 162.7
A breakdown of the 163.2 trigger and price consolidation below the key level could intensify the sell-off, triggering a further decline.
Best regards, R. Linda!

BTC/USD 4h Chart ReviewHello everyone, I invite you to review the current situation on BTC. When we enter the four-hour interval, we can see how the BTC price is moving in the upward trend channel, in which several upward waves can be marked, which may indicate the beginning of another wave of growth.
Here you can see how the current rebound has brought the movement closer to a strong resistance zone from $ 110,400 to $ 113,200, only breaking out of this zone on top can give the price an increase in the area of strong resistance at $ 121,000.
Looking the other way, you can see that when the trend reverses, we first have a support zone from $ 106,600 to $ 105,400, however, if this zone is broken, we can see a quick return of the price to the area of strong support at $ 102,000.
The RSI indicator shows how a support line was formed from which the indicator bounced many times, giving the price an increase, while the MACD indicator maintained the upward trend and created room for another upward movement when the price recovered.

GOLD → Correction before possible growthFX:XAUUSD entered a liquidation phase (rally) within the trading range at the opening of the session. The dollar's rise is to blame. The focus is on supporting consolidation...
Investors remain interested in gold as a safe haven asset amid geopolitical risks and declining demand for US assets.
The key drivers remain news about tax reform in the US, trade negotiations, and upcoming macro data.
Gold is consolidating, but since the opening of the session, the price has been heading towards support. Against the backdrop of an upward trend, a trigger for bearish liquidity is likely to form before growth.
Against the backdrop of the dollar's growth, gold is entering a correction phase. At the moment, all attention is on support and the liquidity zone of 3265. A false breakdown will trigger a price buyback.
Resistance levels: 3322
Support levels: 3282, 3265
Since the price is still within the range and a countertrend correction is forming in the market, in our case, it is worth considering an intraband trading strategy. A false breakdown of support could trigger growth to intermediate resistance or to the upper border of the channel.
Best regards, R. Linda!

BITCOIN → False breakout of 110K. Negative background???BINANCE:BTCUSDT.P hit a new all-time high of almost 112K on the back of improved economic and fundamental data, but the party didn't last long before Trump's next speech...
Yesterday, Trump spoke and announced new tariffs on the EU. The markets reacted quite aggressively to this news. Despite the fact that the market has practically bought back all the losses, the question itself remains open. The introduction of 50% tariffs on Europe will increase the risk background, which could trigger a fall in both the stock market and cryptocurrencies. In this case, money will flow into gold (a safe asset)...
Technically, Bitcoin is forming a false breakout of the global resistance level of 110K (previous ATH). The price is reacting and forming a bearish momentum (coinciding with the change in the fundamental background).
The area between 109.8 and 110.3 is a resistance and liquidity zone relative to the previous ATH. If the bears hold the resistance, Bitcoin may get stuck inside the 110K - 106.8K (105K) range.
Resistance levels: 109.8K, 110.3K, 112K
Support levels: 106.8K, 105K
Accordingly, if the 110K resistance holds amid the correction, consolidation below the resistance will confirm the formation of a false breakout, and in this case, Bitcoin may move to the 110K (112K) - 105K (102K) range. However, situations change daily, and if Bitcoin does break through 110K and manages to consolidate above its previous ATH, this will be a signal for growth...
Best regards, R. Linda!

HH HL intact.FLYNG Closed at 50.80 (25-05-2025)
HH HL intact.
No Bearish Divergence yet on bigger tf.
54- 56 is the resistance for now.
If this level is crossed with Good Volumes,
we may witness further New Highs around 60+
On the flip side, 49 - 49.50 & then 47 - 47.50
may act as Good Support Levels.
However, breaking 45 will bring more Selling Pressure
towards 42 - 44

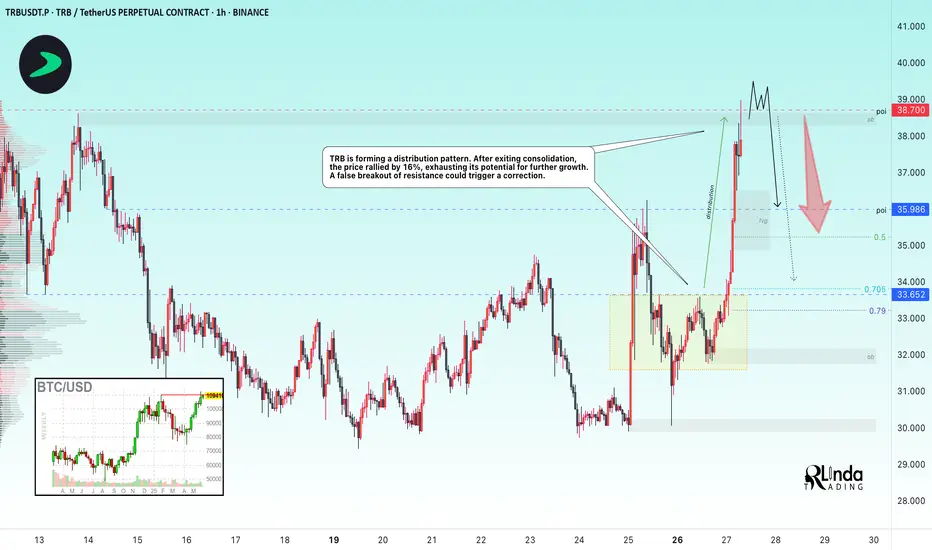
TRBUSDT → High probability of a false breakoutBINANCE:TRBUSDT.P is testing resistance in the 38,700 range as part of a rally. The current strong movement may end in a false breakout...
TRB is forming a distribution pattern. After exiting consolidation, the price rallied 16%, exhausting its potential for further growth.
A false breakout of resistance could trigger a correction.
Bitcoin looks controversial in the overall situation. After a false breakout of the 110K resistance, the price is consolidating below the level. If the flagship correction begins, it may also trigger a correction in altcoins...
Resistance levels: 38,700
Support levels: 35.98, 33.65
If the price fails to consolidate above the level and continue to rise, this will confirm the absence of bullish potential. A false breakout and price consolidation below 38.700 will trigger a correction to 36 - 33
Best regards, R. Linda!
GOLD → Consolidation. Retest of support before growthFX:XAUUSD is strengthening due to a complex fundamental backdrop. A false break of support at 3285 allows the price to update its local high to 3365.
Gold fell moderately from a high of $3365 amid weak activity due to holidays in the US, despite the weak dollar. Investors are taking profits ahead of US inflation data.
Pressure is also linked to hopes for a trade agreement between the US and Japan. However, the decline in prices is limited — geopolitical tensions, US budget problems, and instability in the Middle East are keeping demand for gold as a safe-haven asset.
Support levels: 3321, 3308, 3300
Resistance levels: 3363
Technically, gold is making a false breakout of consolidation resistance and is entering a correction phase, during which the price may test liquidity below 3320-3303 before continuing to rise.
Best regards, R. Linda!

USDCHF → Retest support with the aim of breaking throughFX:USDCHF is also losing ground amid the dollar's decline. The price is testing the support of the range, a break of which could open the way to 0.811
USDCHF is consolidating, but at the same time, a local downward channel is forming. The currency pair is retesting support within the current downward movement. A pre-breakdown consolidation is forming relative to 0.819. The fall of the dollar is having a corresponding effect on the price.
Before continuing its decline, the currency pair may form a retest of 0.5 Fibonacci or close the FVG
Resistance levels: 0.825, 0.8275
Support levels: 0.819, 0.8117
The downward structure will break down when the price leaves the downward channel. However, at the moment, while the price is consolidating at the bottom of the trading range, I expect a breakdown of support in the short term, followed by a continued decline to 0.811 - 0.805
Best regards, R. Linda!

Grass short (scalp)Grass short retesting golden zone of fib 0.5 / 0.618
If we have a rejection in that zone then it can be a new support en we can look for an entry for long position.

Equity Research Flash – Hexaware Technologies Ltd.CMP: ₹722.35 | Bullish Momentum Post Trend Reversal
HEXT shows a bullish breakout from a falling trendline, with RSI near 60 and strong volume uptick. The price reclaimed the 0.5 Fibonacci level, eyeing next targets at ₹749.85 (0.618) and ₹793.35 (0.786). Fundamentally strong with robust revenue growth, improving ROCE (26.4%), and low debt. A move above ₹750 could trigger further upside. Accumulate on dips with SL at ₹688.
Recommendation: Positive | Buy on Dips Near ₹700
For Education Purpose only

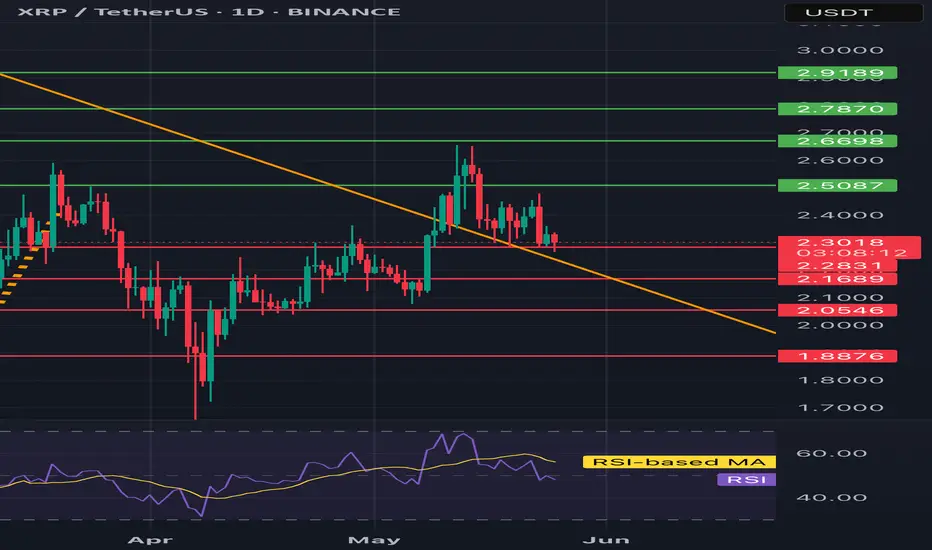
XRP/USDT 1D chart reviewHello everyone, let's look at the 1D XRP chart to USD, in this situation we can see how the price lasts above the downward trend line.
Going further, let's check the places of potential target for the price:
T1 = $ 2.51
T2 = $ 2.67
Т3 = 2.79 $ t4 = $ 2.92
Let's go to Stop-Loss now in case of further declines on the market:
SL1 = $ 2.31
SL2 = $ 2.17
SL3 = $ 2.06
SL4 = $ 1.89
Looking at the RSI indicator, you can see how he reacted and returned to the middle of the range, which creates a place for a panty growth.
Nifty50 – Wave IV Unfolding Within the Grand SupercycleFrom the Grand Supercycle perspective on the monthly chart, we can observe a consistent pattern — every major a-b-c corrective phase has unfolded as a form of flat correction before the next rally. Based on this historical rhythm, and the current market structure, I believe we are still in the process of completing Wave V of the Grand Supercycle.
This long-term view is overlayed on the chart to help contextualize what’s happening now.
Zooming In – The Weekly Breakdown Within Wave IV and V:
Within this broader Grand Supercycle, the weekly chart captures a five-wave subdivision between Supercycle’s Wave IV and the yet-to-be-completed Wave V.
Wave III has completed after achieving a 100% projection of Wave I from Wave II , respecting classic Fibonacci symmetry.
After the Wave III high, we’ve entered a correction phase , where sub-wave b is currently unfolding.
Flat Correction in Play?
For the current move to qualify as a Flat correction:
Wave b must retrace at least 90% of Wave a .
This requirement is crucial to maintain the “Flat” identity of the structure.
Depending on the nature of the flat:
If it’s a Regular Flat or Expanding Flat, Wave c must break below the bottom of the rising parallel channe l, and end below the low of Wave a .
If it’s a Running Flat , Wave c can stay above Wave a’s low, and price may remain within or near the channel’s lower boundary.
Also, as per EW guidelines, Wave c must unfold in 5 waves — which will be the next key structure to monitor.
Where Are We Now?
As long as Wave b is progressing toward 90% retracement , the near-term bias remains bullish.
But once Wave b completes, the market may enter Wave c, which could result in a deeper correction — either towards the lower end of the channel or even below, depending on which flat structure plays out.
What Next?
This unfolding Wave c will likely complete Wave IV within the Grand Supercycle, setting the stage for the final upward move — Wave V of both the internal 5-wave structure and the Grand Supercycle itself.
Disclaimer: This is not a buy or sell recommendation. The analysis shared is purely my personal view for educational purposes only.

Potential Inverse H&S120660 should be Crossed & Sustained
for further Upside (with Good Volumes)
Inverse H&S Potential Target is around 138000-140000

$BTC to Retest .786 Fib Next ~$102k - BTFD!timberrrrr
the crypto gods shall giveth one last chance.
buy the fckn dip!!!

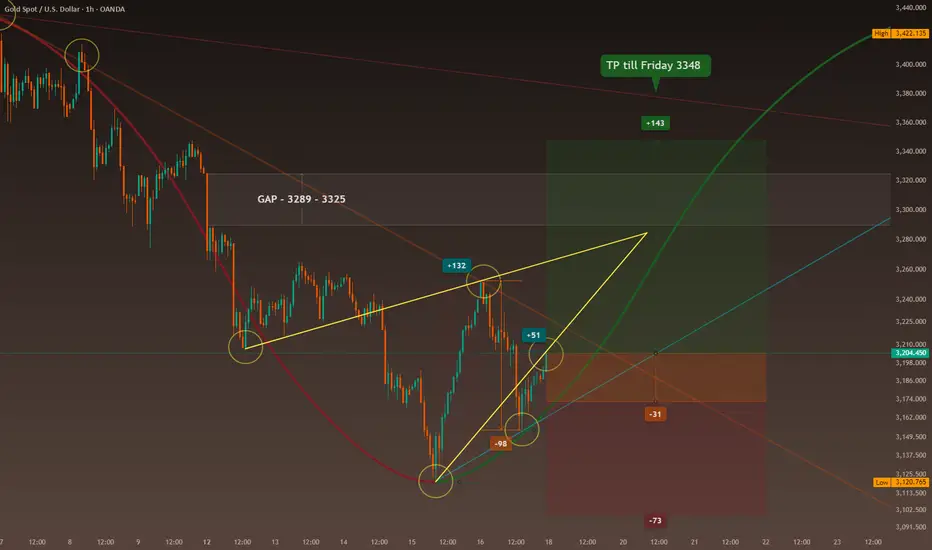
Smells Like a Trend ReversalWeekly Recap – Gold Market
Monday, May 12, 2025
The week began with a sharp GAP during the Asian session (starting around 1:00 AM London / 8:00 PM New York on Sunday) :
Gold dropped abruptly by $60, from $3,325 to $3,266.
The catalyst was a temporary easing of trade tensions between the U.S. and China, following weekend negotiations that led to a 90-day tariff pause.
During the European session (starting at 8:00 AM London / 3:00 AM New York) , the downtrend continued, pushing the price further down to $3,207.
Tuesday–Wednesday, May 13–14
Between these two sessions, the price consolidated within a narrow range of $3,265 to $3,202 (63 $ range).
Despite better-than-expected U.S. inflation data, there was no significant breakout—the market remained indecisive.
Wednesday, May 14 – European Session
The price continued its descent, falling from $3,243 to $3,168—a $75 drop—indicating persistent downward pressure despite macroeconomic stability.
Thursday, May 15
The Asian session (1:00 AM London / 8:00 PM New York) began quietly, with a range between $3,168 and $3,192.
Then a sharp drop to $3,123 followed (down $71), triggered by new statements from President Trump, who announced potential trade deals with India, Japan, and South Korea.
In the European session (8:00 AM London / 3:00 AM New York) , a strong reversal occurred.
After failed peace negotiations between Russia and Ukraine in Istanbul, and due to growing geopolitical uncertainty plus a weakening dollar, gold surged by $132, from $3,120 to $3,252.
Friday, May 16
The Asian session opened slightly bearish, with gold dipping from $3,252 to $3,218.
However, bullish momentum returned during the European and U.S. sessions, continuing Thursday’s upward trend and adding $51 by day’s end.
📰 Geopolitical News Landscape
India / Pakistan
Since the Kashmir terror attack on May 9, 2025, tensions have escalated again.
Cross-border airstrikes and border closures have resumed. A fragile ceasefire, brokered by the U.S., is under pressure.
Disputes over water rights further strain relations.
➡️ Short-term outlook: high tension remains.
Gaza Conflict
On May 9, Israel launched Operation Gideon’s Chariot against Hamas, aiming to dismantle the group and rescue hostages.
Over 300 deaths have been reported. A leaked plan suggests Gaza will be divided into three heavily controlled zones.
The humanitarian situation is catastrophic (over 53,000 deaths since 2023).
Peace talks are underway in Doha, but the situation remains dire.
➡️ No relief in sight.
Russia / Ukraine
Direct talks were held in Istanbul for the first time in three years.
While a prisoner exchange (1,000 each side) took place, no substantial progress was achieved.
Russia demands Ukrainian troop withdrawals from contested areas—Kyiv refuses.
Simultaneously, Russian attacks intensified, including drone strikes on Sumy.
➡️ A ceasefire remains unlikely in the near term.
U.S.–China Trade War
A 90-day tariff pause was announced the weekend before May 12:
U.S. tariffs cut from 145% to 30%
Chinese tariffs reduced from 125% to 10%
Markets reacted positively at first—especially in retail and shipping sectors.
➡️ However, unresolved structural issues (e.g., tech transfers, export controls) keep tensions fragile.
No comprehensive deal is in sight.
⚖️ Trump vs. Powell
Tensions escalate between President Trump and Fed Chair Jerome Powell:
- Trump demands aggressive rate cuts
- Powell warns of inflation risks
- The Fed holds the interest rate steady at 4.25–4.5%
- A 10% staff reduction is planned at the Fed for “efficiency”
➡️ The growing political interference is increasing market instability.
📉 U.S. Inflation – April 2025
The official inflation rate dropped to 2.3%, the lowest since February 2021.
However, consumer inflation expectations soared to 7.3%, the highest since 1981.
The University of Michigan Consumer Sentiment Index fell to 50.8—a historic low.
➡️ A clear gap between perception and data is emerging.
📊 Technical Analysis – Short-Term
Since May 12, an open GAP exists between $3,289 and $3,325 (36 $ range)
A V-shaped reversal formed from the low on May 15 ($3,120) to the Friday close ($3,204)
Symmetrical triangle formation suggests a convergence around $3,284 (possible by Tuesday)
➡️ Current trading range: $3,172 to $3,285 (113 $ range)
💡 Outlook for Monday, May 19
Time-Zone-Based Expectations:
Asia session (starting 1:00 AM London / 8:00 PM New York Sunday):
👉 Potential retest of $3,154
Europe session (8:00 AM London / 3:00 AM New York):
👉 Bullish outlook toward $3,234
U.S. session (2:30 PM London / 9:30 AM New York):
👉 Possible continuation of bullish move — open-ended potential
📌 Trade Setup – Monday 8:00 AM (London) / 3:00 AM (New York)
If price is below $3,154 → I stay flat and wait for clear signals
If price is above $3,172 → I consider a long position, unless conflicting news emerges
🎯 Weekly Target
My goal for the week is $3,348, provided the U.S. Dollar Index (DXY) holds near the 100-point level.
🧠 Conclusion
I am increasingly convinced that news-driven trading delivers the best results—if one can properly interpret the signals.
🔢 Fibonacci Levels
1h chart: low $3,131 → high $3,500 (April 22)
Levels: 0.315, 0.382, 0.5
1h chart: low $3,131 → high $3,435 (May 6)
Levels: 0.315, 0.382, 0.5
1h chart: low $3,131 → high $3,252 (May 16)
Levels: 0.315, 0.382, 0.5
-------------------------------------------------------------------------
This is just my personal market idea and not financial advice! 📢 Trading gold and other financial instruments carries risks – only invest what you can afford to lose. Always do your own analysis, use solid risk management, and trade responsibly.
Good luck and safe trading! 🚀📊
DOGE/USDT Potential UpsidesHey Traders, in today's trading session we are monitoring DOGE/USDT for a buying opportunity around 0.22000 zone, DOGE/USDT is trading in an ascending channel and currently is in a correction phase in which it is approaching the ascending channel support.
Trade safe, Joe.

GBPJPY Bulls wake Up! Clean swing buy opportunity ahead! Price after the recent swing high as indicated on the chart (yellow circles)
It has since retraced to to 61.8 retracement level and has rejected with one bullish candle and currently rejecting again. There is a high probability to see some buy pressure ahead of next weeks trading sessions to the up side to target of 195.78 and beyond.

GOLD → Consolidation amid a bullish trendFX:XAUUSD is trading in consolidation. As expected, the retest of the 3290 support level will end with a strengthening. The price is heading towards the resistance of the range.
The dollar is falling, which is supporting gold. The local trend is set by the fundamental background. The price of gold is strengthening and heading towards the resistance of the trading range, with the zone of interest being the liquidity located above 3346. The fundamental background is on the buyers' side, but since today is Friday, there is no strong news and the market is unlikely to seek a breakout from consolidation due to the lack of a driver. Thus, we can expect a correction from resistance before growth resumes, which may form next week.
Resistance levels: 3346, 3360
Support levels: 3308, 3290, 3282
Consolidation after the break of the local downtrend amid a falling dollar means that bulls are building up potential before a possible continuation of growth. But at the moment, an intraday trading strategy can be considered.
Best regards, R. Linda!

NZDUSD → A retest of resistance may end in a false breakout.FX:NZDUSD bounces off the upward support line and forms a distribution towards the liquidity zone located above 0.597...
Strong resistance lies ahead at 0.5969 - 0.5975 (liquidity pool). If the current movement continues (distribution), the market will exhaust all its potential and the situation may end in a false breakout. There is no trend as such in the market, the price is inside the flat, and thus bearish pressure may resist the upward price movement.
Resistance levels: 0.5969, 0.5974
Support levels: 0.5932, 0.5917
Against the backdrop of a falling dollar, the currency pair is likely to continue its growth and may test 0.5969 in the short term, but based on the nature of the movement, we can assume that a downward correction will follow.
Best regards, R. Linda!

GOLD → Consolidation (correction) ahead of newsFX:XAUUSD is testing resistance at 3346 and forming a correction, leaving liquidity above the level as the current target. The correction was influenced by the dollar. What can we expect next?
Gold is rising for the fourth day in a row and is approaching $3350, awaiting US PMI data. The dollar remains weak amid geopolitical risks, US-China disputes, and concerns about the US budget. The passage of Trump's tax bill could increase the deficit and pressure on the dollar. Weak PMI data could support gold by heightening expectations of a Fed rate cut
Technically, with the dollar falling, gold has every chance of continuing its rise. But now we are seeing a correction forming. I would say that the relevant areas of interest are 3288 and 0.5 Fibo
Resistance levels: 3346, 3360, 3409
Support levels: 3288, 3275, 3265
As part of the correction, gold may enter a consolidation phase, during which the price will gather liquidity relative to key areas of interest before continuing its growth. A retest and false breakout of 3288 - 3275 is possible before the growth continues.
Best regards, R. Linda!

XLMUSDT → Consolidation above 0.300 will provide an opportunityBINANCE:XLMUSDT.P is returning to the buying zone relative to strong resistance as part of a local uptrend. The market backdrop is favorable, but Bitcoin poses risks...
Bitcoin is updating its historical high and continuing its bullish trend, which is a favorable backdrop for altcoin growth. However, risks are posed by the fact that BTC may form a false breakout of resistance, which would trigger a correction across the entire market.
XLMUSDT is returning to the buying zone relative to strong resistance as part of a local uptrend.
If the bulls hold their ground above 0.3000, growth may continue in the short and medium term.
Resistance levels: 0.318, 0.324
Support levels: 0.300, 0.2975, 0.2799
The focus is on 0.3000, which is a fairly important and key (psychological) level. If the bulls manage to hold their ground above this point, the price will continue to rise, but it is necessary to monitor the behavior of the bitcoin.
Best regards, R. Linda!
