ETH/USDT 4H CHART REVIEW🔍 Overall market structure
• Ethereum is moving in a descending triangle/converging channel (yellow trend lines).
• The upper trend line acts as strong resistance (~$4,000-$4,150).
• The lower trend line (rising) provides key support around ~$3,730-$3,750.
⸻
📊 Key levels
Resistances:
• $3,875 – local resistance, where the price rebounded several times.
• $3,990 – another resistance resulting from the yellow trend line.
• $4,143 – main resistance in the breakout zone of the formation (potential target after breaking the downtrend).
Support:
• $3,808 – short-term support.
• $3,733 – important level within the formation (lower yellow trendline).
• $3,637 – strong support that should not be broken while maintaining bullish sentiment.
⸻
📈 Indicators
MACD:
• MACD and signal lines are close to each other - no clear momentum.
• Histogram decreases → possible short-term weakness or consolidation.
RSI:
• RSI indicator around 45–50 → neutral, with no clear advantage of buyers or sellers.
• No divergence, but potential for a rebound if RSI drops to ~40 and rebounds.
Fibonacci Retracement

GOLD → Fundamental background boosts interest FX:XAUUSD is recovering after a correction, trading in the range of 4060-4120 amid geopolitical tensions and risks of an escalating trade war.
Key supporting factors: New threats from the US against China, which is responding with additional measures. Trump imposed sanctions against Russian oil companies, accusing Moscow of lack of progress on Ukraine. US inflation data (CPI) on Friday may cause volatility, although the Fed's rate cut next week is likely already priced in.
The meeting between Trump and Xi Jinping next week remains uncertain.
Gold remains a safe haven, but near-term dynamics depend on the balance between dollar strength and geopolitical risks.
Resistance levels: 4116, 4163, 4200
Support levels: 4082, 4060, 4002
A retest of support at 4082-4060, as well as a breakout of resistance at 4116, could trigger a bullish reaction—a rise to the resistance level or imbalance zones. Against the backdrop of the escalating trade war, gold is becoming attractive again.
Best regards, R. Linda!

EURCAD → Retest of liquidity pool before growth FX:EURCAD is forming a correction to the key liquidity zone amid a global and fairly strong bullish trend. Will the bulls enter the game in the 1.6173 zone?
The euro is forming a correction to the strong support zone of 1.16, which is provoking a decline in the currency pair. The key area that the currency pair is striving for is 1.6173. The trend is bullish. A reaction from the bulls is possible...
A false breakout of resistance is forming a correction. However, the price is still within the trading range of 1.64 - 1.6173. The price is heading towards support for a retest, and the indicated zone is likely to stop the correction...
Resistance levels: 1.633, 1.64
Support levels: 1.6173, 1.603
A liquidity pool below 1.62 - 1.617 could change the game in favor of buyers. Remember, the trend is bullish, and this will be a clear advantage for players. A false breakdown of support and the absence of a downward momentum could trigger growth.
Best regards, R. Linda!

GOLD → Correction after aggressive growthFX:XAUUSD is in a correction phase after a month and a half of aggressive growth. The price is forming a trading range and continues to storm support...
The record growth was overheated, and traders are closing long positions. A gradual change in the fundamental background and market sentiment is also provoking an outflow of funds. However, US-China negotiations, the ongoing US shutdown, and the tense geopolitical situation, including the cancellation of Trump's meeting with Putin, create additional risks in the economy, which may support the metal.
The correction in gold looks like a healthy pause. The $4,000 level remains key support. A recovery above $4100 indicates continued buyer interest, but further dynamics depend on news about trade negotiations.
Resistance levels: 4082, 4107, 4163
Support levels: 4059, 4000
A breakdown of the trading range support could trigger further sell-offs. Focus on 4000K, aggressive reaction possible. At the moment, the market is falling as aggressively as it rose. We need to wait for the price to slow down in order to make reasonable technical decisions.
Best regards, R. Linda!

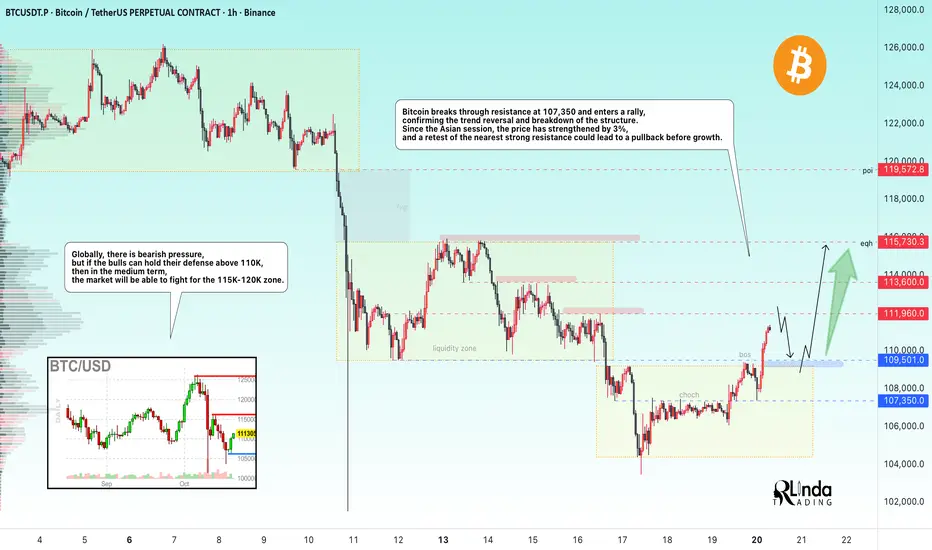
BITCOIN → Trend reversal. Is there a chance for growth?BINANCE:BTCUSDT.P is breaking the trend and local market structure, forming a rally. Giving hope to buyers, we see a strong reaction from the Asian session. Are the bulls returning?
The fundamental background is unstable; if Trump continues to escalate the trade war, the cryptocurrency market may close within the range. However, technically, we have positive signs of a bull market. BTC is breaking through the resistance level of 107,350 and entering a rally, which only confirms the change in trend and the breakdown of the structure. Since the Asian session, the price has strengthened by 3%, and a retest of the nearest strong resistance at 112K-113.6K could lead to a pullback before growth.
Globally, there is bearish pressure, but if the bulls can hold their defense above 110K, then in the medium term, the market will be able to fight for the 115K-120K zone.
Resistance levels: 111960, 113600, 115730
Support levels: 109700, 109200
In the short term, I expect a false breakout of the specified resistance and a correction of 1/2 of the local impulse, i.e., a retest of the 110K - 109200 support zone, which, in turn, could lead to another bullish run to 115K - 120K.
Best regards, R. Linda!
ETHEREUM → Manipulation before a possible fall BINANCE:ETHUSDT , as part of manipulation and updating the local maximum to 4108, confirms strong resistance, forms a false breakout, and falls, testing key support.
Bitcoin, as part of yesterday's rally in the US trading session, is trying to turn the tide, but after encountering resistance at 113600, it forms a false breakout and sells off all the growth, which is generally a signal of readiness for a decline. This could have a negative impact on the entire market...
Ethereum is testing support - trigger 3822.5. After a sharp drop, there is no rebound, which indicates buyer weakness. Consolidation is forming near support, which only reinforces the pre-breakdown potential.
Resistance levels: 3963, 4030, 4090
Support levels: 3822, 3660, 3366
The classic implementation of the “liquidity hunt” scenario led to a rally to resistance, and a false breakout at 4090 led to heavy selling. As part of the current consolidation, the market is reducing volatility ahead of support, which only increases the chances of a breakdown. A close below 3822 could trigger a further decline. Key liquidity zones are 3658 - 3366.
Best regards, R. Linda!

BTC/USDT Short-Term 4H Review Chart🧩 Market Structure
After a strong decline, the price has rebounded, creating a local uptrend (marked with the orange trend line).
The price has currently broken through the uptrend from below, which is the first sign of bullish weakening.
The current candle is testing this line from below—a classic trendline retracement (potential pullback).
📉 Support and Resistance Levels
From the chart:
Resistance (green lines):
113.868 USDT — key high.
111.240 USDT — strong resistance (previous local high).
109.133 USDT — currently being tested from below (confluence with the trendline).
Support (red lines):
107.524 USDT — first support.
105.253 USDT — lower support, a boundary for maintaining the higher low structure.
103,582 USDT — key support, below which the upward structure will be negated.
🔍 Volume
Increasing volume is visible on the red candles — selling dominated the trend breakout.
The last green candle has a large lower wick and slightly higher volume — a signal of a possible defensive reaction from the bulls, but without confirmation of continuation.
📊 Stochastic RSI (oscillator)
Located in the oversold zone (around 20).
The %K line is starting to curve slightly upward — it could signal a short-term rebound, but until there's a crossover and confirmation, this is only an early signal.
📈 Scenarios
✅ Bullish:
If BTC rebounds and closes the candle above 109,100 USDT, it will be a false breakout of the trend and a possible upward move towards 111,200–113,800 USDT.
Support to be maintained: 107,500 USDT.
❌ Bearish:
If the price remains below the trendline and 109,000 USDT, and then breaks above 107,500 USDT, the path opens to:
105,200 USDT, and then
103,500 USDT (strong support and potential buy zone).
⚙️ Summary
Short-term trend: neutral → slightly downward (after the trendline breakout).
Key level to watch: 109,100 USDT (retest trendline).
Potential support: 107,500 → 105,200 → 103,500.
Momentum (Stoch RSI): A bullish rebound is possible, but confirmation is lacking.

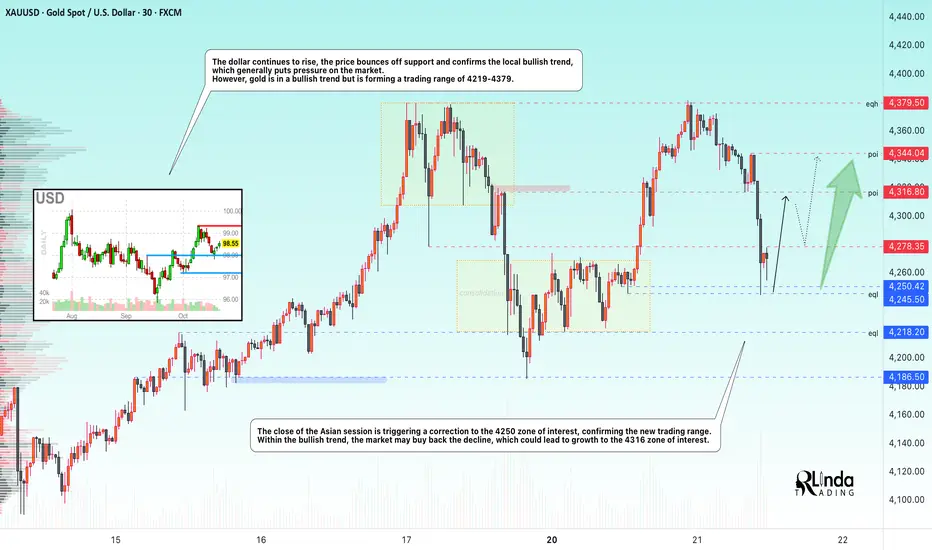
GOLD → The correction forms a trading range. Growth?FX:XAUUSD is adjusting to $4250 after retesting the all-time high of 4380. Short-term pressure is linked to hopes for an easing of the trade war between the US and China, but the bullish trend remains intact.
Key factors: Bentsen's meeting with the Chinese Vice Premier this week has revived optimism for a deal. The reduction in trade risks is temporarily supporting the USD. Hassett's statements about the imminent resumption of government work have reinforced risk-on sentiment.
Support for gold: The threat of tariffs rising to 155% from November 1 reminds us of the risks. Two rate cuts before the end of the year remain in focus. Friday's inflation data release and US corporate earnings reports are keeping demand for hedging alive.
Accordingly, the correction in gold is a temporary pause. The uptrend will remain unchanged as long as macro uncertainty persists.
Support levels: 4250, 4218
Resistance levels: 4278, 4316
Within the bullish trend, the price is forming a trading range. A retest of support could end in a recovery, with the fundamental background favoring the bulls. A retest of 4245 could trigger growth, as could a breakout of 4278 (closing above resistance).
Best regards, R. Linda!
EURUSD 1H Analysis: Bearish Pressure Builds📊 EURUSD – 1 Hour Analysis
Hello Guys,
Here’s my EURUSD analysis for you.
On the 1-hour chart, bears seem to have taken control, as selling pressure is clearly dominating the picture.
If EURUSD falls below 1.16446 and closes a candle there, my first target will be 1.16106.
🙏 Every like is my biggest motivation to keep sharing these analyses. Thanks to everyone supporting me!

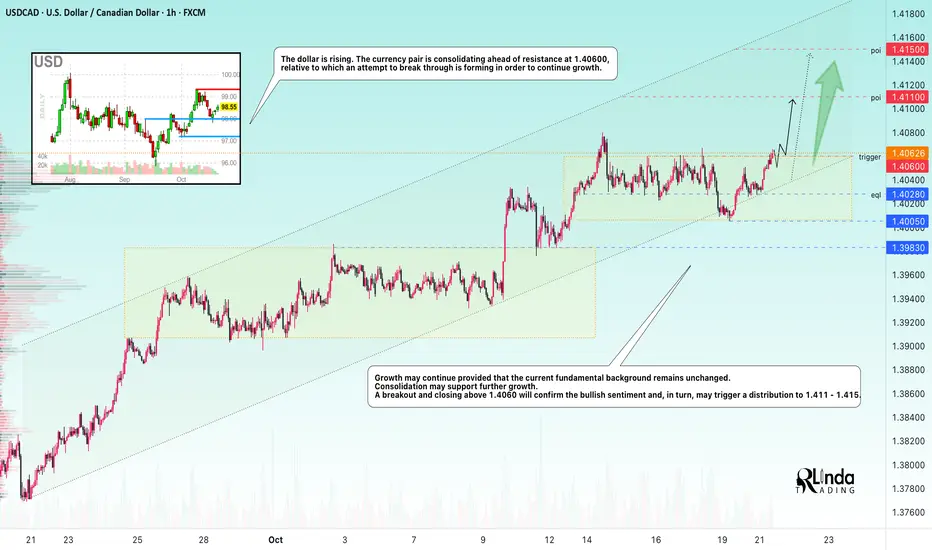
USDCAD → Attempt to break through resistance to continue growth FX:USDCAD is attempting to break through consolidation resistance within an uptrend. Growth in the dollar index may support the current trend.
The dollar is rising. The currency pair is consolidating ahead of resistance at 1.40600, against which it is attempting to break through in order to continue growing.
The growth may continue if the current fundamental background remains unchanged. Consolidation may support further growth. A breakout and closing above 1.4060 will confirm the bullish sentiment and, in turn, may trigger a distribution to 1.411 - 1.415.
Resistance levels: 1.4060
Support levels: 1.4028, 1.4005
The trend is bullish, with virtually no pullback after the growth, only consolidation, which is technically a positive sign. A breakout of the specified consolidation resistance could trigger distribution to areas of interest.
Best regards, R. Linda!
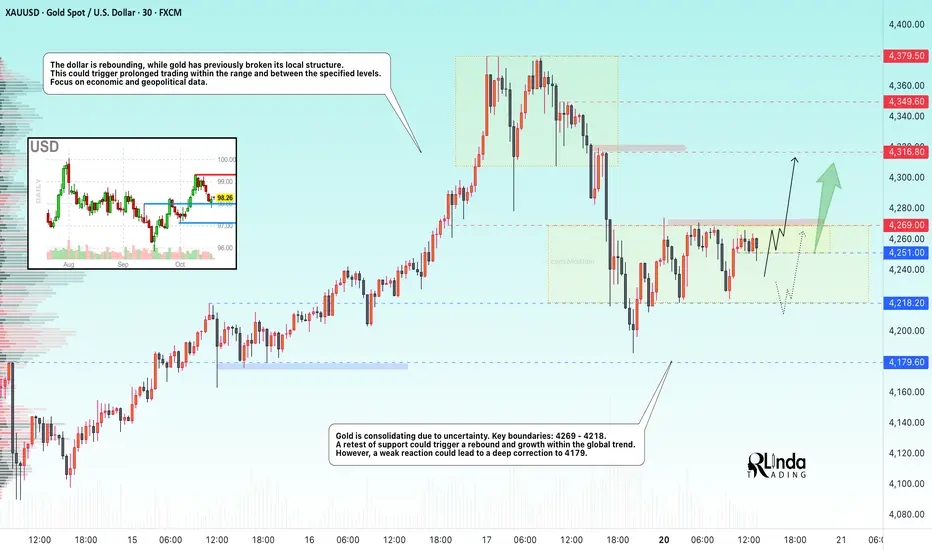
GOLD → Consolidation. 4269 - trigger. Chances for growth?Gold is consolidating due to uncertainty. On Friday, the market broke its local structure, which slightly changed sentiment. Focus on current consolidation.
Key drivers of the week: Trump's threat to impose 100% tariffs on Chinese imports and China's response supported demand for safe havens. Problems with regional banks (Zions, Western Alliance) and the fall in Treasury bond yields below 4% increased the inflow into gold. Powell maintained a neutral tone, but markets are expecting two rate cuts in 2024.
All eyes are on inflation data, US-China negotiations, developments between Russia, the US, and China; any de-escalation of the situation could trigger a correction.
Technically, the upward trend in gold remains relevant. Corrections will be bought up as long as uncertainty surrounding trade policy, the banking sector, and the Fed's monetary policy persists.
Resistance levels: 4269, 4316
Support levels: 4251, 4218
At the moment, a pre-breakout base is forming around 4269. If the structure remains intact and the price continues to attack resistance, the chances of a breakout and growth will be high. Otherwise, a close below 4251 could trigger a retest of 4218.
Best regards, R. Linda!
BNB/USDT 1D chart review📊 1️⃣ General context
• BNB price is approximately USDT 1,100, after correction approximately -0.85%.
• It is clear that the market is in a corrective phase after a strong increase - recent highs reached ~1,340 USDT.
• Currently, the rate is balancing between support ~1069 USDT and resistance ~1149 USDT.
⸻
🟢 2️⃣ Supports and resistances (key levels)
• Closest support:
🔸 1069 USDT (short term, red line)
🔸 985 USDT – stronger support (previously tested, below EMA 50)
🔸 884 USDT – strong long-term support (potential correction low)
• Resistances:
🔹 1149 USDT – first level to break
🔹 1226 USDT – important daily resistance
🔹 1344 USDT – main peak, border of the previous impulse
⸻
📈 3️⃣ Moving Averages (SMA/EMA 50/200)
• We see the yellow EMA 50 line and the green SMA 200 line crossed (EMA Cross 50/200).
👉 This is a golden cross - a medium-term growth signal.
• Currently, however, the price has fallen below EMA 50, which means supply pressure in the short term.
• As long as it stays above the 200 SMA (~1060-1070), the macro trend remains bullish.
⸻
📉 4️⃣ MACD
• The histogram is red and decreasing - this confirms that the downward momentum continues but may be weakening.
• The MACD line (blue) is approaching the signal line (orange), which may indicate an impending bounce.
⸻
🪫 5️⃣ RSI
• RSI is around 40-45, which is close to the oversold zone.
• This suggests that sellers may be losing strength and a technical rebound may occur soon.

$BTC.D Death Cross Has Occurred! The Signal on ₿itcoin Dominance We've Been Waiting All Cycle For 🔥
20 / 50 WMA Death Cross has officially occurred on CRYPTOCAP:BTC.D
So close to Alt Season I can taste it 😋

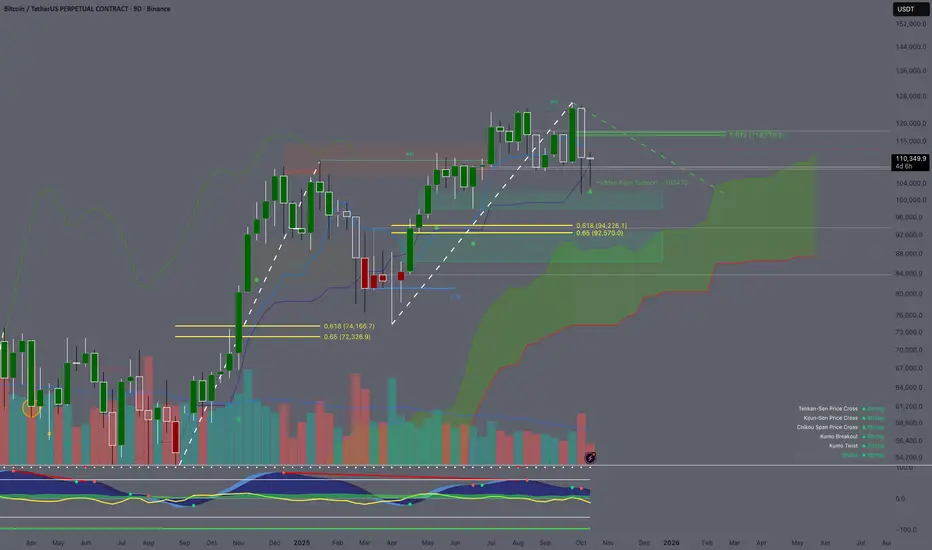
9D Timeframe Analysis using Ichimoku Cloud / Fib/ ICT
Price Action: The candle is pushing north and attempting to turn into a green candle. If the candle successfully turns green and creates a big long wick. The candle can be the support candle for this bullish. The candle won't be closed until this Friday night. Since the candle already discovered the south side and created long wicks. If the candle turns green we will experience the new discovery price on the north side.
Ichimoku Cloud: The price is currently trading above the Kijun-Sen ($109,454.3). If the price continues trading above this level. The trend is validated by the Kijiun-Sen. The Kijun-Sen sometimes plays a role such as a healthy pull back point where you can enter for a long position or a confirmation of a trend. The prices usually pulled back to this line after all time high. Price usually consolidated between (above/below) the lines before the pump in a bull market. The Kijin-Sen is also pushing upward which is a bullish sign but the Tenkan-Sen is flattened out. When the Tenkan-Sen is flat out, the price tends to trade sideways or we can say that the momentum has reduced. Cloud A is still shifting upward while Cloud B has flatted. Cloud A shifting upward means the momentum is still there but the current momentum which is the Tenkan-sen is flat.
Fibonacci: I drawed a fibonacci from $126208.5 to $101.516.5. The all time high point to the 20 billions liquidated event in crypto space. 1 candle made all time high and 1 candle flash crashed to the fair value gap. With the fibonacci, the 0.618 and 0.65 are showing $116,776.2 and $117,566.3. If the low range fib is the bottom then the price has to retrace back to 0.618 in others to continue the massive sell off. So this is playing a key level on the bears for short.
Fair Value Gaps (FVGs): There is a fair value gap when I draw a fip from the previous low in April to the all time high end of September. There is a fair value gap at the 0.65 fib level. Which shows that if the price is retraced back to that level. We are sill in the up trend in favor of the bull
Cipher B: The vwap is trading below money flow and momentum. The Money flow has flatted out while momentum is going down. This is not a good sign because the vwap is pointing south and trading below moneyflow which could lead to the consolidation. The consolidation is not always bad but shows that the trend is cooling down.
Key Levels: 0.618 from bull and bear. If the price is dropped to the fair value gap which is $94.226.1. The actual fair value gap at 0.65 not 0.618 but those levels go together. We will call 126208.5 the top. But if the price is defense above the Kinjun-Sen and does not retrace at the 0.618 from the high to the wick then we are not at the top yet.
Outlook: The change in Tenkan-Sen and Kijun-Sen. The shift of direction in those will be first noticed before anything other factors. Also price trading above/below/between those levels as well.
$TOTAL Crypto Market Cap Fights Back w/ Weekly CloseCrypto CRYPTOCAP:TOTAL Market Cap looking similar to CRYPTOCAP:BTC
Thankfully did not close outside of the Danger Zone.
It's absolutely imperative that Bulls reclaim the 20WMA this week and close above the .236 Fib
Losing the 20WMA has signaled more downside / sideways chop historically.
Hopefully this is just a fake-out, otherwise the 50% Gann will be retested alongside the 50WMA.

$BTC Bulls Fight Back With Weekly CloseNot sure how I continue to amaze myself, but I do 🤓
Notice how those MMs respected my DANGER ZONE POI to the dollar?
Thankfully CRYPTOCAP:BTC did not close the Week outside the DZ.
The battle between Bulls and Bears is FIERCE 🔥
Bulls cannot afford another blue weekly close.
If so, the 50WMA retest ~102k will be inevitable.
Bulls need to reclaim and close this upcoming week above the 20WMA and .236 Fib
A close ~$116k would be super bullish.
That should be enough ammo to spark the long awaited parabola that UpTober has historically brought us.

BTC/USD 4H chart reviewBitcoin is currently trading around $109,000, a rebound after falling. An attempt to break the short-term downtrend is visible (yellow SMA line 1).
The previous lows were around USD 104,500 - 105,000, and the current candle is trying to break the local resistance around USD 109,000 - 110,000.
⸻
📊 2. Moving Averages (SMA / EMA)
You have several averages on the chart:
• The yellow line (SMA #1) – the short-term average, currently slightly sloping downwards, but the price is just breaking it from below – is the first sign of a change in momentum.
• Red line (EMA Cross 50/200) – it looks like the 50 EMA is below the 200 EMA, confirming the downtrend in the broader picture.
• Blue and green zones (EMA/SMA of higher intervals) – show strong resistance zones:
• $112,592
• $115,674
→ These are targets for a potential upside rally if the 109k breakout holds.
⸻
💹 3. MACD
• The MACD line crossed the signal line from below → it is a buy signal (bullish crossover).
• The histogram increases above zero, which confirms the upward momentum.
➡️ MACD confirms that the upward correction continues, but we do not have a full upward trend yet.
⸻
📈 4. RSI
• RSI is around 55-60, i.e. neutral and upward.
• It was previously in the oversold zone (around 30), so the current rebound is a healthy reaction.
➡️ No overbought yet, so there is room for further upward movement.
⸻
🧱 5. Key technical levels.
Level
Support 1
$106,550
local support after rebound
Support 2
$104,550
strong bottom from the previous move
Support 3
$101,700
the last bastion of buyers
Resistance 1
$109,000-$110,000
currently tested level
Resistance 2
$112,600
another growth target
Resistance 3
$115,700
EMA200 key barrier – trend change if it breaks

GOLD - BEARS PREPARING FOR THE NEXT MOVEGold has reached a strong resistance level around 4,380 and is currently showing signs of a pullback. After nine consecutive weeks of gains without a single red candle—a rare occurrence in gold’s history—market participants should anticipate a potential correction phase.
The 4,305–4,337 zone will be a key area to watch for a possible retest before the next move lower. If price fails to break above that zone, the downside targets remain at 4,110 and 4,040.
Overall bias stays bearish as long as gold trades below 4,380.

$3,500 ETH Incoming! I AM SHORT!#ETH just rejected from a 4H supply zone. If the bearish PA continues, we will expect the local lows to be taken out and the $3,500 psychological number to be tested.
How long will it take?
Just sit back and enjoy the ride.
Calculate Your Risk/Reward so you don't lose more than 1% of your account per trade.
Every day the charts provide new information. You have to adjust or get REKT.
Love it or hate it, hit that thumbs up and share your thoughts below!
This is not financial advice. This is for educational purposes only.

BTCUSD 1D Chart • Trend: clear decline in the descending channel (yellow lines).
• EMA 50/200: during a bearish cross (death cross) - medium-term bearish signal.
• SMA 50 / 100 / 200: price below all key averages - a classic signal of market weakness.
⸻
📉 1. Trend indicators
🔹 EMA Cross 50/200 (blue)
• The price has fallen below EMA 200, which means that the medium-term trend is currently negative.
• In addition, the EMA 50 breaks the EMA 200 from above - a sell signal.
🔹 Descending Channel (Yellow)
• The price is close to the lower band of the channel, which may result in a short-term technical rebound, but the main trend remains down.
• Upper channel line (resistance): approximately USD 114,000-115,000
• Bottom Line (Support): ~$101,000
📊 3. Momentum indicators
🔸RSI
• RSI ≈ 37 → close to oversold zone, but not extreme yet.
• Signal: Possible short bounce if it stays above the 30 level.
🔸 MACD
• The MACD line is below the signal line and the negative histogram is growing → the downward momentum continues.
• No signs of reversal yet.
⸻
🔥 4. What does this mean in practice
🔻 Short-term (1-7 days):
• Downward trend with a possible technical rebound in the area of USD 104,000-101,000.
• RSI close to oversold → possible pullback to USD 109,000–110,000.
⚖️ Medium term (2-4 weeks):
• Until BTC returns above EMA 200 (approx. 115,000), the market remains in a correction/distribution phase.
• If the price breaks 101,000 down, a possible decline to 96,900 or even USD 92,000 (previous macro support).
⸻
📈 5. Scenarios
✅ Bullish (less likely now)
• Maintaining above $104,000
• Breakout 109,000 → USD 112,000 → test 115,000
• Breakout of EMA 200 → trend reversal signal
❌ Bearish (more likely)
• 104,000 raise → $101,000 test
• If the support breaks, a decline to 96,900-97,000 is possible within a few days.

GOLD → Positive backdrop. Consolidation before growth?FX:XAUUSD is consolidating after a shake-down in the Asian and Pacific sessions. The price hit a new low of 4278, but bulls are aggressively buying up two liquidations (manipulation?). The metal is preparing for its ninth consecutive week in positive territory, with an 8% increase over the week.
Key drivers: Fed members confirmed their readiness to cut rates in October and pointed to risks for the labor market. The situation with the trade war between China and the US is still tense.
However, negotiations between the presidents of three countries on the conflict in Eastern Europe have raised hopes for de-escalation, which has temporarily reduced demand for defensive assets. The shutdown continues, which supports the price of gold.
The correction in gold is a temporary pause, and any decline will be used for purchases.
Technically, the focus is on the global trading range of 4280-4380, with consolidation within 4350-4330. A breakout of the accumulation zone could trigger a move in the direction of the breakout
Resistance levels: 4350, 4380
Support levels: 4320, 4300, 4280
Technically, before rising, the price may test the liquidity zone located below the specified support zones. However, it is also worth watching the 4350 trigger—a breakout of resistance and a close above this level could trigger continued growth within the current bullish trend.
Best regards, R. Linda!

GBPCAD → The hunt for liquidity ahead of growthFX:GBPCAD , after breaking through the resistance of the ascending triangle consolidation pattern and updating its high to 1.8915, is forming a correction to retest the zone of interest before continuing its growth
The British pound is forming an uptrend, which supports the price of the currency pair.
The currency pair is forming a breakout of resistance. After updating the maximum, the price is rolling back to retest the previously broken consolidation border. Liquidity capture relative to 1.8825 - 1.8807 could lead to a shift in the imbalance towards buyers and provoke continued growth.
Resistance levels: 1.8915
Support levels: 1.8825, 1.8808
If, during the retest of support, the bulls keep the price above this zone, then the chances of a reversal and growth will be high. 1.8915 - 1.900 can be considered as a potential target.
Best regards, R. Linda!

GOLD → The aggressive trend continues. Focus on 4240FX:XAUUSD continues to break records, testing the $4,240 level amid a weakening dollar and sustained demand for safe-haven assets. The risks of a correction are growing as economic news releases approach.
Key supporting factors: Statements by US officials about China's “seizure of supply chains” and retaliatory measures are keeping markets on edge. US shutdown: The government shutdown is costing the economy $15 billion a week, increasing uncertainty. The probability of a rate cut in October and December is ~95%, which is putting pressure on the dollar. However, statements by Fed officials may adjust market expectations.
The bullish trend for gold remains unchanged. Any corrections will be seen as a buying opportunity. Key benchmarks are the development of the trade conflict and negotiations on the resumption of the US government.
Support levels: 4212, 4203
Resistance levels: 4234, 4235, 4250
Within the uptrend, it is worth waiting for a correction to support in order to open positions more profitably. There are no reasons for a trend reversal, and the fundamental background is bullish. We expect a retest of support before growth. However, a breakout of the 4234-4239 zone could trigger further growth!
Best regards, R. Linda!
