XRP – Going Long Against the CrowdJust discovered that 96% of traders are short on XRP, which instantly caught my attention. When sentiment is this lopsided, I start thinking like a contrarian. Price is sitting in a key zone, and I’m using my Fibonacci Extension Tool to project upside targets.
Fibonnacci

Ep. 4 - BTC Prediction By Channels, Secret Fib & Unique Gann FanBitcoin Price Prediction Using Channels, Fibonacci & Gann Fan | Signal & Structure Episode 4
In this concise yet powerful episode, we combine three advanced technical analysis tools to identify high-probability support zones for Bitcoin's current correction. This multi-confluence approach demonstrates how stacked logarithmic channels, Fibonacci retracements, and Gann fans work together to pinpoint critical price levels.
Techniques Demonstrated:
1. Channel Validation Theory
- Proves that any trend line can become a valid channel
- Shows how to convert the COVID crash to bear market bottom trendline into a working channel
- Demonstrates perfect alignment with historical tops
2. Stacked Channel Refinement
- Creates a smaller channel where the top touches the midline of the larger channel
- This subdivides the original channel into quarters
- Provides additional confluence levels for support/resistance
3. Fibonacci Retracement Application
- Maps the key retracement levels from recent bottom to top
- Focuses on the "Golden Pocket" (0.618-0.786)
- Identifies 0.702 as the Optimal Trade Entry (OTE) level
4. Gann Fan on Logarithmic Scale (Unique Technique)
- Anchors 45-degree angle from the peak
- Aligns Gann Fan 1x1 line with the 45-degree angle
- Uses Gann lines to track momentum decay:
- 1/8 → 1/4 → 1/3 (bearish progression)
- 1/1 as recovery signal
- 8/1 as ultimate resistance breakout
Key Confluence Zone Identified:
The analysis reveals a critical support box between:
- 0.618 - 0.786 Fibonacci levels
- Validated by 1/3 Gann Fan line
- Supported by stacked channel structure
This triple confluence creates a high-probability reversal zone where multiple technical factors align.
Trading Insights:
Current Market Position:
- Price following bearish momentum path along Gann lines
- Moving from 1/8 toward 1/3 line
- Range-bound action expected until 1/1 line reclaimed
Recovery Signals to Watch:
- Breaking above 1/1 Gann line (45-degree angle) = trend recovery
- Ultimate bullish confirmation: Breaking 8/1 line
- Support zone provides optimal risk/reward entry area
Technical Setup:
- Timeframe: Weekly chart
- Scale: Logarithmic (essential for both channels and Gann)
- Tools: TradingView's Fib Retracement, Gann Fan, Parallel Channel
This episode demonstrates how combining multiple technical tools on logarithmic scale can identify precise support/resistance zones. The convergence of three independent methods at the same price area significantly increases the probability of a meaningful reaction.
The unique application of Gann Fan on log scale, aligned with the 45-degree angle, provides a momentum roadmap that most traders miss. This technique is particularly powerful for tracking trend strength degradation and identifying potential reversal points.
Feel free to teach out for partnership opportunities. I'm open to provide TA and educational services.

Its Time to Diversify YO Bonds - Wu Tang Financial $TLT $IEFyep, the National Debt is about to get reset.. do your reserarch and buy TLT and IEF.

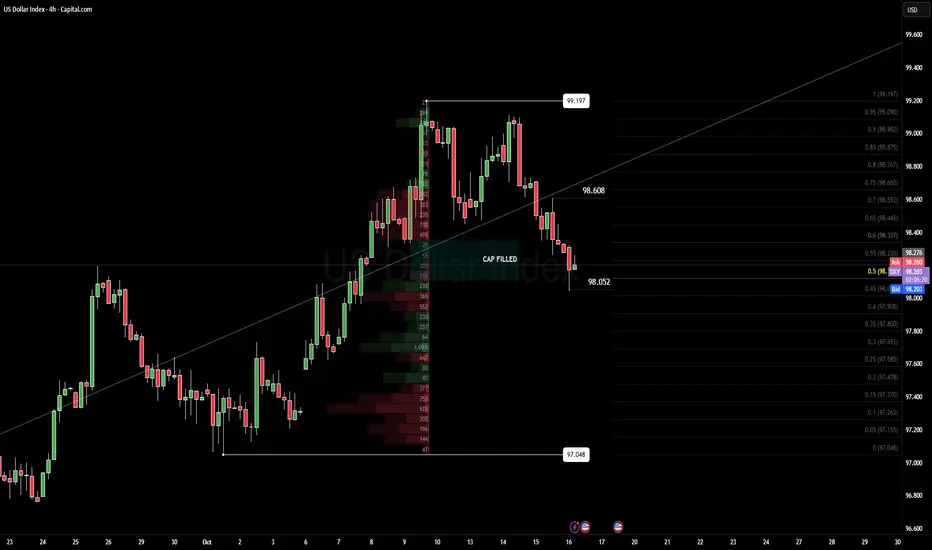
DXY — 4H Fibonacci Discount ZoneDXY — 4H Fibonacci Discount Zone: bounce or breakdown?
Context (4H | Pre-London | 16 Oct)
Dollar Index is testing a 50% Fibonacci discount zone after an overnight -2 deviation.
Volume remains light, but buyers stepped in near the 98.2 region, defending short-term structure.
Big picture still leans bearish
Technical Map
• Structure: Consolidation within broader bearish context — 4H recovery attempts forming.
• Key Level: 98.2 acting as short-term decision point; deviation off 50% Fib zone.
• Momentum: −2 deviation within 4H range — early shift toward mean reversion.
• Volume: Heavy order flow support beneath 98.0; thin liquidity overhead until 98.6.
Structure overall remains bearish, but short-term momentum favors a corrective bid from the Fibonacci discount zone.
Fundamental Pulse
The Fed minutes gave us a small dip in yields, but the Dollar didn’t flinch — it’s still holding firm.
Sticky inflation keeps the Fed cautious, reinforcing that “higher-for-longer” tone.
Now all eyes turn to today’s CPI at 15:30 EET — the real test for rate expectations.
For now, rates steady, risk tone calm, traders waiting for direction.
Plan (If/Then)
If DXY pushes above 98.6, expect momentum toward the 99.0 zone.
Break below 98.05 reopens path toward 97.6–97.4 support band.
R:R potential ≈ 1 : 3 — solid setup if volatility expands post-CPI.
Stay patient and scale small before the CPI lands.
Mindset Pulse
Observation beats anticipation.
Let price confirm your story, not the other way around.
Stay aligned with structure; one mouse click can cost a narrative.
Short HYPEThis setup shorts the failure at the channel midline and 41–42 supply, aiming for a quick move back into the lower half of the daily channel with first take‑profit near 37.8 where prior demand and fib confluence sit.
Execution is simple: sell into a fresh rejection below 41–42, I use a hard stop around 43.1 just above the recent swing and channel cap, and let the trade work toward 37.8 with the option to trail if momentum accelerates lower. If price closes back above 43.1, the idea is invalid and the short is closed without debate

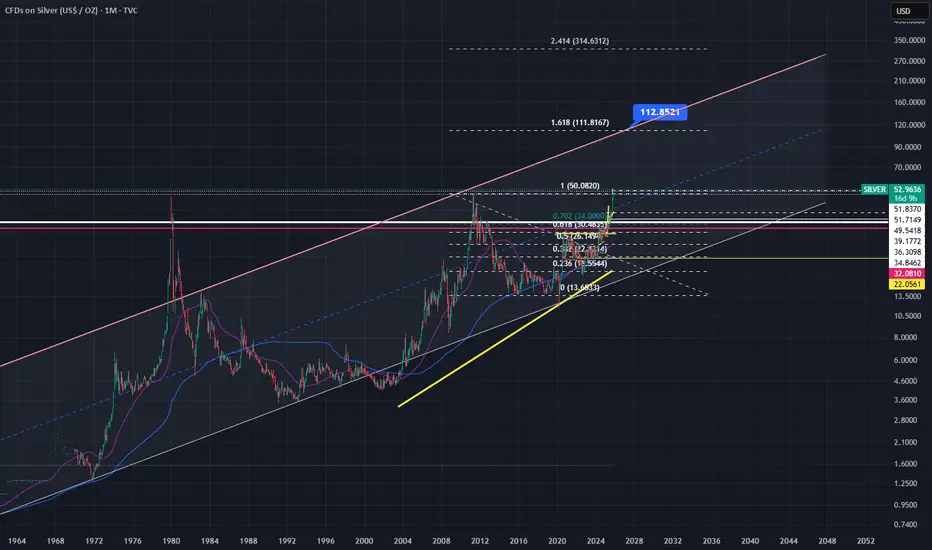
Silver to the 1.618 Fib Extension? $111.00Could silver be headed to the 1.618 fib extension which also coincides with upper channel trend line?
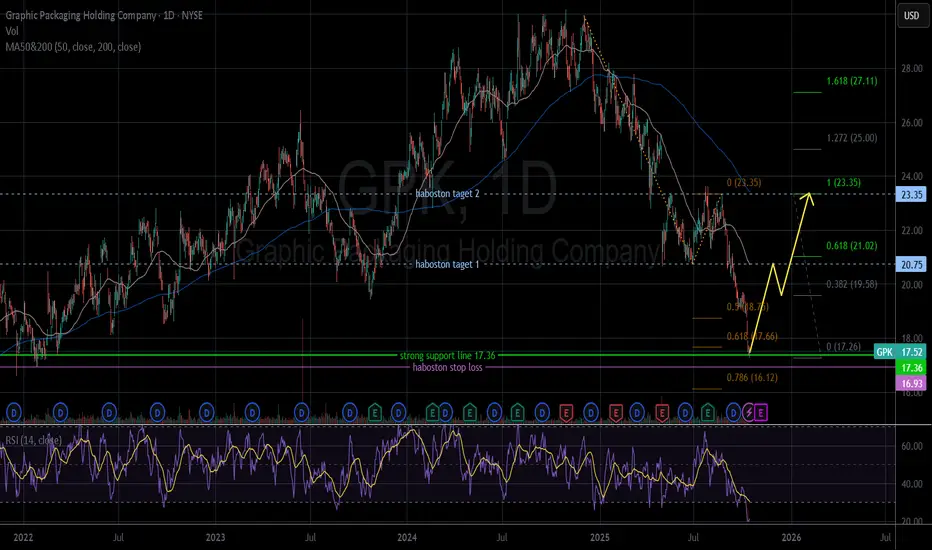
GPK oversold on both daily and weekly chartsGPK oversold on both daily and weekly charts.
It seems to have found a strong support line at $17.36 (2021 price).
It is too early to say if GPK is ready to bounce up. However, with today's large buy volume, we can hope that the current price is a bottom or near the bottom.
The price closed 10.14.2025: $17.52.
Price target: $20.75/ $23.35.
Stop loss: $16.93.
IMO, amateur trader.
This is not investment advice. Just sharing my idea based on price chart.
GameStop and Fibonacci: It's About TimeThis is my first attempt at publishing a video on TradingView, so hopefully it works.
I wanted to put together something educational about fib channels and why I like to use them. They're not a silver bullet, but they do tell you a lot about where to expect support and resistance because the chart has a very good memory, and you can see this play out on pretty much any instrument, including cryptocurrencies.
I follow NYSE:GME closer than any other ticker, so this video is about my philosophy on the fib channels that I have been using on the GME chart and talking about on the Echo Chamber Podcast. Hopefully this adds a little more context to that discussion, how the flat price levels are not always the only thing that matters, but taking time-based trends into account can make a big difference in your analysis and understanding of price movement.
Happy to hear people's thoughts on my crayons 🖍️ which color should I eat next?
Since this is a bit of a longer video, here's an AI summary of the content with timestamps:
Introduction 00:00-01:05
I introduce the topic of explaining my TradingView chart, which has many colorful lines. I clarify that I didn't manually draw all the lines, but used Fibonacci channels that only require selecting 3 points.
Explaining Current Chart 01:05-04:33
I show my current GameStop chart, explaining various trend lines and Fibonacci channels. I demonstrate how to adjust the Fibonacci channel points to analyze different price movements.
Fresh Chart Walkthrough 04:33-11:57
Moving to a clean chart, I explain global chart items, including trend lines from major tops and bottoms. I discuss dividend-adjusted vs non-adjusted charts and explain the "Gandalf line" of support.
Fibonacci Channels Explanation 11:57-24:54
I provide a detailed explanation of how Fibonacci channels work, demonstrating how to draw them and interpret the resulting lines. I show how these channels can describe price action across long time periods.
Additional Examples 24:54-33:44
I show more examples of Fibonacci channels applied to GameStop's entire price history. I discuss how these channels can provide insight into potential future price movements and support/resistance levels.
Conclusion 33:44-34:40
I summarize my thoughts on GameStop's current price action in relation to the Fibonacci channels and support levels identified.
Some Quotes
"I find them mathematically interesting." 11:54 - Referring to trend-based Fibonacci tools.
"Math is your friend here. But you don't have to do the math, you just can use tools that will help you." 17:19
"Price is fractal in nature in that patterns are repeating and Fibonacci is everywhere." 17:19
"Things like history repeats itself. It's just a question of when, not if." 24:30
"The point I want to drive home here is that when we start to get a little bit more granular here, and this is why I have lots of crayons on my chart." 28:34
Key Tips/Concepts
Fibonacci channels can be powerful tools for technical analysis, providing insight into potential support and resistance levels.
These channels can sometimes describe price action across very long time periods, even when drawn based on recent price movements with thoughtfully selected endpoints.
The importance of considering price, time, and volume in technical analysis, as demonstrated by the "Gandalf line".
The value of using multiple timeframes and chart types (dividend-adjusted vs non-adjusted, trading hours only vs extended hours included) to gain a more complete picture of a stock's price history. (Editorial note: something I didn't cover in the video, but the difference between log scale and linear scale sometimes will make for an interesting story on trendlines and fib channels too. I prefer to keep my chart in log scale, but will toggle between log and linear occasionally to see if there's something interesting there in the lines already drawn.)
The concept of fractal nature in price movements and how patterns tend to repeat over time.

Platinum Futures Update Platinum Futures Update
This video is a quick update after hitting the 1-1 extension given in Julys video .
I look at what we can expect looking forward using higher time frames .
Tools used TR Pocket/ fibs

$300 Solana Inevitable!Nice rejection on Solana. Now lets see if we will get the move to the downside for a nice long trade to target $300.
Calculate Your Risk/Reward so you don't lose more than 1% of your account per trade.
Every day the charts provide new information. You have to adjust or get REKT.
Love it or hate it, hit that thumbs up and share your thoughts below!
This is not financial advice. This is for educational purposes only.

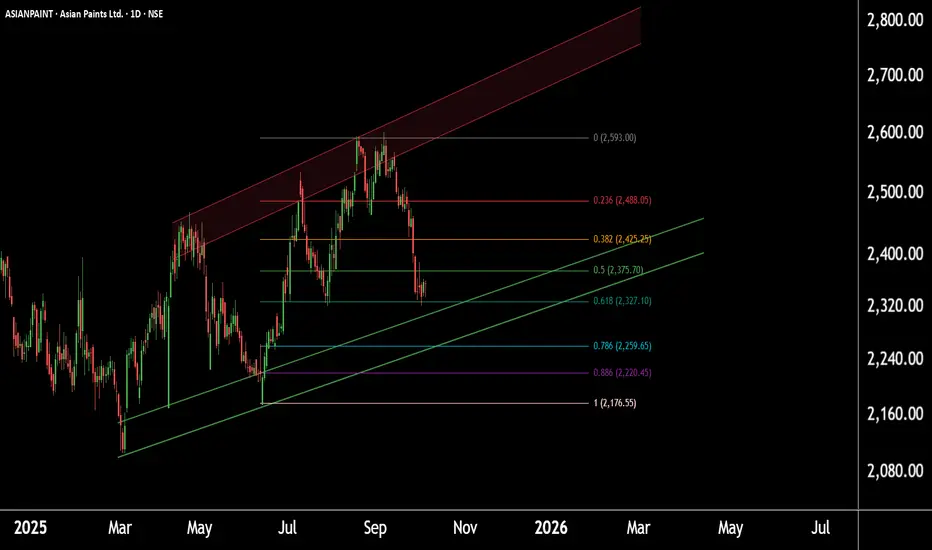
Asian Paints at Demand Zone —Eyes on a Potential Reversal Setup!Asian Paints – Daily Chart Analysis
Chart Timeframe: Daily chart observation.
Current Price Zone: Trading near the Fibonacci golden zone around 2320.
Support Zone: Strong support identified between 2240–2260, aligned with the channel base and Fibonacci retracement.
Technical Confluence: Both channel and Fibonacci levels confirm 2260 as a crucial support level.
Outlook: If these two zones hold, we may see higher prices in Asian Paints in the upcoming sessions.
Thank you.
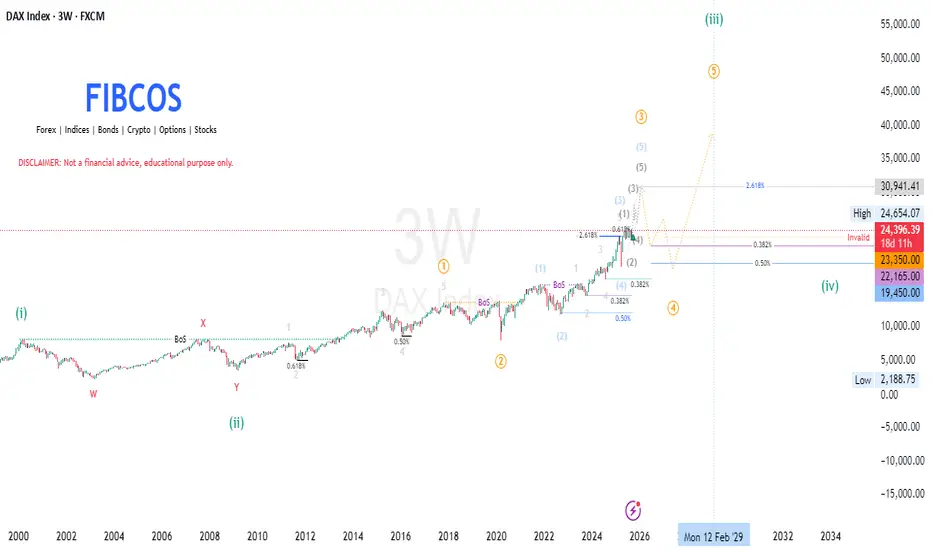
DAX INDEX | Elliott Wave + SMC + Fib + Market CycleDAX INDEX | Super Cycle Wave (3) In Progress | Micro Wave (iv) Correction Expected | Elliott Wave + SMC + Fib + Market Cycle
This macro outlook on the DAX Index (GER40) combines Elliott Wave Theory , Smart Money Concepts (SMC) , and Fibonacci Analysis , tracking the long-term price structure from the 1990s into the expected 2029 Super Cycle top .
We are currently nearing the completion of Micro Wave (iii) inside Super Cycle Wave (3) , with a correction expected as Micro Wave (iv) before a final leg Wave (v) to complete the 20-year Super Cycle advance.
🌀 SUPER CYCLE STRUCTURE (Wave Count Recap)
🔵 Supercycle Wave (1)
📈 Topped in 2000
📐 Five-wave impulse from early 90s
💡 Marked the first major peak of the new macro bull cycle
🔴 Super Cycle Wave (2)
🕰 2000–2009
📉 Multi-year W-X-Y complex correction
🔻 Pulled back to 0.618 retracement of Wave (1)
📍 Bottomed Jan–Feb 2009 — Smart Money accumulation zone
🚀 Supercycle Wave (3) — Now in Progress (2009–2029 Target)
This is a multi-decade impulse wave , subdividing into Micro Waves (i) through (v) .
🟠 Micro Wave (i)
🕰 2009–2018
✅ Clean 5-wave impulsive structure
🔓 Broke above Super Cycle Wave (1) high
📊 Confirmed initiation of Wave (3)
🟠 Micro Wave (ii)
🕰 2018–2020 (COVID crash)
🔻 Pulled back to 0.50 retracement of Wave (i)
📦 Retested key order blocks
💧 Liquidity swept beneath 2016–2018 lows
📈 Smart Money reaccumulation before major expansion
🟠 Micro Wave (iii) — Currently Unfolding
🕰 2020 – Expected top by end of 2025 or early 2026
🚀 Strongest wave in the structure
🔼 Targeting 2.618 Fibonacci extension of Wave (i)
🎯 Target zone: 30,941 (~32K)
📊 Multiple internal impulses have formed
🧠 Price delivery:
Consistent BoS
Minimal retracement
No parabolic blow-off yet → confirming institutional flow
🟠 Micro Wave (iv) — Correction Expected Next
🕰 Expected: 2026 to early 2027
🔻 Projected retracement:
0.382 – 0.5 of Wave (iii)
Target zone: 23,350 – 22,165
💧 Confluence with:
Sell-side liquidity pools
Prior OBs and imbalance zones
⚠️ Reaccumulation phase likely before final rally
🟠 Micro Wave (v) — Final Advance to Complete Supercycle Wave (3)
🕰 Expected top by 2029
🎯 Target range: Above 32,000, possibly toward 35,000+ depending on extensions
🔄 Will mark the peak of Supercycle Wave (3)
📉 Anticipate a major correction in Supercycle Wave (4) after that
📐 FIBONACCI LEVELS OF INTEREST
Structure Key Fib Levels
Supercycle (2) 0.618 retracement of (1)
Micro Wave (ii) 0.50 retracement of (i)
Micro Wave (iii) 2.618 extension of (i) → 30,941–32K
Micro Wave (iv) 0.382–0.5 retracement → 23,350–22K
Micro Wave (v) Possible extension to 38K+
🧠 SMART MONEY CONCEPTS (SMC)
🔓 Break of Structure (BoS) confirmed trend shifts at Wave (i), (ii), and internal impulses
📦 Order Blocks respected at retracement zones (2020 low, 2022 correction)
💧 Liquidity Grabs below previous lows fuel impulsive breakouts
🧱 Price Delivery = Institutional — no euphoric parabolas yet
🎯 Expect engineered liquidity sweep before Wave (iv) reaccumulation
📌 CONCLUSION
We are now nearing the completion of Micro Wave (iii) inside Super Cycle Wave (3) of the DAX. Price is approaching major extension targets (30,941–32,000), from where Wave (iv) correction is due.
This pullback (2026–2027) is expected to offer high-probability re-accumulation opportunities within a Smart Money demand zone before the final macro rally to new ATHs into 2029.
⚠️ After 2029 , expect a larger Supercycle Wave (4) correction phase.
📘 DISCLAIMER: This is a structural, educational market outlook. Not financial advice. Please do your own due diligence and risk management.
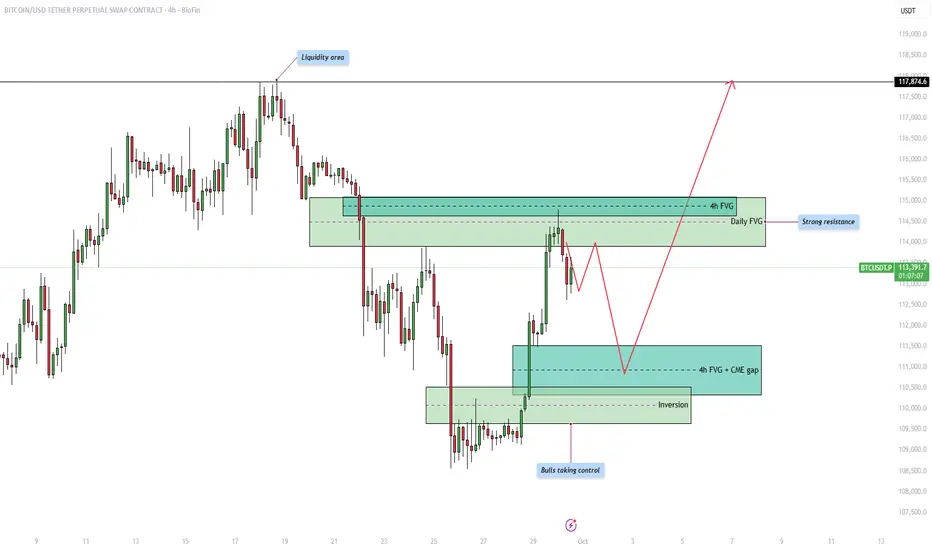
Bitcoin - Shortterm correction in the bullish trend!Introduction
The Bitcoin price action is currently moving within a structured range where both liquidity and fair value gaps (FVGs) are playing an important role in shaping potential market direction. By analyzing the chart, we can identify key areas of liquidity, resistance, and support that traders are likely to pay close attention to in the coming days. Understanding how price reacts around these zones will help anticipate whether bulls can maintain control or if bears will attempt to reclaim lost ground.
Upside liquidity
At the top of the range, we can see a clear liquidity area where price previously reversed. This liquidity pool represents buy-side liquidity, and the market could be drawn towards it as price seeks to sweep the highs. Liquidity is often targeted by the market before making a significant move in the opposite direction, which makes this area important to watch closely.
Resistance from the 4h and daily FVG
Before price can reach higher liquidity levels, it must contend with a strong resistance zone that overlaps with both the 4-hour and the daily fair value gap. This confluence strengthens the resistance, making it more likely that price will struggle to break through immediately. Traders will be watching for signs of rejection within this area, which could cause short-term pullbacks before any potential breakout.
4h FVG and CME gap support
On the downside, the 4-hour fair value gap aligns with the CME gap, providing a strong support level. This zone acts as an attractive area for price to retrace into before continuing higher. It is common for the market to return to such imbalances to fill inefficiencies, so a temporary dip into this support could serve as a healthy retracement before bulls attempt to push price further upward.
Bullish inversion
Another critical development is the inversion zone, where previous resistance has now flipped into support. This shift highlights that bulls are taking control of the market structure, strengthening the overall bullish outlook. As long as this inversion level holds, buyers are likely to defend it aggressively, reducing the probability of a deeper breakdown.
Final thoughts
Overall, the market remains in a bullish posture with upside liquidity acting as a magnet, but significant resistance awaits at the overlapping 4h and daily FVG. Short-term pullbacks into the 4h FVG and CME gap support are likely before the next major move upward. If the bullish inversion continues to hold, we could see a strong push towards the higher liquidity zones, potentially targeting levels beyond 117,000. The coming days will be crucial in determining whether bulls can maintain this control or if resistance proves too strong.
-------------------------
Thanks for your support. If you enjoyed this analysis, make sure to follow me so you don't miss the next one. And if you found it helpful, feel free to drop a like 👍 and leave a comment 💬, I’d love to hear your thoughts!
DB Corp | Crucial Price Action Zone AheadDB Corp | Technical Outlook
On the daily timeframe, DB Corp is currently trading rangebound within a well-defined consolidation zone, with a strong support zone at 250–260.
The stock is respecting the 0.382 Fibonacci retracement level, with a critical support level placed at 254.
If this level holds, we may see a potential upside move towards 287.
However, if the support at 254 breaks, the next major support lies around 170–180.
Conclusion: Price action around the 254 level will be crucial for the next directional move.
Thank You !!

BTCUSDT- 250924 - LONG - Bitstamp - Cycle Top - 1WBTCUSDT- 250924 - LONG - Bitstamp - Cycle Top - 1W
Market Cycle Top: 134k
Look to take profits around 134k

History doesn't repeat but does it rhyme?Lets see if it plays out.
Disclaimer
This content is for informational and educational purposes only and should not be construed as financial or investment advice. The author is not a registered financial advisor. Trading and investing in financial markets involve substantial risk of loss and is not suitable for every investor. Past performance is not indicative of future results. Always conduct your own research and consult with a qualified professional before making any investment decisions.

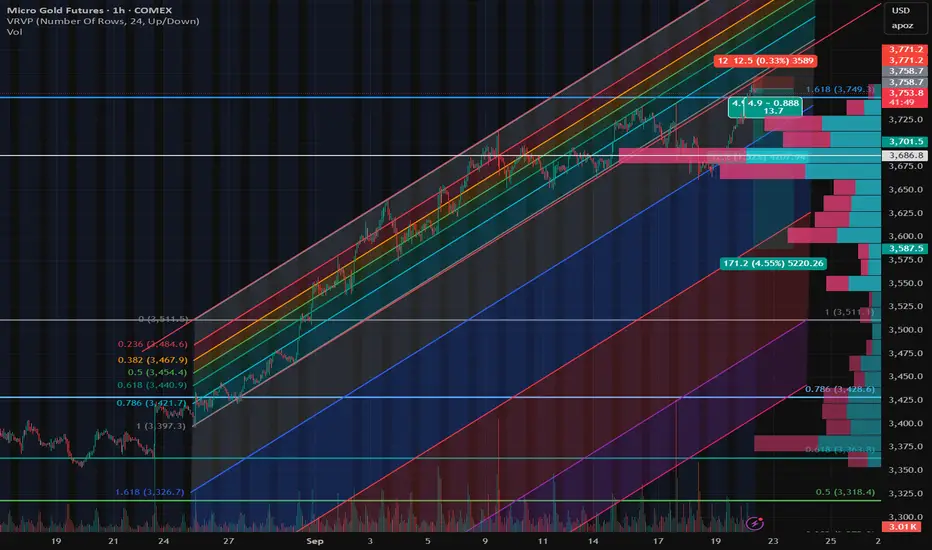
Gold Futures Hedge Update🟡 Gold Futures Hedge Update
Our previous short setup reached the first take profit, confirming that hedging into overextension made sense. Long-term bias on gold remains bullish, but short-term conditions still look stretched, and we’re preparing for another protective hedge.
This is not a bearish reversal call — the goal is to lock in gains and protect profits as gold presses into heavy resistance.
📍 Trade Setup (Short Hedge)
Entry (Short): 3,750 (Fib 1.618 extension + HVN resistance)
Stop Loss (SL): 3,780 (above channel top + HVN cluster)
Take Profit 1 (TP1): 3,700 – 3,685 (volume node / mid-channel support)
Take Profit 2 (TP2): 3,587 (next HVN + structural support)
Take Profit 3 (Stretch): 3,510 – 3,500 (Fib retrace + channel low)
⚖️ Rationale
Gold has been overextended on the short-term chart, pressing into Fib and channel resistance with signs of stalling.
Volume profile highlights key support/resistance nodes that align with Fib levels.
Taking partial profits on the way down while keeping risk tight ensures the hedge protects without overcommitting against the dominant bullish trend.
📊 Plan: Scale into shorts near resistance with defined risk, peel off at TP1 and TP2, leave a runner for deeper correction potential. If gold breaks and holds above 3,790, hedge is invalidated and focus shifts back to long setups.
Bitcoin - Will the parallel channel hold?Introduction
The Bitcoin market is currently showing an interesting structure that offers both bullish and bearish possibilities. By analyzing the liquidity dynamics, the channel formation, and key areas of interest highlighted on the chart, we can gain a better understanding of the potential scenarios that may play out in the short to medium term. This analysis focuses on the recent liquidity sweep, the behavior within the rising channel, and the critical zones that could act as decision points for price movement.
Liquidity sweep above the highs
Recently, the market performed a liquidity sweep above the previous highs. This type of price action typically occurs when liquidity pools are triggered, trapping breakout traders and providing institutional players with favorable entries in the opposite direction. The sweep has set the stage for the next move, and it becomes crucial to see whether price sustains above this level or rejects it decisively.
Rising channel
Price is currently trading within a rising channel, which often acts as a short-term bullish structure but can also precede reversals if broken to the downside. The channel is providing clear levels of support and resistance, with the midline serving as a short-term equilibrium point. As long as price remains inside this channel, traders should expect oscillations between its boundaries, but any break below it could trigger a stronger move toward lower support zones.
Bearish scenario
In the event that price fails to hold within the channel, the bearish scenario points toward a retest of the lower fair value gap (FVG) around the 113,000 level. This would align with a deeper correction, offering the market a chance to rebalance inefficiencies left behind during the recent bullish rally. A sustained breakdown from the channel could accelerate selling pressure, with liquidity below key lows acting as a magnet for price.
Bullish scenario
On the other hand, if price manages to respect the rising channel and reclaim the liquidity sweep level, the bullish scenario would see a continuation toward the higher 4-hour fair value gap around 119,000–120,000. This area is a major point of interest, as it represents an unfilled imbalance that could attract buyers if momentum continues. Holding above the midline of the channel would strengthen the bullish outlook and could even lead to a retest of previous highs.
Final thoughts
Overall, the market is at a decisive stage where both bullish and bearish outcomes remain valid. The liquidity sweep has created a reaction point, and the rising channel offers a clear framework for monitoring price behavior. Traders should remain flexible and prepared for either outcome, watching closely for confirmations such as a clean break of the channel or a strong reclaim of resistance levels. Ultimately, the reaction around the current structure will determine whether Bitcoin continues higher toward the upper fair value gap or corrects lower into the demand zone below.
-------------------------
Thanks for your support. If you enjoyed this analysis, make sure to follow me so you don't miss the next one. And if you found it helpful, feel free to drop a like 👍 and leave a comment 💬, I’d love to hear your thoughts!

Jai TitanTitan fut continously falling from high of 3735 finally took support @ 50% fib retracement level as well as 100 SMA on daily charts with decent OI & volume.
Risk:Reward = 0.5:4
Could b bought here with mentioned stoploss & target

Bullish flag The bullish flag pattern has formed .
and based on FiboNachi and Ichimiko data, it can also rise.

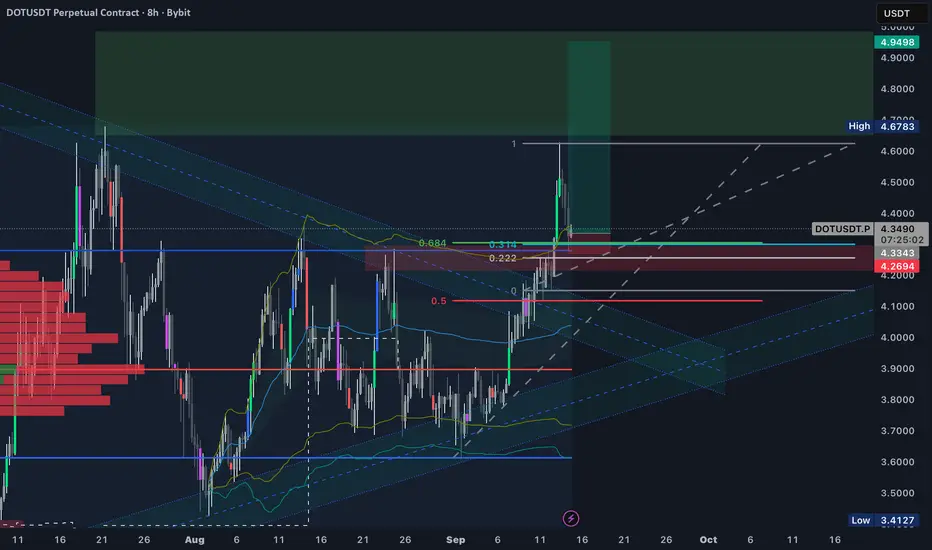
DOT at a decision point: breakout or just a stop hunt?DOT is currently attacking a new high, but the question is whether this move is a true breakout or just a liquidity grab.
This time I’m looking for a quick long setup.
My main zone of interest is 4.25–4.31.
This area lines up with multiple previous highs, which I now consider potential new support. It also includes:
• the 0.314–0.222 retracement from the latest pump,
• the 0.684 level (inverse of 0.314 from the bottom),
• the highest anchored VWAP line.
On top of that, divergences on RSI (14) and MACD (12:26) suggest price could push higher.
We’ve already tested the triangle breakout, so I believe that phase of interest is over. From here, price may dip slightly lower, but it doesn’t have to. A ~3% move against the position is acceptable.
I’m already in the trade.
If DOT retests the 4.25–4.31 zone, I see it as a strong buying opportunity.
Target: At least a new local high around 4.70, where I’ll take my first partial profit.
USD/JPY - Top Down Analysis 🟣 Monthly Chart (Macro Structure)
Context: Price has been ranging within a broad band between 162 resistance and 138–140 support.
Current Zone: Sitting mid-range near 147–148, right under a heavy monthly supply block (150–152).
Bias: Until 150+ breaks clean, upside is capped. Structure suggests more downside liquidity hunts.
🔵 Weekly Chart (Swing Bias)
Supply Zone: Weekly supply at 150–152 rejected strongly.
Trendline: Rising liquidity channel (higher lows), but capped at supply.
Order Flow: Repeated rejections indicate sellers still control the higher timeframe.
Bias: Bearish toward the liquidity resting around 145.
Key Levels:
Resistance: 150–152
Support: 144–145
🟢 Daily Chart (Refined Structure)
Supply Reaction: Strong rejection from the 61.8% retrace within the weekly supply zone.
SSL (Sell-Side Liquidity): Resting neatly at 145 handle, aligning with trendline support.
Bias: Lower-high structure under supply → daily order flow favors continuation down.
⏱ 1H Chart (Execution Layer)
Supply Zone: 147.7–147.9 (confluent with 71% fib retrace & weak resistance).
Reaction: Intraday rejection already showing weakness.
Next Path: Break of weak support at 147.0 would confirm continuation toward 146.8 → 145.5.
Intraday Bias: Sell rallies back into 147.7–147.9.

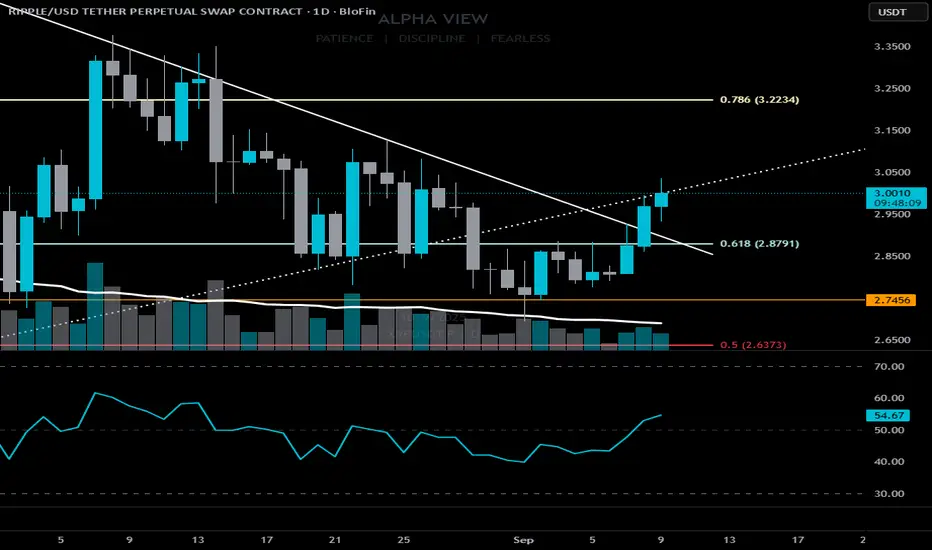
Number 3 is reminding the party he’s still on the guest list.Number 3 is reminding the party he’s still on the guest list. 🥂
CRYPTOCAP:XRP breaking clean from its $2.80–$2.95 consolidation base.
Push into $3.00+ signals bullish continuation if volume holds. Next test sits at $3.10–3.20.
📈 Momentum: creeping into overbought, but room for one more leg higher.
🔊 Volume: breakout backed by real buy-side conviction.
The Alpha View 👇
🎯 Setup is long, but execution requires patience:
— Ideal entry on a retest of $2.95–$2.99 (flipped resistance → support).
— Bonus confluence: a 1H bullish tail.
🎯 Targets:
TP1: $3.20–3.25
TP2: $3.40+ (runner if momentum extends)
⚠️ Don’t FOMO green candles. Precision beats emotion.
⚖️ Watch BTCЗif they stall, XRP’s move could fade.
🔑 Self-Regulate. Risk is the only guest you can control.