TRUMP/USDTFundamental Overview of TRUMP/USDT:
Official Trump Coin (TRUMP) has gained attention due to its association with former President Donald Trump. With a current price of $11.86 and a market capitalization of approximately $2.37 billion, TRUMP ranks among the notable digital assets in the market. (coinmarketcap.com) Its popularity and volatility attract both investors and traders seeking new opportunities.
Technical Analysis:
We see that TRUMP coin is currently trading within a descending channel, respecting two trendlines that form a falling wedge pattern. If the downward momentum persists, we expect the price to drop into the $4.5-$5.0 range, where we anticipate strong buying pressure to emerge.
Key VWAP levels, highlighted with green circles, act as price magnets, making them crucial points of interest for a potential reversal. Additionally, Fibonacci retracement levels indicate significant resistance around $21.15 (0.618 Fib) and $24.22 (0.786 Fib), which could serve as key breakout targets if the price initiates an upward move.
If the price successfully reclaims these resistance levels, a bullish scenario could unfold, potentially targeting $30+ in the mid-term. However, failure to hold support around $4.5-$5.0 could lead to further downside exploration.
Fibonnacci

Falling Wedge Breakout in Play? Key Levels to Watch!After analyzing the chart across multiple timeframes, we have identified a Falling Wedge pattern, signaling a potential bullish breakout. Additionally, bullish divergence is visible on most timeframes, reinforcing the likelihood of upward momentum.
Currently, the price is trading above a strong support level at 146.213, indicating a solid base. Our nearest resistance stands at 147.807—a breakout above this level could pave the way for further gains. The next key targets align with the 38.2% and 50% Fibonacci retracement levels, offering potential profit opportunities.
As always, stick to your risk management strategy to protect your capital. Stay disciplined and trade wisely!

What do you think about today's gold price trend on March 10th?t is likely that today, Monday, gold will break below the 2900-2905 support area to move down towards the 50% Fibonacci level to liquidate all BUY orders in the 2880-2900 zone, and will then adjust strongly upwards again in the mid-week and weekend sessions
Wishing you all profitable trading.
RioNguyen

35 ) XAUUSD - GOLD - on the path of declineWhen gold reached the Fibonacci range of 1.618, I believed that it would fall, and it did, and now it is necessary to predict how much the price will continue to fall.
I think it will decline to 50% of the rise from 2584

Bitcoin, Mind The Gap (85,720) The massive move initiated from Trumps tweet Sunday about the Crypto Strategic Reserve has left a massive gap on the Bitcoin Futures Chart. Gaps tend to get fill sooner rather than later, with a high 90% hit rate on gaps getting filled.
We could see a pullback this week to fill the gap with another run up following back above 90k to save the weekly close ... again.
We see confluence with the golden pocket (0.6128 - 0.65 Fib) here on that retracement and also the most amount of volume (VPVR) being traded there.
A final test of the demand below 90k, which if shown as support, will lead us back into the range of 90k to 110k.

XAUUSD Refocus Trendback📌Gold price extends the rebound early Monday and re-focuses on the $2,900 level.
📌US Dollar falls as EUR/USD rallies hard on potential Ukraine truce; market mood improves.
📌Gold price recovers but remains below 21-day SMA at $2,895 amid the bullish daily RSI.
🔥Buy Gold
$2832 -> $2834
SL $2825
TP 1->$2840 >2->$2850 >3->$2860
🔥Sell Gold
$2882 -> $2886
SL $2890
TP 1->$2875 >2->$2860 >3->$2855

Ada strategic reserve idea Trump has single handedly turned Ada into a desirable digital asset, as he looks to add it to the U.S strategic reserve along side Bitcoin. Now if it actually happens I believe these fib levels and trend line are good targets. It's crazy how one man can turn vaporware into a desirable digital asset. All bets are off however if the strategic reserve does not get passed. Ada will most likely die then.

BITCOIN FILLED CME GAPToday BTC might have bounced-off a 5 months away gap.
OPPORTUNITY :
Ideal buy was in the now filled CME GAP.
We might revisit these price, so 79100$ remain a good spot for a BUY/LONG alert.
General buy zone is from 72.5k$ to 85k$ and should last until approximately mid April .
TARGETS :
Ideal sell would be 136425$ in late July (23/07).
Probable sell zone go from 130k$ to 160k$ and should span from early June to early August .
MAXIMAL $ TARGET :
- There is still a chance for a powerful leg up, in the event of prices nearing 200k$ , profit will have to be taken regularly and without restraint.
MINIMAL $ TARGET :
- A faillure to break above last ATH, so 110k$ is definitely a partial sell price (and will react).
MAXIMAL time TARGET :
- All positions (including altcoins) should be closed before October 2025.
Based on
Chart Tools :
- Fibonacci levels from Retracement and Extension
- Expansion/Consolidation periods durations tendencies from this bullrun
- Regression over time of said periods
- Percent change of said Expansions periods
Statistical Arguments :
- Past Bitcoin cycles (2016 & 2021) general seasonality
- Coinglass's Bull-Market-Peak-Signals had 0/30 indicators showing a top
Fundamentals :
- Optimistic US inflation
- Peace negociations
- Pro-business policies
- Blockchain technology usage growth
- Bitcoin & major crypto adoption in finance
Bias :
- Up-trend intact
- No hard corrections compared to previous bullrun
- I guess i could use some profit

Mastering Fibonacci Retracement: Spotting Key Market Levels! Fibonacci retracement is one of the most powerful tools traders use to identify potential support and resistance levels in trending markets. These levels, derived from the Fibonacci sequence, help predict where price pullbacks might end before the trend resumes.
How Does It Work?
1- Identify a strong move (trend direction). In this case, we see an uptrend after a sharp decline.
2- Apply the Fibonacci retracement tool from swing low to swing high to map key levels.
3- Watch how price reacts at important retracement levels:
🔸 0.236 (23.6%) – Weak retracement, minor support/resistance.
🔸 0.382 (38.2%) & 0.5 (50%) – Moderate pullback, potential reversal zones.
🔸 0.618 (61.8%) – The Golden Ratio, often a strong level for trend continuation.
🔸 0.786 (78.6%) – Deeper retracement, last defense before a reversal.
How to Use It for Trading?
- Look for buying opportunities at the 0.5 or 0.618 retracement if price finds support.
- Watch for resistance near 0.382 or 0.5 in a downtrend.
- Combine Fibonacci with candlestick patterns, volume, or indicators (RSI, MACD) for confirmation.
In this chart, we see price bouncing from the Fibonacci levels, showing how these zones act as potential support and resistance!

GRAB Support: price above VRVP & VRVP lines up w/0.382 FibOn GRAB I am neither promoting a long nor short, but showing support at the 0.382 Fib level especially when it lines up exactly with the VRVP (visible range volume profile). I try to look for a confluence of these factors. 2/26/2025 1153 PST

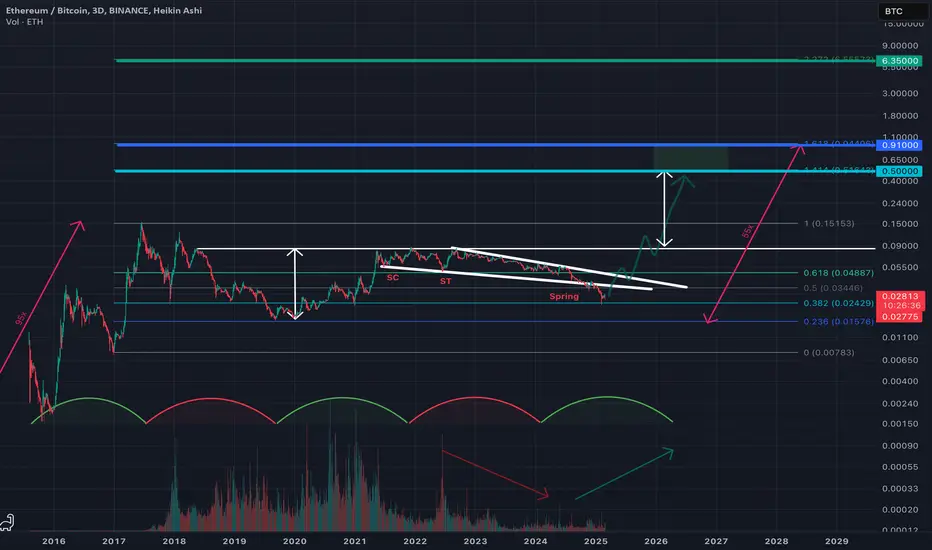
ETHBTC - 2 ETH may soon buy 1 BTCBINANCE:ETHBTC is one of the most hated trades on the market right now. And based on price action from recent months and years - definitely for good reason. Ethereum is being viewed as a stale rust-bucket compared to the superior monetary properties of Bitcoin and the younger exuberance found in Solana. However don’t bet the house on that narrative continuing over the coming months. To me it seems that Ethereum may well have its time to shine once again...
Reasons to be super bullish
As crazy as it may be to say this, Ethereum can soon reach the rather insane price target of 0.5 BTC per ETH in the coming 18 months.
The pattern for the last 6 years has been one of accumulation, Wycoff Accumulation to be exact. Just look at similarities with an example pattern of GOLD posted from a few years ago, of it similarly being in deep accumulation and the price action that followed.
I’m willing to stick my neck out and say that the Wycoff (coiled) spring from the BINANCE:ETHBTC chart above has now completed, after over-shooting the downwards wedge (in white). Such an overshoot usually leads to the most volatile reversals, and is therefore one of my favorite trading patterns.
Not only that, BINANCE:ETHBTC also has a clean-looking cup & handle pattern forming, dating back to May 2018. Should that come to fruition, the minimum price target (taking the height of the cup via white arrows) would equate to 0.5 BTC. That just so happens to also perfectly coincide with the 1.414 fib level drawn.
Now, would Ethereum stop there? You’ve got to imagine so. However it may not…
BINANCE:ETHBTC 's onset to markets saw a 95x (pink arrow). Taking the same measured move, from the bottom in January 2020, would equate to a 30x move from current levels or a 55x from 2020's bottom. That would indicate a final target of 0.91 BTC, at the 1.618 fib, by around April 2026.
Another reason to suggest the selling is over, RSI is putting in a higher low, whilst price is making a lower low.
BINANCE:ETHBTC is mirroring the same setup as September 2019, with similar targets possible.
Reasons to be sceptical
We should be in a clearly bullish period, between Mar-24 to Apr-26 although we have yet to see bullish price action as of today. BINANCE:ETHBTC already enduring its bearish period from Dec-21 to Feb-24, this is unlikely to be another.
If we’re going to see the above come into fruition, we must soon see a huge uptick in volume in Ethereum in the coming days. Watch the green arrow underneath the chart to see if that happens over the coming 15-18 months.
BINANCE:ETHBTC looks to have already bounced off the 0.024 BTC per ETH. Or the 0.382 fib level (turquoise line). I expect very limited downside from here.
What might trigger a bullish change?
MSTR thanks to Michael Saylor has popularised his company as a quasi-leveraged ETF, turning the balance sheet of his company into a fast-tracked success.
Can you think of another company that is flush with billions of cash that is aligned with defi, NFT & decentralized markets and has one person on the board calling the shots for their investment committee? GameStop could well be the first public company to put Ethereum on their balance sheet and spark a huge step-change in the amount of institutional investment into ETH, over say BTC. They currently have $4.8bn in cash on their balance sheet and have yet to announce any M&A or changes to their corporate treasury.
Watch-out for catalysts, alt-season I sense is coming...
34 ) XAUUSD - SHORTLY SHORT ;)OANDA:XAUUSD
Considering the upward movement of the gold cheetah, I believe that it will have a correction according to Fibonacci

Can someone help me out with ARC?I'm trying to find out where we are in the elliot wave count. My idea is that we are in wave 5 of wave I. But we keep going up. I want to buy at the bottom of wave 2.

Daily DXY The US Dollar Index (DXY) is currently indicating the likely direction after closing below 106.965. I anticipate a move back to the 107.200-250 range before continuing its bearish swing. Several confluences support this, including the reversal point, an ascending trendline, a descending trendline, a rejection candlestick, the daily 0.382 Fibonacci level, the 4-hour 0.5 Fibonacci level, and a 4-hour order block. My target for the DXY is 106.083. As for gold, it has reached a new all-time high of 2954.944. I expect a pullback before it heads higher, potentially towards the 3000 level.
4hr DXY Chart
1hr DXY Chart
30m Gold Chart

Why I Believe Brent Crude Oil is Headed to $125 by 2026www.tradingview.com 1. Supply Constraints: Geopolitics & Trade Wars
One of the biggest drivers of higher oil prices is geopolitical instability and trade policy shifts. We're already seeing major disruptions that could tighten supply further:
Middle East Tensions – The ongoing conflicts in the Red Sea, Iran, and Israel continue to create uncertainty. Attacks on shipping routes and production facilities raise the cost of transporting oil and increase the risk of supply disruptions.
Russia-Ukraine War – With Russian oil facing sanctions and restrictions, global supply chains have had to adjust, making energy markets more fragile.
OPEC+ Output Cuts – OPEC has repeatedly restricted production to keep prices elevated, and there’s no indication they’ll reverse course anytime soon.
U.S.-China Trade War & Tariffs – With Trump leading in the 2024 election polls, there’s a growing possibility that tariffs on China will return. If this happens, energy trade flows could be further disrupted, and retaliatory tariffs could add to price pressures.
Strategic Petroleum Reserve (SPR) Depletion – The U.S. used a huge portion of its SPR to lower oil prices in 2022-2023, but refilling those reserves will create additional demand, pushing prices even higher.
With these factors at play, supply is becoming more constrained, making it easier for prices to rise with even small increases in demand.
2. Demand Boom: AI, Bitcoin Mining, and Agriculture
While supply is tightening, demand for energy is skyrocketing in unexpected ways.
AI Data Centers & Industrial Demand
AI computing is extremely energy-intensive, and as companies like Microsoft, Google, and Amazon continue to expand cloud computing infrastructure, demand for electricity is surging.
Many data centers still rely on fossil fuels for backup power and cooling systems, meaning oil and gas usage will continue to increase.
Bitcoin (BTC) Mining
Bitcoin mining requires massive amounts of electricity, and as BTC prices rise, mining activity expands in energy-dependent regions.
With the 2024 BTC halving, miners will have to run at full efficiency, which translates to higher global energy consumption.
Agriculture & Food Production
The world’s growing population and extreme weather events (like El Niño) are driving higher food production needs.
Fertilizer production, transportation, and machinery all require oil, meaning agricultural commodities are directly contributing to higher energy demand.
Together, these factors suggest that demand for oil is only going to increase, making it harder for supply to keep up.
3. Oil Price vs. Stock Market: The $100 Warning Zone
Historically, when oil prices get too high, the stock market struggles. Some key examples:
2008 Recession: Oil peaked at $147 per barrel, right before the financial crisis.
2018 Market Drop: When oil hit $80+, stocks sold off sharply.
2022 Inflation Shock: Oil reached $120+, leading to Fed rate hikes and market turmoil.
Why $100+ Oil is a Warning Sign for Stocks
Higher oil prices = higher inflation. This forces central banks like the Federal Reserve to keep interest rates high, making borrowing more expensive.
Energy costs impact corporate profits. Companies across multiple sectors will see shrinking profit margins as transportation and production costs rise.
Consumer spending takes a hit. Gasoline prices cut into disposable income, which weakens overall economic growth.
If Brent crude pushes above $100, expect increased market volatility and a potential selloff in equities.
4. Brent Crude Technicals: Price Targets for 2026
Current Setup
Price Holding Key Support (~$70-$74) – Brent is respecting major trendlines, signaling strong demand in this area.
Breakout Zone Around $80-$82 – If price moves above this level, it could trigger a rally to $100+.
Fibonacci Levels Align with $125 Target:
0.618 Fib retracement at $106 → First major resistance.
0.786 Fib extension at $119 → Likely next target.
1.272 Fib extension near $125 → Final upside target for 2026.
This technical setup aligns with macro fundamentals and historical oil cycles, making a move to $125 increasingly probable.
5. Investment & Trading Strategy
Long-Term Bullish Strategy
Accumulation Zone: $70-$74 (solid support).
Upside Targets: $106, $119, $125.
Stop Loss Consideration: Below $68 (invalidates thesis).
Hedging Against Market Risk
SPX Put Options / VIX Calls – If oil rises toward $100+, consider hedging against an equity downturn.
Energy Stocks (XLE, Exxon, Chevron) – These stocks tend to outperform during oil bull markets.
Gold & Commodities – Hard assets often rally when energy prices increase.
Conclusion: The Path to $125 Brent Oil
Geopolitical instability + supply cuts = higher prices.
AI, Bitcoin, and food production = rising demand.
If oil approaches $100, watch for an equities pullback.
While no forecast is perfect, all signs point to oil prices rising into 2026. If this trend plays out, investors should be prepared for higher inflation, tighter Fed policy, and increased market volatility.
Would love to hear your thoughts—do you think oil will hit $125, or are we headed lower? 🚀📊

foxforex|goldWill gold make a new peak this week?
Since gold is at prices it has never reached before, we need to determine the next targets with Fibonacci and according to Fib, the next target is 2,850.

ABC Correction perfection A Beautiful ABC pattern
Lines up perfectly with :
- Previous range Point Of Control
- Previous month Value Area Low
- A Daily Naked
- The 1 to 1
- Global Swing Low Avwap
Elliot wave theory
I expect early next week being hit. Then target the highs for a wyckoff distribution pattern.
People are already positioning EU swing longs, without a spring.
We need to punish dem early bulls 🏌️♀️
CAPITALCOM:DXY OANDA:EURUSD CME:6E1! ICEUS:DX1!

Volume Spread Analysis (VSA) with Fibonacci on Large Candles Volume Spread Analysis (VSA) with Fibonacci on Large Candles (Bullish & Bearish)
If you spot a large candle with high volume, whether bearish or bullish, you can use Fibonacci retracement on the candle itself to determine potential reversal or continuation zones. Here’s how to apply it in both scenarios:
1️⃣ Large Bearish Candle (Bearish Bar)
📉 (Red candle with high volume closing near the low)
How to Identify a Bearish Candle?
✅ The candle has a large body and closes near the low (strong selling signal).
✅ The volume is significantly higher than previous candles → Institutional Selling (Smart Money Selling).
✅ If volume is high but the candle doesn’t close at the low, it could indicate hidden buying (stopping volume).
How to Draw Fibonacci on a Bearish Candle?
1️⃣ Identify the high and low of the bearish candle:
• High = The top of the candle.
• Low = The bottom of the candle.
• This represents the range of the selling pressure in the market.
2️⃣ Draw Fibonacci levels between the high and low:
• 0% = Low (Bottom of the bearish bar).
• 100% = High (Top of the bearish bar).
• Key levels to watch:
• 38.2% → Weak retracement, market may continue down.
• 50% → Balance point, strong resistance possible.
• 61.8% → Potential reversal zone; if price fails to break it, the downtrend may continue.
• 78.6% → If price breaks this, trend may change.
3️⃣ If the market continues downward, check Fibonacci extensions:
• 127.2% & 161.8% → Downside targets if the bearish trend continues.
Confirming Volume Spread Analysis (VSA) for Selling
✅ Sell Entry: If the price retraces to 38.2% - 50% and rejects with weak volume.
❌ Stop Loss: Above 61.8% or the last swing high.
🎯 Targets:
• Break of the large candle’s low.
• Fibonacci extensions 127.2% or 161.8%.
2️⃣ Large Bullish Candle (Bullish Bar)
📈 (Green candle with high volume closing near the high)
How to Identify a Bullish Candle?
✅ The candle has a large body and closes near the high → Strong buying signal.
✅ The volume is significantly higher than previous candles → Institutional Buying (Smart Money Buying).
✅ If volume is high but the candle doesn’t close at the high, it could indicate supply absorption.
How to Draw Fibonacci on a Bullish Candle?
1️⃣ Identify the high and low of the bullish candle:
• High = The top of the candle.
• Low = The bottom of the candle.
• This represents the range of the buying pressure in the market.
2️⃣ Draw Fibonacci levels between the high and low:
• 0% = High (Top of the bullish bar).
• 100% = Low (Bottom of the bullish bar).
• Key levels to watch:
• 38.2% → Shallow pullback, market may continue up.
• 50% → Balance point, potential bounce area.
• 61.8% → Strong support zone; if price holds with weak volume, an uptrend may continue.
• 78.6% → If broken, trend may reverse.
3️⃣ If the market continues upward, check Fibonacci extensions:
• 127.2% & 161.8% → Upside targets if the bullish trend continues.
Confirming Volume Spread Analysis (VSA) for Buying
✅ Buy Entry: If price retraces to 38.2% - 50% and bounces with high volume.
❌ Stop Loss: Below 61.8% or the last swing low.
🎯 Targets:
• Break of the large candle’s high.
• Fibonacci extensions 127.2% or 161.8%.
🎯 Quick Summary: When to Enter?
🔴 Sell:
• Large red candle, price retraces to 38.2% - 50% with weak volume.
• Stop loss above 61.8%, target at 127.2% & 161.8% extensions.
🟢 Buy:
• Large green candle, price retraces to 38.2% - 50% with strong volume.
• Stop loss below 61.8%, target at 127.2% & 161.8% extensions.

Bitcoin's BTC Next Moves?My prediction for BTCs next moves in the coming year.
We have touched the 618 fib which looks like resistance and I believe there will be approx a 30% pullback to fill the current $77k-$81k CME gap.
Once this happens we are likely to see alt szn.
We will then see a upwards movement to approx $150k which is 10x from the $15k low. BTC will most likely move up higher and will form a large wick possibly up to $17k-$180k

XAUUSDprice consolidate Box beark makeing HH and HL 2nd HH define.
so my entry at fib retracment 0.50% level anticipate 2nd HL market define so my oder type is limit.
entry price 2656.4
Stop loss at (1st HL) 2613.9
Take profit 2698.9
RRR 1:1

XAUUSD GOLD ⇒ Sellers interested in retesting gold.Hello, Traders!
As we all know, this week gold made ATH with a red candle and also did a retest to 2799, but this retest is not enough for the continuation of the bullish trend. Here I have presented my analysis regarding gold.
Currently, gold is trading at 2799 at the gold support level, as the new week begins in three hours, so gold can do a gap down opening with a strong volume candle, and we can see 2774 in gold because gold is in a strong bullish trend, so it should touch 2774, which is the golden zone of fib to continue its bullish trend.
Support Level: 2758 – 2767
Resistance Level: 2815 – 2819
Fib Golden Zone: 2773 – 2763.
Liquidity Zone: 2730 (strong low)
Because gold is trading in an ascending channel, our aim would be the ascending trendline, but our entry point should be the golden zone of fib.
Do not enter at ATH because it is the initial technical analysis, thus our buy entry is quite dangerous, so we will wait for a retest.
For now, we can take sell trades for scalping, but always utilize SL because SL is better than liquidation, thus I'm in for sell until 2763.
If you enjoy my analysis Please support my concept and follow me for more analysis.
Have a wonderful day, thank you!

AVAX/USDTAfter the liquidity was taken out at the November low, the coin is showing a good reaction. I have highlighted the zone for buying the coin.
Targets for growth:
Target 1 = 30.35
Target 2 = 36.15

ETH | C&H | $8k+++☕The C&H Pattern With a Little Tilt to It💧
This chart showcases how we can grab forecasted targets using chart patterns similarly to my other postings and how we can use these patterns to our convictions
BITSTAMP:ETHUSD is currently still trading within the falling wedge pattern and will play a big role into being the cause of the C&H breakout
As shown on the chart we can see the main trendline target in orange somewhat lines up with fib extension and C&H trajected target which creates a great confluence in forecasting what's next to come
After price makes it's way to breakout at the upper trendline we should see a push towards $4,800 in the acts of a Pullback Trigger and Not Permanent Resistance
Price action doesn't go in a straight line forever so we'd have to see a cool off period retesting atop from the breakout (SnR) for a second point contact to launch price further, the first point contact is where we are now, and by adding a SMA or EMA this will allow for optimal accumulating zones
The red squares are the major and minor pivot points to calculate the levels for the Fibonacci extensions and also line up with Fib Channel which was measured from the base structure (main trendline in orange).
Follow to stay tuned on what price action will do next after this hopefully plays out🚀
