BTC Spot Accumulation ZoneAcross all BTC Bear Markets there have been shared technical indications of where the floor formed. These are not coincidental. Extrapolating the technical patterns of previous cycles we derived a simple and actionable thesis for a potential BTC floor zone which should be watched closely and may be used as accumulation zone for the next bull cycle. The best accumulation strategy would see you DCA into the acc. zone building out an average position staying within that zone.
DYOR + NFA
Fibretracement

Beautiful retracement!DHI Analysis (Nasdaq)
CMP 149.64 (02-02-2026)
Beautiful retracement till Golden Pocket Zone around 113 - 115.
Bullish Divergence appearing on Weekly tf.
Crossing & Sustaining 195 may lead it towards 245 - 247.
However, if 113 is broken in any case,we may witness further selling pressure.

Technical Analysis: BTC Fibonacci Support Confluence & Trade Set1. Fibonacci Analysis:
the significance of the 0.5 (50%) and 0.618 (61.8%) Fibonacci retracement levels derived from the prior major swing. These are two of the most critical confluence zones in technical analysis, where institutional and algorithmic buy-side liquidity is often clustered .
2. Price Action Interpretation:
The fact that the price has respected these levels and initiated a bounce indicates strong underlying demand . The current test of this Fibonacci support cluster is a classic bullish consolidation pattern within a larger uptrend. A firm rejection from this zone would confirm the strength of the trend and signal that the correction is likely complete.
3. Market Expectation:
We anticipate that this Fibonacci support confluence will hold strong, serving as a launchpad for the next impulsive wave. A successful hold here increases the probability of a resumption of the uptrend , targeting a break above the recent high and extension toward new cycle highs.
4. Trade Signal & Risk Management:
Direction: Long
Trigger: A bullish rejection candle (e.g., hammer, bullish engulfing) on the 4H or daily chart at the 0.5–0.618 Fib zone, accompanied by rising volume.
Stop-Loss (SL): Placed just below the 0.78 Fib level (e.g., below $88600) to invalidate the thesis on a breakdown.
Take-Profit (TP): Set at a 1:2 Risk-Reward (R:R) ratio. The first TP target would be the prior swing high, with the final TP projected for a measured move toward new highs.
Risk : Position size must be calculated so that the potential loss from the SL is within your strict maximum risk-per-trade parameters (e.g., 1-2% of portfolio ).
Summary:
The confluence of two major Fibonacci retracements provides a high-probability, low-risk area for a long entry. The setup offers a favorable asymmetric risk-reward profile (1:2 R:R). Execution depends on a confirmed bullish reaction at the defined support zone.
😊DISCLAIMER: ((trade based on your own decision))👽

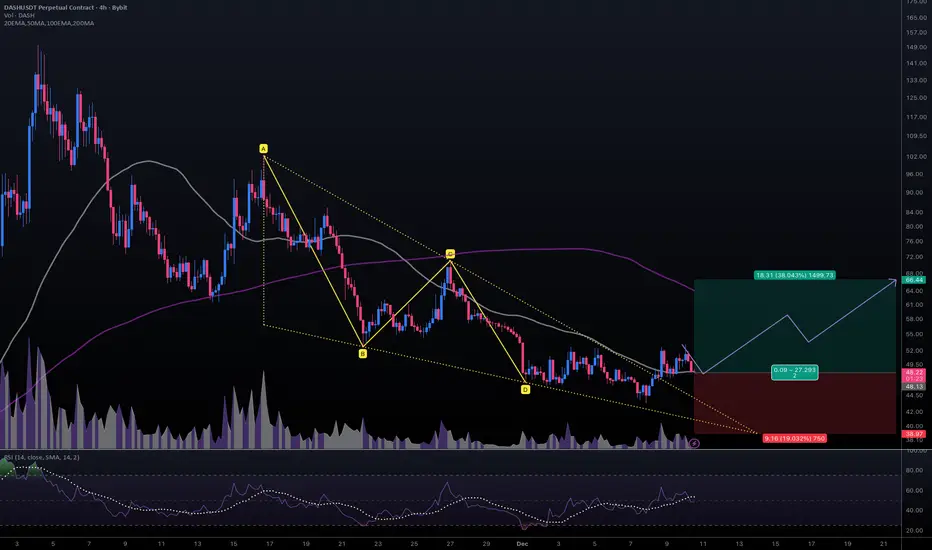
#DASHUSDT #4h (ByBit) Falling wedge breakout and retest [LONG]Digital Cash is pulling back to 50MA regained support where it seem likely to bounce towards 200MA resistance.
⚡️⚡️ #DASH/USDT ⚡️⚡️
Exchanges: ByBit USDT
Signal Type: Regular (Long)
Leverage: Isolated (2.0X)
Amount: 5.3%
Current Price:
48.22
Entry Targets:
1) 48.13
Take-Profit Targets:
1) 66.44
Stop Targets:
1) 38.97
Published By: @Zblaba
CRYPTOCAP:DASH BYBIT:DASHUSDT.P #4h #DigitalCash #Privacy dash.org
Risk/Reward= 1:2.0
Expected Profit= +76.1%
Possible Loss= -38.1%
Estimated Duration= 1-2 weeks
#BCHBTC #1W (Binance) Big falling wedge breakoutCRYPTOCAP:BCH just regained 50MA weekly support in sats, performing better than CRYPTOCAP:BTC
Seems likely to continue bullish towards 200MA resistance, probably after a pull-back.
⚡️⚡️ #BCH/BTC ⚡️⚡️
Exchanges: Binance
Signal Type: Regular (Long)
Amount: 7.0%
Current Price:
0.004885
Entry Targets:
1) 0.004657
Take-Profit Targets:
1) 0.006329
Stop Targets:
1) 0.003987
Published By: @Zblaba
CRYPTOCAP:BCH BINANCE:BCHBTC #BitcoinCash #PoW bitcoincash.org
Risk/Reward= 1:2.5
Expected Profit= +35.9%
Possible Loss= -14.4%
Estimated Gaintime= 4-7 months

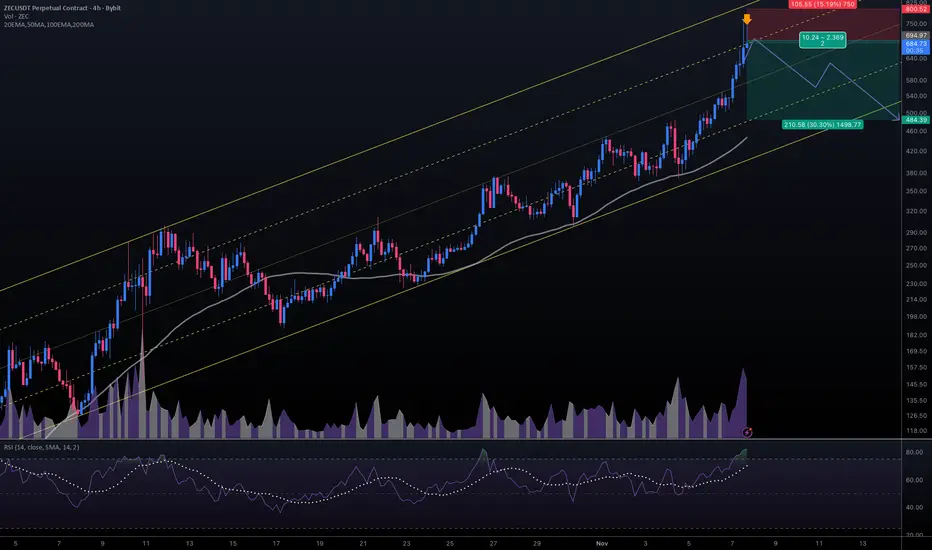
#ZECUSDT #4h (ByBit) Ascending channel on resistance [SHORT]Zcash just printed a shooting star and entered overbought territory again.
It seems likely to finally retrace down towards 50MA support, short-term.
⚡️⚡️ #ZEC/USDT ⚡️⚡️
Exchanges: ByBit USDT
Signal Type: Regular (Short)
Leverage: Isolated (3.0X)
Amount: 4.4%
Current Price:
684.73
Entry Targets:
1) 694.97
Take-Profit Targets:
1) 484.39
Stop Targets:
1) 800.52
Published By: @Zblaba
CRYPTOCAP:ZEC BYBIT:ZECUSDT.P #4h #Privacy #ZK z.cash
Risk/Reward= 1:2.0
Expected Profit= +90.9%
Possible Loss= -45.6%
Estimated Gaintime= 1 week
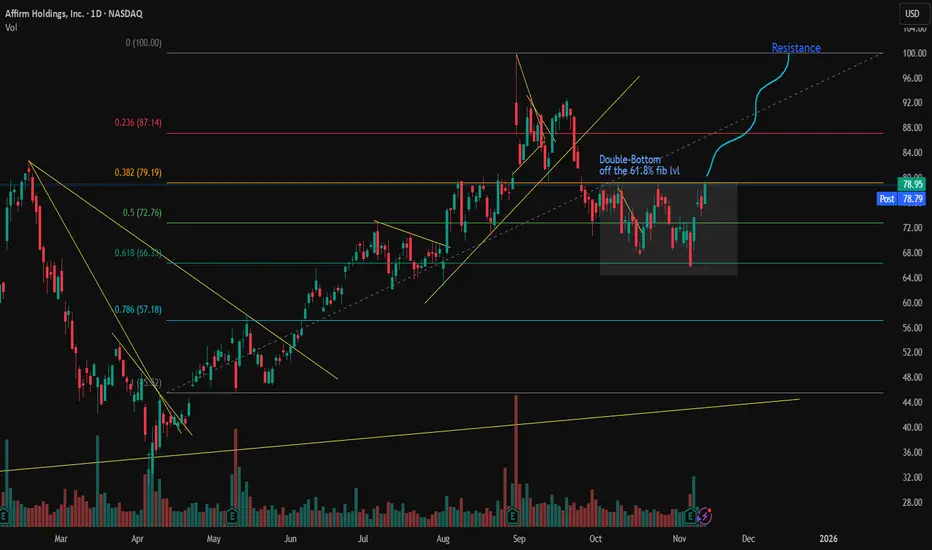
AFRM to $100NASDAQ:AFRM
Let's keep this simple!! AFRM just formed a beautiful double-bottom, testing support at the 61.8% fib retracement level and bouncing nicely from it. It doesn't get better than this, and it will be testing resistance at the $100 price level sooner rather than later.
Eth Golden Pocket Reversal Play (short-term trade)ETH touched the top of the golden pocket which is a common area for reversals. Opened short as it crossed below .618 level and will stop out just above .65 level (not a fib). Looking for a 50% retrace of yesterday's bounce.

XAU/USD Update 2Next move on the way, focus on proper risk management & stay disciplined. Wishing you successful trades..!
Key Factors:
1. Price creates range.
2. IDM hunt still in pending.
3. IMB left above BB.
4. Unmitigated OB.
Once price reach our zone, after confirmation we'll execute trade. Remember confirmation candle is very important. Let's see how it will work.

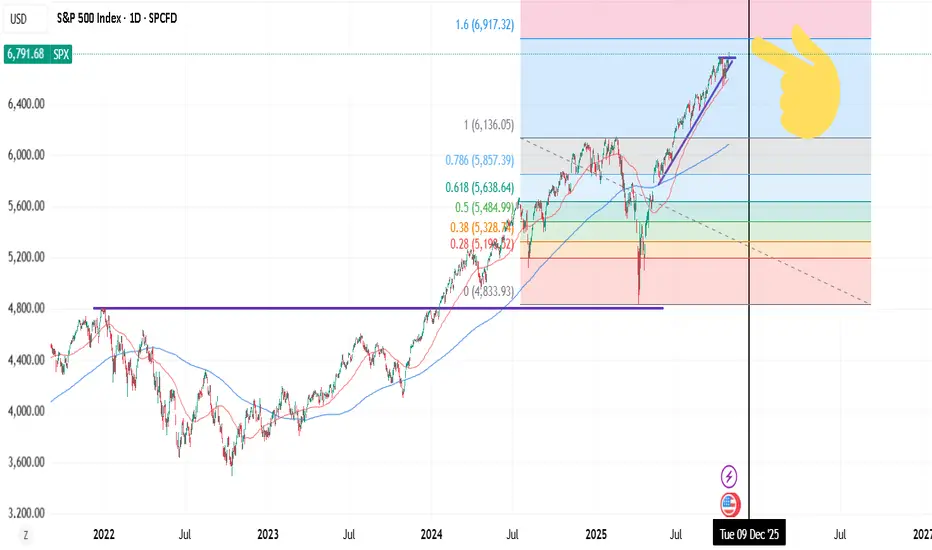
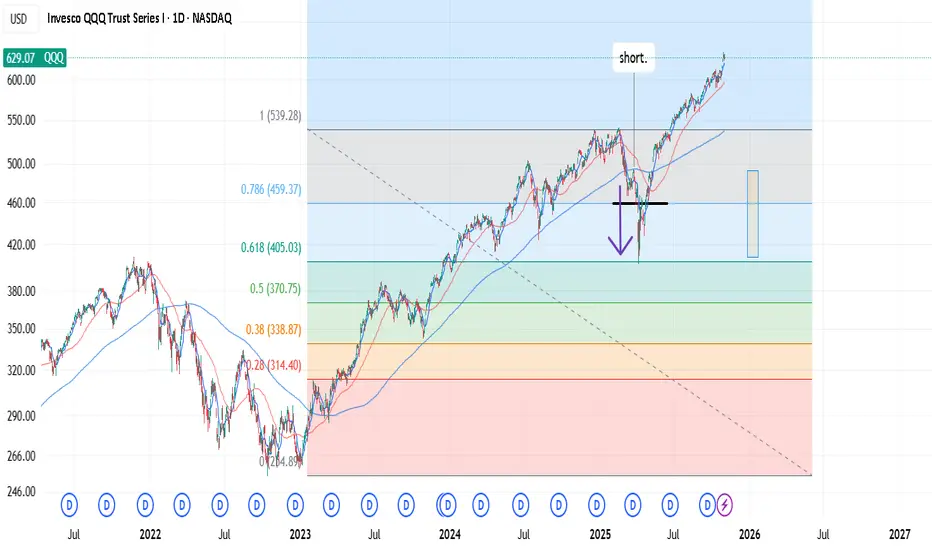
1.6 FIB Ceiling - Stock market correction soon in NOV/DEC.You can apply 1.6 FIB to FAANG or QQQ for high probability ceilings. VIX "structure" (pattern) or setup also indicates it. Stocks forming a sharp "wedge drop", extension from 50dma.
Bullish near term (probably?), correction in NOV/DEC.
I wonder if the first 5 (monthly) trading days in NOV are not volatile AF. 😂
Fibonacci levels. Trading corrections.I saw a Lance B video saying that fibonacci is garbage that people use with a confirmation bias, and it doesn't work. (He says, anything besides the 50% FIB). His thesis is that fibonacci is a phenomenum from nature and at some point traders decide to test and apply it in markets.
I disagree. Using LOG trend, during corrections, prices respect the fib level ratio . It's math, more or less. I only trade tickers, if the moves are in the correlation with whole market (index). I also think, it's practical only on corrections, bear markets. 🤔
-> When the "key" level breaks, it tests the next level . Which isn't practical due to high variance.
-> which means, you build the shorts during last resistance . Where market forces pull over. (50dma death cross as a force).
(Your hedge is the inertia from 50dma DC).
I think this is a cool, powerful setup to keep it mind. 👏
XAU/USD Update 1Next move on the way, focus on proper risk management & stay disciplined. Wishing you successful trades..!
Key Reason:
1. 1 hour supply area.
2. In smaller time frame we've IMB inside this supply area.
3. Confirmation is very important. Let's see how it will work.

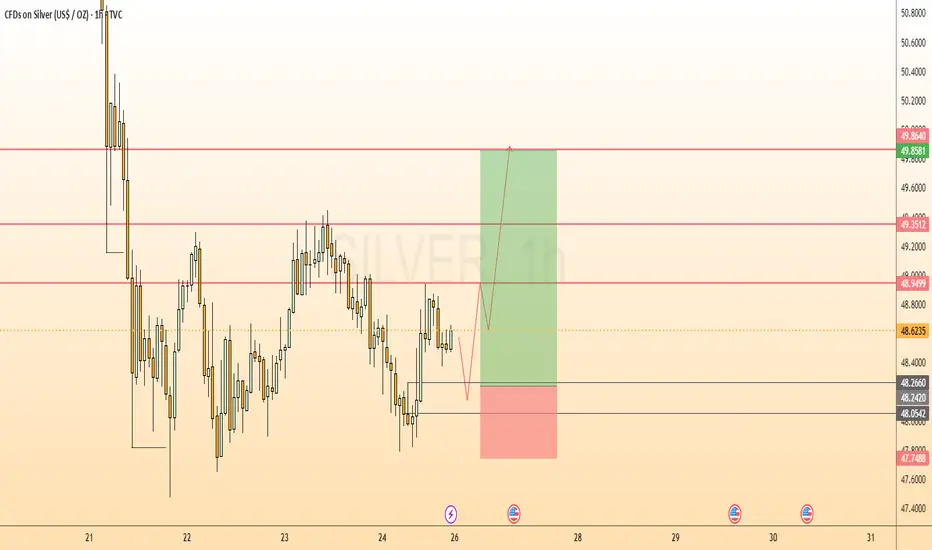
SILVER UpdateNext move on the way, focus on proper risk management & stay disciplined. Wishing you successful trades..!
Key Reason:
1. 1H Bullish OB formation.
2. BISI still in pending.
3. From this zone possible bullish move expected.
Let's see how it will work.
XAG/USD UpdateNext move on the way, focus on proper risk management & stay disciplined. Wishing you successful trades..!
Key Reason:
1. Structure was bullish.
2. price grab sell side liquidity.
3. Fresh strong low + demand zone formation.
4. Possible Bullish move expected from this zone.
This is not a financial advise. Let's see how it will work.

XAU/USD Update 1Next move on the way, focus on proper risk management & stay discipline. Wishing you successful trades..!
Key Reason:
1. Fresh B.block along with orderflow.
2. BISI still in pending.
3. Structure was bullish.
This is not a financial advice. Confirmation is very important. Let's see how it will work.

GBP/USD UpdateNext move on the way, focus on proper risk management & stay disciplined. Wishing you successful trades..!
Key Reason:
1. Fresh demand zone.
2. Price sweep all liquidity.
3. Fresh MSS formed.
4. Bullish move expected from this demand zone.
This is not a financial advice. Confirmation is important. Let's see how it will work.

XAU/USD Update 1Next move on the way, focus on proper risk management & stay disciplined. Wishing you successful trades..!
Key Reason:
1. Market structure remain bullish with BOS confirmation.
2. Fresh demand zone still pending.
3. Price expected to retrace towards strong demand zone for liquidity grab.
4. If bullish momentum remain strong then we'll see further upside move.
This is not a financial advice. Confirmation very important. Let's see how it will work.

XAU/USD Update 1Next move on the way, focus on proper risk management & stay disciplined. Wishing you successful trades..!
Confluences & Key Reason:
1. Hidden demand zone.
2. FVG still in pending.
3. E.L still in pending.
4. SSL still in pending.
5. If Bulls pressure remain strong then we'll see huge upside rally.
This is not a financial advise. Confirmation very important. Let's see how it will work.

EUR/USD UpdateNext move on the way, focus on proper risk management & stay disciplined. Wishing you successful trades..!
Confluences & Key Reason:
1.Recently price move in a strong upside channel. It's mean bulls are active.
2.Fresh & unmitigated demand zone still in pending.
3.BISI still in pending.
4.Possible buying move expected from this demand zone.
This is not a financial advice. Confirmation very important. Let's see how it will work.

XAU/USD Update 2 weeklyNext move on the way, focus on proper risk management & stay disciplined. Wishing you successful trades..!
Key Reason:
1. Market structure is strongly bullish.
2. Clean BOS formed.
3. Fresh BB + Demand still in pending.
4. BISI still in pending.
5. If price retraces into our demand zone, we'll look for entry opportunities. A sustained bullish momentum from this level could trigger a strong upward rally.
This is not a financial advice. Confirmation is very important part. Let's see how it will work.

XAU/USD Update 1Next move on the way, focus on proper risk management & stay disciplined. Wishing you successful trades..!
Key Reason:
1. Strong Supply Area.
2. Price give break down in smaller time frame.
3. MSS formed in lower timeframe.
This is not a financial advice. confirmation very important. Let's see how it will work.

XAU/USD Update 1Next move on the way, focus on proper risk management & stay disciplined. Wishing you successful trades...!
Key Reason:
1. Strong resistance and order flow still in pending.
2. Price creates BPR.
3. BSL still in pending.
4. If bearish pressure sustain than possible downfall will come.
This is not a financial advice. Confirmation very important. Let's see how it will work.

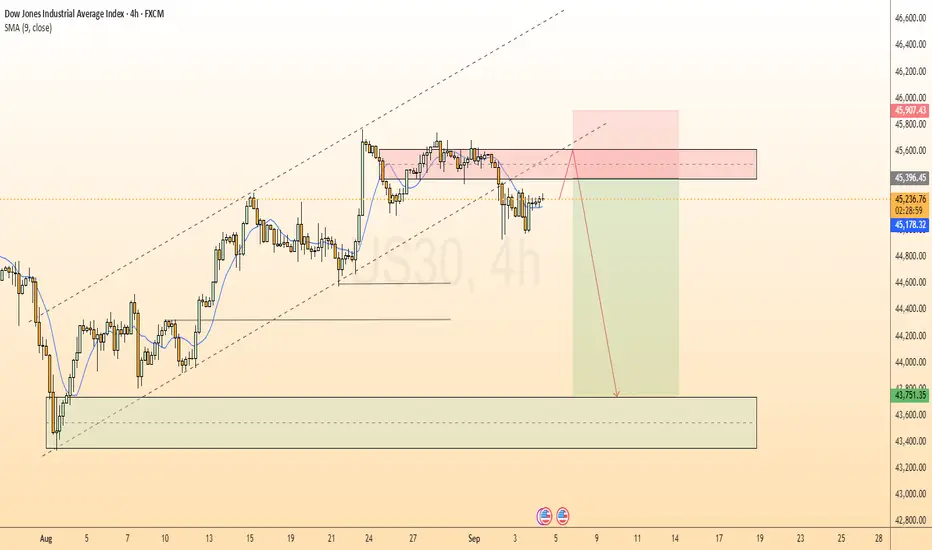
US30 UpdateNext move on the way, focus on proper risk management & stay disciplined. Wishing you successful trades...!
Confluences And Key Reason:
1. Price creates bullish channel.
2. Market price break bullish channel toward downside.
3. Fresh supply + order flow still in pending.
4. If this supply is valid than we see price further move downside.
This is not a financial advice take it with your own risk. In this case confirmation is very important. If price give confirmation than we open our trades. Let's see how it will work.