BAC Bank of America 1Y Chart Review - RSI/KC concernToday you can review the technical analysis idea on a 1Y linear scale chart for Bank of America (BAC).
It seems there is some action going on here with BAC reviewing the RSI and the Keltner Channel. This may be a concern.
If you enjoy my ideas, feel free to like it and drop in a comment. I love reading your comments below.
Disclosure: This is just my opinion and not any type of financial advice. I enjoy charting and discussing technical analysis. Don't trade based on my advice. Do your own research! #millionaireeconomics #BAC
Finance

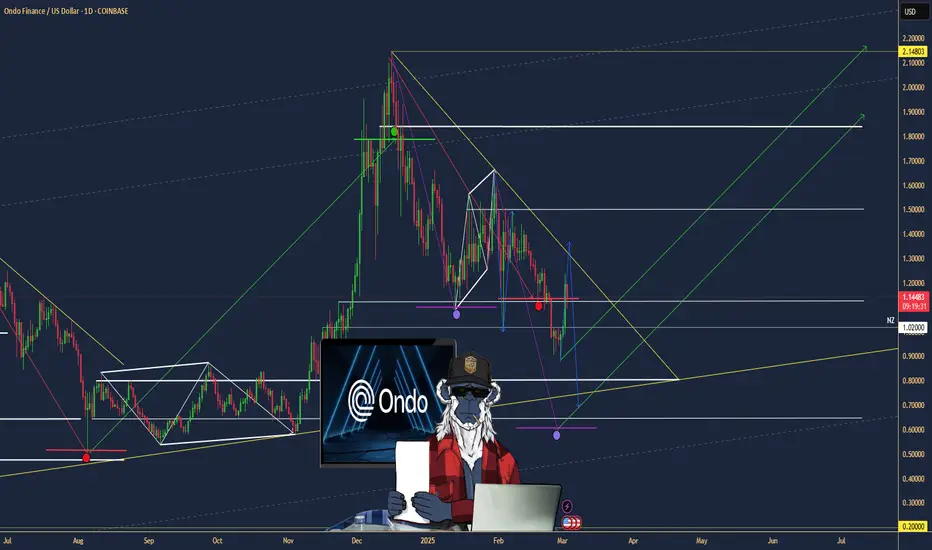
ONDO Short-term analysis | Trading and expectationsLSE:ONDO
🎯Price printed a 3 white knight bullish engulfing pattern, jumping above the daily pivot and the descending resistance trend-line. Price must get above $0.5 to negate the bearish divergence that has emerged. Wave 1 of a new uptrend appears to be underway.
📈 Daily RSI tapped oversold with bullish divergence, where it caught a bid.
👉 Analysis is invalidated below the swing low, $0.35
Safe trading


XAGUSD ON 2026Following our previous silver analysis — which reached its projected target sooner than expected — we now turn our attention to the potential trend of this attractive metal for 2026.
The bullish trend in silver may continue into the new year, possibly with slightly reduced momentum, but still intact. Over a 3 to 6-month horizon, a move toward the $100 level can be considered a realistic scenario.
Key and high-probability support zones for potential entries have been marked on the chart. However, it’s important to note that there is no guarantee price will revisit these levels, and they should only be considered in the event of a corrective move.
++++ Silver at $70 shows strong similarities to Bitcoin in late 2019.
Manage your silver positions carefully and make the most of the opportunity.

FENER Stock Analysis CommentaryFENER Stock Analysis Commentary
Daily technical indicators are Positive. The stock is currently trading at the 9.54 support level. Being very close to the 21-day moving average (9.87), if the stock breaks above this average, it may have a chance to fill the price gap at 10.10.
If prices remain above this average and positive momentum continues, the stock may target higher price gaps. The highest price gap is at 11.89. If this gap is filled, the stock will also have moved above the 200-day moving average (11.36).
Resistances: 10.05 – (10.11) – 10.68 – (10.77)
Supports: 9.54 – 8.97
We would appreciate it if you boost our posts.
Don’t forget to share them on your social media accounts as well.
Legal Disclaimer:
The information, comments, and recommendations provided here do not constitute investment advisory services. Investment advisory services are offered within the framework of an agreement between the investor and authorized institutions such as brokerage firms, portfolio management companies, or non-deposit banks. The views expressed here are personal opinions only and may not be suitable for your financial situation, risk tolerance, or return expectations. Therefore, investment decisions should not be made based solely on the information provided on this page.

XAUUSD – Key Resistance Ahead in the Ongoing Bullish CycleAlthough gold has been moving with weaker momentum compared to silver, it still remains firmly within its broader bullish cycle. The most important level ahead is the $4,400 zone, and a breakout above this area would confirm the beginning of gold’s next major bullish wave.
This upcoming move is also supported by the macro outlook and fundamental conditions, suggesting that a continuation to the upside is likely in the near future.
At the same time, the impact of global economic, political, and especially geopolitical/military developments on gold should not be overlooked, as they continue to play a crucial role in shaping its long-term trajectory.

Visa: More Upside PotentialVisa’s blue wave (x) still has significant upside potential before reaching its peak. With price still trading below our resistance level at $375.51, we expect the subsequent wave (y) to take over and guide the stock into our green Long Target Zone between $292.19 and $266.47. Within this range, we anticipate the completion of the larger turquoise wave 4 before any sustainable gains can take hold. Alternatively, it’s possible that the turquoise wave alt.4 has already concluded. In this scenario, the stock would move directly toward the $375.51 resistance—and potentially break through both this level and the $394.49 mark (probability: 33%).

USDT Dominance#USDT_dominance, after reacting to the 6.07% resistance zone, may continue its corrective move toward the static support near 5.5%. Such a decline would generally support a more bullish environment for the overall crypto market.
Once price reaches this key level, market conditions must be reassessed:
A break below the 5.5% support would signal further downside for USDT dominance and could lead to a stronger and broader market-wide rally across crypto assets.

USD/MXN: Super Peso Defies Dollar StrengthHere is the revised article with all hyperlinks removed, maintaining the professional formatting and analysis.
The Mexican peso continues to frustrate dollar bulls, maintaining a defiant stability despite broad greenback strength.
Over the last five sessions, the USD/MXN pair moved just 0.4%. This neutrality highlights the peso's formidable resistance. While the U.S. dollar gains ground globally, Mexico’s currency holds the line. Investors call this the "Super Peso" phenomenon. It stems from a unique confluence of high yields and structural economic shifts.
Macroeconomics: The Rate Differential Shield
Mexico’s high interest rates act as a primary defensive wall. The Bank of Mexico (Banxico) set its benchmark rate at 7.25% in November. Conversely, the U.S. Federal Reserve maintains a target of 4.00%. This 3.25% spread creates a massive incentive for carry traders. Investors borrow cheap dollars to buy yielding pesos. This constant demand buoys the currency even when market sentiment sours.
Economics: Inflation and Policy
Inflation in Mexico is cooling, validating Banxico's strategy. October data showed headline inflation dropping to 3.57%. This progress allows policymakers to consider gradual easing. However, aggressive cuts pose a risk. Narrowing the yield spread too quickly could erode the peso's appeal. Banxico must balance growth needs against currency stability.
Geostrategy & Geopolitics: The Nearshoring Fortress
Global trade tensions have inadvertently strengthened Mexico's hand. The U.S.-China decoupling forces corporations to shorten supply chains. Mexico is the logical beneficiary of this "nearshoring" wave. Its geographic proximity to the U.S. market is a supreme strategic asset. This geopolitical realignment drives Foreign Direct Investment (FDI) to record levels. Long-term capital inflows provide a structural floor for the peso, independent of daily speculative flows.
Industry Trends: Manufacturing Renaissance
Industrial parks across Northern Mexico are operating at near capacity. Global manufacturers are relocating essential production lines from Asia to states like Nuevo León. This shifts Mexico’s economy higher up the value chain. We see a transition from simple assembly to complex manufacturing. This industrial depth creates sustained demand for pesos to pay local operational costs.
Technology & Cyber: Digital Finance Evolution
Mexico’s financial sector is undergoing a rapid technological maturation. Fintech adoption is surging, facilitating record remittance flows. Digital platforms now process billions of dollars efficiently and securely. Cybersecurity investment is rising in tandem to protect this digital infrastructure. Robust cyber-defenses build institutional trust, encouraging further capital repatriation.
Science & High-Tech: The Innovation Hub
The narrative of cheap labor is evolving into one of skilled innovation. Hubs like Guadalajara are attracting high-tech R&D centers. This "Silicon Valley of Mexico" fosters a new class of engineering talent. Science-based industries, including medical devices and aerospace, are expanding. This diversification reduces reliance on oil exports and strengthens the currency's fundamental value.
Patent Analysis: Intellectual Property Growth
Patent filings reflect this high-tech shift. International companies are increasingly filing IP protections within Mexico. Patent data indicates growth in automotive and aerospace engineering sectors. This signals a long-term commitment to the market. Companies do not protect IP in transient manufacturing bases. They do so in strategic, long-term hubs. This entrenchment further stabilizes the economic outlook.
Management & Leadership: Central Bank Discipline
Banxico’s leadership has demonstrated exceptional discipline. They moved earlier and more aggressively against inflation than many G7 peers. This assertiveness established deep credibility with global markets. Investors trust the central bank to defend the currency’s purchasing power. Prudent management serves as an intangible but vital asset for the peso.
Outlook: The Dollar Threat
Risks remain despite these strengths. The U.S. Dollar Index (DXY) is rebounding toward the 100 level. A sustained breakout could pressure emerging market currencies. If the DXY reclaims early-2025 highs of 110, the peso will face a severe test. Traders should watch the 18.59 resistance level closely. A break above this could signal a shift in momentum.

20+ Stocks for November: Your Ultimate Investing Radar📅 October is wrapped up, and a new month always means a new chapter on the charts.
Monthly closes reveal which breakouts are real, not temporary spikes, but clear signs that investors are willing to pay higher prices than before.
📊 I’m looking for those moments where the market proves it has changed its mind — when former resistance finally turns into support, and timing starts creating an edge.
That’s one of the biggest strengths of technical analysis: we don’t hope it moves, we see the action on the chart.
-----------------------------------
🔍 Over the past days, I’ve done another full round of research:
I scanned through both the Nasdaq 100 and S&P 500 , and also handpicked a few strong setups from Europe.
In total, you’ll find 20+ stocks today — each with its own description and plan.
I know that sounds like a lot, but there are quite a few of you here already 🙏, and every investor has a different strategy.
So don’t feel you have to study everything… just scan the names: if something catches your eye, stop and dig in.
If not, scroll on. You don’t need to cover them all.
📣 The purpose of my work is simple:
"to give you good, technically correct ideas — ones that avoid the classic mistakes that come from buying at the wrong time."
…and when you combine that with your own fundamental homework, your success rate might turn out surprisingly green.
-----------------------------------
🧭 November radar
In today’s post, you’ll find both breakout setups and corrections that have reached strong support zones.
I’ll also go through the major indices, explaining:
“why it might be smarter to take half positions instead of going all in.”
☕ So grab your coffee… and let’s kick off with 10 breakout ideas!
👇
Amazon (AMZN)
No need for a long introduction here. When a member of the Magnificent Seven delivers a clean breakout, it’s a signal you don’t want to ignore.
📈 For those who regularly add to their Mag7 holdings or rotate between them monthly, Amazon would be my pick this time.
While META’s recent correction isn’t a bad zone either, technically speaking, AMZN shows the stronger setup right now.
-----------------------
Dell Technologies (DELL)
Dell Technologies is one of the largest IT companies in the U.S., providing computers, servers, and cloud infrastructure solutions.
Over recent quarters, Dell has gained solid momentum — especially from AI server demand, which helped lift margins thanks to its higher-value infrastructure products.
Revenue also came in above expectations in the latest report, boosting investor confidence and pushing the stock to new highs.
📈 From a technical perspective, the breakout is clear:
The $150 resistance, which had held for almost a year and a half, finally gave way in October.
The structure is now open to the upside, and the chart shows clear strength.
The decision is simple: enter now, wait for a deeper retest, or just keep it on your radar — your call.
-----------------------
Nokia (OMXHEX: NOKIA)
A few weeks ago, I mentioned that Nokia was setting up for a potential breakout, and look at that, it actually did.
The company announced a collaboration with NVIDIA, which triggered the long-awaited move higher, breaking through its previous resistance zone.
The €5.5 level mentioned earlier is now history, and the monthly close above it confirms the breakout’s validity.
Whether you enter immediately, wait for a retest, or skip it because it doesn’t fit your style — again, your call. Technically valid!
-----------------------
Steel Dynamics (STLD)
Steel Dynamics ranks among the largest steel producers in the U.S., known for using recycled steel and low-emission production methods.
With a P/E of 20 (forward ~12), the company benefits from U.S. infrastructure investments and the broader manufacturing uptrend.
Recent quarterly results have been steady, the balance sheet is strong, and cash flow remains solid, supporting potential future growth.
📈 Technical setup:
This chart checks every box of a classic breakout play:
..........
🧭 Full radar and extended notes are available on my main page — you’ll find it easily.
All the best,
Vaido

BTCUSD — Daily Swing Plan (1D) # BTCUSD — Daily Swing Plan (1D)
**Thesis:** Macro trend remains bullish, but a liquidity sweep into demand is likely before continuation toward the upper resistance band.
## Key Levels
* **Resistance:** 103,571 → 106,000 (pivot), then **116,626 – 119,784** (primary take-profit zone)
* **Demand / Support:** **92,660 – 88,656** (staged buy zone)
* **Dynamic support:** rising green trendline intersecting ~98–100k
## Base Case (Pullback then Rally)
1. Price wicks into **92,660 – 88,656** to collect liquidity.
2. Reversal back above the trendline; reclaim **103,571** and hold as support.
3. Extension toward **116,626 – 119,784** for distribution/TP.
## Alternative Bull Case
* Fast reclaim and hold above **103,571** without a deep retest → grind toward **110k+** and then **116–120k**.
## Bear Invalidation / Risk
* **Daily close below 88,656** invalidates the bounce setup and opens **85k / 81k**. Reassess if triggered.
## Indicators & Context
* **Stoch RSI (3,3,14,14) 1D** is oversold (~16), favoring mean-reversion higher.
* **Price action** suggests a potential “V-reversal after sweep” from demand; confirmation is a **daily close above 103,571**.
## Execution Plan (Not financial advice)
* **Entries:** scale in across **92.7k → 90k → 88.7k** (inside demand).
* **Invalidation:** hard stop on **daily close < 88,656**.
* **Take-profit:** partial at **103.6k**, then **110k**, and **116–120k** (primary).
* **Risk:** keep sizing conservative; avoid over-leverage; focus on daily closes, not intraday spikes.
**One-liner:** Expect a sweep into **92.7–88.7k**, then a reclaim of **103.6k** and continuation into **116–120k** unless **88.7k D1 close** fails.
Disclaimer: This analysis is for educational purposes only and reflects personal opinions—not investment, trading, or financial advice. Crypto assets are highly volatile and carry risk of total capital loss. Always do your own research, manage risk carefully, and trade at your own responsibility.

Crypto will boom, BUT...In my view, the cryptocurrency market is poised for a significant multi-year rally.
However, such a rally cannot begin without a major transfer of capital, from weaker holders to large institutional players. This is why I believe we are likely to experience a sharp correction in the coming days or weeks, possibly extending toward the end of the year.
My outlook for this short-term downturn is driven by two key factors:
Persistent uncertainty surrounding the Federal Reserve’s next policy move, particularly whether it will proceed with an interest rate cut in December, and a bearish pattern emerging in the global money supply. After a notable recent decline, this formation suggests further contraction ahead.
The good news is that this potential market shakeout may serve as the final reset before Bitcoin establishes its bottom. Those who withstand the upcoming volatility will likely find themselves well-positioned for the next major bull run.
#bitcoin #crypto #finance #economy #market #analysis

LC 1W: When the Market Spreads Its WingsOn the weekly chart of LendingClub (LC) , a “golden cross” has formed - the MA50 crossing above the MA200 from below, confirming a medium-term trend shift in favor of buyers. The current price of 15.30 is trading within the 0.705–0.79 Fibonacci zone (14.54–15.32), which now acts as a key support after the breakout. Structurally, the asset is moving within a broadening ascending channel, suggesting potential for increased volatility and range expansion.
Technically, the market shows strength: the upward impulse was accompanied by an abnormal spike in volume, both MA50 and MA200 are positioned below the price, and the nearest resistance is at 17.26 (1.0 Fibonacci level). A breakout above this area opens the way to the 1.618 extension at 22.95–23.02. The scenario is invalidated if the price closes below 12.65, which would pull it back into the previous descending structure.
Fundamentally, LendingClub benefits from easing tensions in the US debt market and moderate growth in consumer lending. Positive earnings momentum and the resilience of its business model add further confidence to the bulls.
Tactical plan: as long as the price holds above 14.54–15.32, the medium-term growth scenario remains valid, targeting 17.26 and 23.02. The optimal entry would come after confirming the support hold and spotting a local reversal candlestick pattern on the daily timeframe.
As they say, a golden cross isn’t just an indicator - it’s a first-class ticket to the trend league. Just make sure you don’t miss the flight.

BTC/USD (4H Analysis) — October 15, 2025Bitcoin is currently consolidating below the minor supply zone (113.5K–114.5K) and above the local demand zone (110.8K–111K).
The overall market structure remains bearish, with clear lower highs and lower lows forming after a strong rejection from the major supply zone at 120K–122K.
Key Zones
🟥 Major Supply: 120K–122K → heavy distribution zone from previous top.
🟥 Minor Supply: 113.5K–114.5K → short-term retest area.
🟩 Major Demand: 108K–110K → strong support area where buyers are likely to step in.
Main Scenario (Bearish Bias)
- Price may retest the 113.5K–114.5K zone soon.
- If a bearish rejection or engulfing candle forms, BTC could extend its drop toward 108K–110K.
Alternate Scenario (Bullish Reversal)
- If BTC closes above 115K (4H), the bearish structure invalidates, opening the path toward 118K–120K.
If you find this analysis helpful :
👉 Follow for more BTC & market updates,
💬 Share to help others stay informed,
❤️ Like to support and keep this research going!

Friday - the day the market shows its true faceEveryone loves chasing moves early in the week - Monday, Tuesday, news, data drops. But if you look closer, the most honest market signals usually appear on Fridays. By that time, the fight between buyers and sellers is settled, and the price reveals who really has control.
When big funds and banks are confident about direction, they don’t rush to close positions before the weekend. The market often ends the week at its highs - and Monday continues the same move. But if selling pressure picks up late on Friday, it’s usually a warning sign: traders are nervous and prefer not to hold risk over the weekend.
Friday’s close isn’t just another candle - it’s the verdict for the entire week. A close near the top of the range means demand is strong; near the bottom means fear and profit-taking are taking over.
Retail traders often close everything before the weekend to “stay safe.” But smart money uses those thin Friday hours to shake out weak hands and grab liquidity. That’s why the real moves often begin right after those late-week impulses.
What to keep an eye on:
1. Watch where the price closes within the weekly range - it sets the tone for Monday.
2. Check volume during the last trading hours - it tells you who’s really in control.
3. A strong Friday move with no news? Often that’s the setup for next week’s trend.
Friday’s action is rarely random. It’s the final scene before the next act of the market drama.
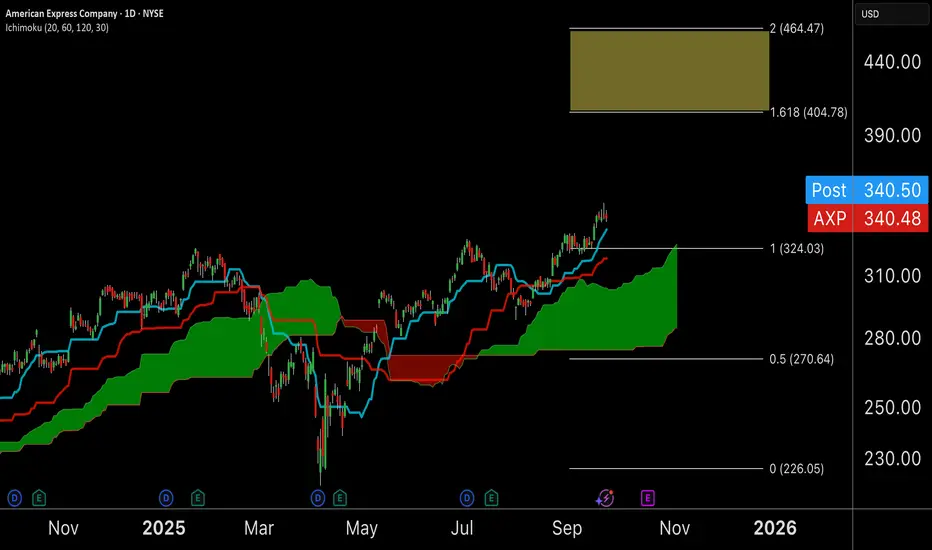
AXP Multi Month Cup and Handle BreakoutAXP has been on a monster bull run and the strength continues with positive technicals all around.
Cup and handle has broken out and is consolidating around the $340 level. While momentum is slowing down we are setting up for a strong push with seasonality + rate cuts as tailwinds
Target is +18-35%
Option contract for Nov 21 up 100% already and I will be upping sizing with a daily close above $340
$ONDO: Ondo Finance – Tokenizing the Future or Facing Roadblocks
(1/9)
Good morning, champs! ☀️ LSE:ONDO : Ondo Finance – Tokenizing the Future or Facing RWA Roadblocks?
Ondo Finance just joined Mastercard’s Multi-Token Network, aiming to tokenize U.S. Treasuries! But with market volatility, is this RWA gem a buy or a wait? Let’s dive in! 🔍
(2/9) – PRICE PERFORMANCE 📊
• Recent Trend: Transaction volume spiked to 400M in Jan 2025, now ~300M 💰
• Market Insight: Up 1.6% recently (Daily Hodl, Feb 2025) 📏
• Sector: RWA tokenization surging with TradFi interest 🌟
It’s buzzing in the DeFi space! ⚙️
(3/9) – MARKET POSITION 📈
• Market Cap: Not specified; holds 40% of tokenized securities market 🏆
• Holdings: U.S. Treasuries, bonds via USDY, OUSG tokens ⏰
• Trend: Whales hold 88% of tokens, per IntoTheBlock 🎯
Firm, leading RWA tokenization! 🚀
(4/9) – KEY DEVELOPMENTS 🔑
• Partnership: Joined Mastercard MTN as first RWA provider (Feb 26, 2025) 🔄
• Expansion: Teamed with World Liberty Financial for RWAs 🌍
• Market Reaction: Steady growth in transaction volume 📋
Adapting, bridging TradFi and DeFi! 💡
(5/9) – RISKS IN FOCUS ⚡
• Volatility: Crypto market swings could hit token value 🔍
• Regulation: Compliance hurdles in tokenized assets 📉
• Concentration: High whale ownership (88%) risks dumps ❄️
Tough, but risks loom! 🛑
(6/9) – SWOT: STRENGTHS 💪
• RWA Leader: 40% tokenized securities market share 🥇
• Big Backers: BlackRock, Coinbase Ventures support 📊
• Tech Edge: Tokenizing U.S. Treasuries for DeFi 🔧
Got fuel in the tank! 🏦
(7/9) – SWOT: WEAKNESSES & OPPORTUNITIES ⚖️
• Weaknesses: High whale concentration, market volatility 📉
• Opportunities: TradFi integration, DeFi yield growth 📈
Can it tokenize to the moon? 🤔
(8/9) – 📢Transaction volume at 300M, Mastercard partnership live, your take? 🗳️
• Bullish: $2 soon, TradFi loves it 🐂
• Neutral: Steady, risks balance ⚖️
• Bearish: $0.90 looms, whales dump 🐻
Chime in below! 👇
(9/9) – FINAL TAKEAWAY 🎯
SMCI’s transaction volume and TradFi ties scream potential 📈, but whale concentration adds caution 🌿. Volatility’s our buddy—dips are DCA gold 💰. Grab ‘em low, climb like pros! Gem or bust?
TSMC: AI Chip Titan – Still the King or Facing New Challengers?Good morning, everyone! ☀️ TSMC: AI Chip Titan – Still the King or Facing New Challengers?
(1/9)
TSMC’s riding the AI wave with record Q4 2024 profits, but with U.S.-China curbs and fab delays, is this semiconductor king untouchable or at a crossroads? Let’s unpack it! 🔍
(2/9) – PRICE PERFORMANCE 📊
• Q4 2024: Net income up 57% to $11.4B, revenue climbed 39% 💰
• Full Year 2024: Revenue hit $87.1B, up 34% from 2023 📏
• Sector Trend: AI chip demand soaring, per Reuters 🌟
It’s a powerhouse, driven by tech’s hunger! ⚙️
(3/9) – MARKET POSITION 📈
• Market Share: Over 60% of global foundry market 🏆
• Clients: Apple, Nvidia, AMD—big names rely on ‘em ⏰
• Trend: Expanding fabs in U.S., Japan, Germany 🎯
Firm, holding the throne but not without battles! 🚀
(4/9) – KEY DEVELOPMENTS 🔑
• Q4 Earnings: Record $11.4B profit, per Jan 16 Reuters 🔄
• Expansion: Arizona fab faces delays, full ops by 2027? 🌍
• Market Reaction: Shares up 81% in 2024, still strong 📋
Adapting, with global eyes on its moves! 💡
(5/9) – RISKS IN FOCUS ⚡
• Geopolitics: U.S.-China export curbs hit demand 🔍
• Costs: U.S. fab chips 50% pricier than Taiwan 📉
• Talent: Lack of skilled U.S. workers slows growth ❄️
Tough, but risks loom large! 🛑
(6/9) – SWOT: STRENGTHS 💪
• Profit Surge: 57% net income jump in Q4 2024 🥇
• Tech Lead: 5nm mass production, 3nm in R&D 📊
• Client Base: Powers Apple, Nvidia, more 🔧
Got silicon in the tank! 🏦
(7/9) – SWOT: WEAKNESSES & OPPORTUNITIES ⚖️
• Weaknesses: High U.S. fab costs, talent gaps 📉
• Opportunities: AI chip demand, new fabs in Japan, EU 📈
Can it keep the lead amid global shifts? 🤔
(8/9) – 📢TSMC’s Q4 profit up 57%, AI booming, your take? 🗳️
• Bullish: Still the king, long-term winner 🐂
• Neutral: Steady, but risks weigh ⚖️
• Bearish: Curbs and costs slow growth 🐻
Chime in below! 👇
(9/9) – FINAL TAKEAWAY 🎯
TSMC’s record profits signal AI dominance 📈, but U.S.-China curbs and fab delays add caution 🌿. Volatility’s our friend—dips are DCA gold 💰. Grab ‘em low, climb like pros! Gem or bust?

A Deep Study into Malaysia Solar Industry & Selected PlayersMalaysia’s solar industry is entering a new phase of expansion from 2025 onwards, underpinned by the government’s National Energy Transition Roadmap (NETR), the roll-out of LSS5, and corporate demand through the Corporate Renewable Energy Supply Scheme (CRESS). This policy backdrop is fuelling opportunities for both Bursa-listed companies and US-listed Malaysian firms with solar exposure.
The sector’s growth trajectory is further reinforced by Tenaga Nasional Berhad’s substantial grid modernisation programme and rising renewable energy demand from hyperscalers and industrial players, particularly in Johor’s rapidly developing data-centre cluster.
Among the local names, Solarvest Holdings Berhad has emerged as one of Malaysia’s most established integrated solar providers, with more than 2 GW of completed and ongoing projects spanning utility-scale and commercial installations. Its ability to execute across jurisdictions, coupled with a strong track record in engineering, procurement, construction and commissioning (EPCC), places the company in a prime position to benefit from LSS5 contract awards and corporate PPAs.
Similarly, TNB Engineering Corporation, a subsidiary of Tenaga Nasional, brings the scale and balance sheet of the national utility to the solar build-out. Its role as an EPC contractor allows it to capture utility-scale opportunities, particularly as TNB itself is tasked with driving the national energy transition agenda.
On the commercial and industrial front, Plus Xnergy has carved out a niche as a turnkey solutions provider with more than 210 MWp of rooftop projects completed. Its focus on accessibility and affordability gives it an edge in serving SMEs and corporates eager to manage costs and decarbonise through solar adoption.
In addition to the local universe, there are two notable Malaysian companies listed on NASDAQ that provide investors with exposure to the solar growth story. Agape ATP Corporation (NASDAQ: ATPC) , historically focused on wellness and health products, has recently pivoted into green energy through its subsidiary ATPC Green Energy Sdn Bhd. Although still in the early stages, the company is signalling intent to participate in renewable energy projects alongside its core business.
Founder Group Limited (NASDAQ: FGL) also offers solar exposure. The company has secured tangible project wins, including a US$4.5 million floating solar farm award in January 2025 and a US$2.6 million rooftop solar project in March 2025. It has also entered into an MoU with GCL Systems for renewable projects valued at up to US$220 million, signalling a pipeline of potential large-scale opportunities.
Overall, Malaysia’s solar sector offers a spectrum of opportunities. For investors seeking exposure on Bursa, Solarvest and TNB Engineering Corporation provide scale and execution capabilities, while Plus Xnergy captures rooftop growth. For those looking at US-listed counters, Founder Group appears to be the stronger and more credible option given its project wins and MoU pipeline, whereas Agape ATP remains a higher-risk, early-stage pivot into green energy. With LSS5 now in progress and corporate demand under CRESS expanding, the investable landscape is broadening, and well-positioned players are likely to enjoy a multi-year growth cycle.

Bitcoin to $500K by 2028–2030Institutional Adoption, Scarcity, and the Devaluation of the Dollar
The question of whether Bitcoin could reach the half‑million mark within the next five to seven years is increasingly debated among investors, economists, and institutions alike. While such projections still carry uncertainty, several converging trends suggest that a $500,000 valuation for Bitcoin by 2028–2030 is within the realm of possibility. These drivers include the rapid pace of institutional adoption, Bitcoin’s fixed supply, its growing narrative as a store of value, the potential role of national reserves, and a macroeconomic backdrop defined by inflation and dollar devaluation. Additionally, the long‑term holding behavior of Bitcoin investors has reduced circulating supply, further amplifying the scarcity effect.
1. Institutional Adoption via ETFs and Beyond
The approval and growth of Bitcoin exchange-traded funds (ETFs) in major financial markets mark a watershed moment in the asset’s mainstream acceptance. These vehicles simplify access for institutional investors that were previously constrained by custody and regulatory hurdles. Pension funds, endowments, and sovereign wealth funds are now able to allocate to Bitcoin through regulated channels.
As demand from professional investors grows, the inflows through ETFs act as a continual buy‑side force. Unlike speculative retail buying sprees of previous cycles, institutional allocations are more structured and long‑term oriented, potentially anchoring a more stable demand floor. This steady absorption of supply is expected to become one of the strongest catalysts for Bitcoin price growth this decade.
2. Fixed Supply: The Scarcity Engine
Bitcoin’s most unique feature is its hard‑coded supply cap: only 21 million coins will ever exist . This mathematical certainty contrasts starkly with fiat currencies, where central banks can expand money supply indefinitely. Halving events, which reduce the block rewards of mining BTC roughly every four years, further accelerate scarcity.
By 2030 , the annual mining of Bitcoin will be minuscule compared to today, limiting fresh supply even as institutional demand scales up. In classical economic terms, a growing demand against a fixed or declining supply can only result in upward price pressure.
3. Store of Value in an Inflationary World
The past decade has demonstrated how inflation and monetary expansion distort asset markets. As governments print more money to finance debt and expenditures, investors increasingly seek hedges against the erosion of purchasing power. Historically, gold has played this role.
Bitcoin, with its transportability, divisibility, verifiability, and digital-native characteristics, is now increasingly seen as a modern alternative or complement to gold. If Bitcoin even partially captures the $13+ trillion gold market as a store of value, valuations well above $500,000 per coin become mathematically plausible.
4. Bitcoin as a Component of National Reserves
While still early, several nations are exploring or experimenting with holding Bitcoin in their reserves. For countries facing dollar dependency or geopolitical pressures, Bitcoin provides a neutral, censorship‑resistant reserve asset that reduces reliance on the U.S. financial system.
Should more governments follow El Salvador’s lead or allocate even a small percentage of their foreign reserves to Bitcoin, global reserve demand could represent a massive new buyer base. Even marginal allocations at a sovereign level would create outsized effects due to Bitcoin’s relatively small market capitalization compared to global reserves.
5. The Dollar, Inflation, and Asset Price Revaluation
The U.S. dollar, while still dominant, faces structural challenges: ballooning government debt, persistent fiscal deficits, and the need for monetary expansion to sustain growth. Increased money supply historically leads to currency debasement. As purchasing power erodes, asset prices, from equities to real estate to scarce stores of value like Bitcoin, tend to reprice higher in nominal dollar terms.
Thus, Bitcoin’s potential ascent to $500,000 is not solely about Bitcoin “going up,” but also about the dollar “going down.” In this sense, the milestone is as much a reflection of fiat devaluation as it is of Bitcoin adoption.
6. The Supply Dynamics: 80% Already Parked
On‑chain analytics highlight another critical factor: roughly 80% of Bitcoin supply is currently held by long‑term investors in “dormant” wallets, seldom moved or sold. This indicates that a large portion of the supply is illiquid, effectively taken off the market.
When institutions, retail newcomers, or governments try to acquire Bitcoin in size, they will be competing over the thin slice of supply available for trade. This dynamic creates a potential supply squeeze, which historically has been one of the key drivers of Bitcoin’s parabolic price advances.
Conclusion: A Plausible Milestone, But With Volatility Along the Way
Projecting Bitcoin to $500,000 by 2028–2030 is not simply speculation, it is a thesis grounded in identifiable trends: institutional adoption through ETFs, a mathematically capped supply, Bitcoin’s emerging status as digital gold, the potential for sovereign reserve adoption, and macroeconomic tailwinds fueled by dollar debasement.
However, it is important to note that Bitcoin’s journey will not be linear. Volatility, regulatory battles, and shifts in global macro conditions will shape the trajectory. Yet, the combination of structural scarcity and rising global demand makes the possibility of half‑a‑million per coin a credible long‑term scenario.
#crypto #bitcoin #finance #defi #economy #portfolio #digital #blockchain #trading #asset

EURAUD BUYEURAUD just swept liquidity and tapped into the H4 FVG zone, giving us a potential long bias.
After confirming the higher-timeframe setup, we zoomed into H1 where a clear CHoCH appeared.
Now I’ll be looking for a long entry if price retraces lower into my area of interest.
Let’s see how this plays out—stay tuned! 🚀

$DXY: Dollar Strength or Dollar Dip?(1/9)
Good afternoon, everyone! 🌞 DXY: Dollar Strength or Dollar Dip?
With the DXY at 103.732, is the dollar flexing its muscles or ready to stumble? Let’s break it down! 🔍
(2/9) – PRICE PERFORMANCE 📊
• Current Price: 103.732 as of Mar 14, 2025 💰
• Recent Move: Near recent levels, down from 110.18 peak (web data) 📏
• Sector Trend: Forex markets volatile, with trade and policy shifts 🌟
It’s a wild ride—dollar’s dancing on the edge! ⚙️
(3/9) – MARKET POSITION 📈
• Role: Measures USD vs. euro, yen, pound, and more 🏆
• Influence: Drives forex and commodity prices globally ⏰
• Trend: Balancing U.S. policy and global demand, per data 🎯
King of currencies, but not without challengers! 🚀
(4/9) – KEY DEVELOPMENTS 🔑
• Trade Tensions: U.S.-China tariff talks ongoing, per data 🌍
• Rate Cut Bets: Markets eyeing Fed moves, per posts on X 📋
• Market Reaction: Holding steady at 103.732 amid mixed signals 💡
Navigating a storm of global pressures! 🛳️
(5/9) – RISKS IN FOCUS ⚡
• Rate Cuts: Could weaken dollar if Fed acts, per X sentiment 🔍
• Trade Wars: Tariffs disrupting supply chains, per data 📉
• Global Growth: Slowdowns hitting demand for USD ❄️
It’s a tightrope—risks aplenty! 🛑
(6/9) – SWOT: STRENGTHS 💪
• Reserve Status: USD’s global dominance holds firm 🥇
• U.S. Economy: Still a powerhouse, supporting dollar value 📊
• Safe Haven: Attracts flows in uncertain times, per trends 🔧
Got muscle to flex when it counts! 🏦
(7/9) – SWOT: WEAKNESSES & OPPORTUNITIES ⚖️
• Weaknesses: Vulnerable to rate cuts, trade spats 📉
• Opportunities: Strong U.S. data could lift it higher, per outlook 📈
Can it hold the line or break out? 🤔
(8/9) – POLL TIME! 📢
DXY at 103.732—your take? 🗳️
• Bullish: 105+ soon, dollar rallies 🐂
• Neutral: Steady, risks balance out ⚖️
• Bearish: 100 looms, dollar dips 🐻
Chime in below! 👇
(9/9) – FINAL TAKEAWAY 🎯
The DXY’s 103.732 shows it’s steady but tested 📈. Trade wars and Fed moves could swing it either way—dips are our DCA gold 💰. Buy low, ride high—time’s the key! Gem or bust?
