ETHUSDT (15M) –Triangle Squeeze, Breakout Incoming|SEEMS STRONG?BITSTAMP:ETHUSD
Structure | Trend | Key Reaction Zones
ETH is compressing inside a triangle formation 🔺, with price stalling near the breakout decision level ⚡. Liquidity grabs and fakeouts show indecision, while demand around 4338–4263 🟢 remains critical support. Major resistance stands firm at 4451 🔴.
Market Overview
After a liquidity wick rejection, ETH is coiling tighter, waiting for confirmation. Buyers are defending the demand zone, but momentum is capped by overhead resistance. A clean breakout will define the next directional move. Sentiment remains neutral-to-bullish unless the critical demand fails.
Key Scenarios
✅ Bullish Case 🚀 → Breakout above 4360–4380
🎯 Target 1: 4451
🎯 Target 2: 4516
❌ Bearish Case 📉 → Breakdown below 4338–4320
🎯 Downside Target 1: 4263
🎯 Downside Target 2: 4258
Current Levels to Watch
🔴 Resistance: 4380 → 4451 → 4516
🟢 Support: 4338 → 4263
⚠️ Disclaimer: This analysis is for educational purposes only, not financial advice.
Flag

#BTCEUR #1D (Binance) Bull-flag breakout and retestBitcoin looks very good for bullish continuation after regaining 50MA support on daily, against the Euro.
⚡️⚡️ #BTC/EUR ⚡️⚡️
Exchanges: Binance
Signal Type: Regular (Long)
Amount: 12.0%
Entry Targets:
1) 93017.86
Take-Profit Targets:
1) 108422.28
Stop Targets:
1) 85296.36
Published By: @Zblaba
CRYPTOCAP:BTC BINANCE:BTCEUR #Bitcoin #PoW bitcoin.org
Risk/Reward= 1:2.0
Expected Profit= +16.6%
Possible Loss= -8.3%
Estimated Gaintime= 1-2 months

VIOLENT BOS on SILVER takes place! HOW FAR it goes this time?!?This is where momentum strategys eventually lead to...

Gold-Bullish Reversal from Falling Wedge(Bull Flag Continuation)Price has bounced strongly from the support zone with two solid bullish 4H candles, confirming a potential reversal.
The structure shows a falling wedge after a strong bullish leg, often acting as a bull flag continuation pattern.
📌 Key Levels:
Support: 3310 – 3320
Resistance 1: 3350 – 3360 (first breakout test)
Resistance 2: 3375 (key resistance / PRZ)
Resistance 3: 3400 (measured move target)
Resistance 4: 3470 (channel top)
⚡ Scenarios:
Bullish: A breakout and close above 3350–3360, followed by 3375, opens the path toward 3400 and potentially 3470.
Bearish (invalid): A drop back below 3310 could extend the downside toward 3280.

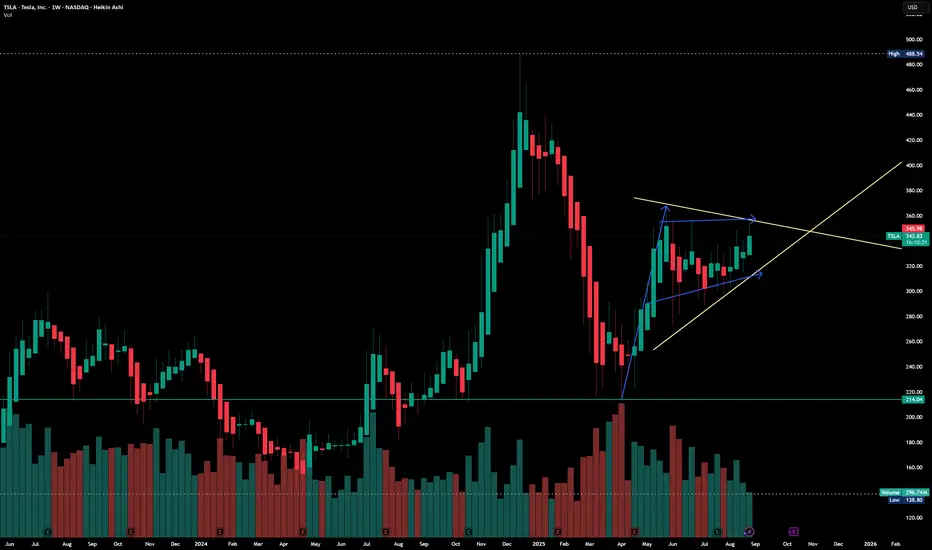
Tesla : A Symmetrical Triangle and Bullish Flag formation Disclaimer : Do your own research before investing. This is just a chart analysis. No recommendation to buy and sell.
Tesla company does not require any Introduction, Market leader in tech innovation.
Charts of Tesla is looking interesting where A Symmetrical Triangle and Bullish Flag formation is getting in place.
Tesla is having support around $300 mark and higher side is $488. will it regain that level again. Not one know about it. However, its getting in consolidation.
Current price of Tesla is $345 and one can look to $370 for near term.
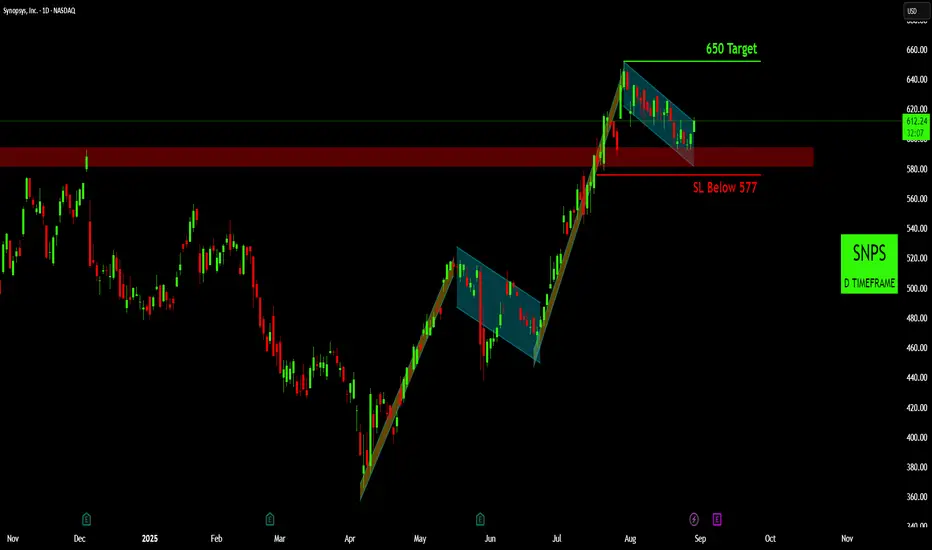
Synopsys (SNPS): Ready to Rally Again After a Brief Pause
Strong Climb, Then a "Breather" : SNPS has been going up very strongly since April. The Pattern clearly displays bull flag continuation patterns, with price consolidating in downward-sloping channels before breaking out to the upside.
Current Pause Ending: After its big jump in July, the stock entered another one of these "pauses," moving gently downwards in a channel. It stayed above a key support area, which is a good sign. Now, it looks like it's breaking out of this pause, suggesting the climb is about to resume.
Next Stop 650: If the stock continues its upward momentum, my next target for the price is 650.
Risk Management: To limit potential losses, I would exit the trade if the price falls below 577. This level acts as safety net.
Disclaimer:
The information provided in this chart is for educational and informational purposes only and should not be considered as investment advice. Trading and investing involve substantial risk and are not suitable for every investor. You should carefully consider your financial situation and consult with a financial advisor before making any investment decisions. The creator of this chart does not guarantee any specific outcome or profit and is not responsible for any losses incurred as a result of using this information. Past performance is not indicative of future results. Use this information at your own risk. This chart has been created for my own improvement in Trading and Investment Analysis. Please do your own analysis before any investments.
SILVER (XAGUSD): Classic Trend-Following Setup
I see a very classic bullish model on Silver:
after a strong bullish wave, the market started to correct
within a bullish flag pattern.
Its resistance breakout always provides a reliable confirmation to buy.
I expect a rise to 39,16 now.
❤️Please, support my work with like, thank you!❤️
I am part of Trade Nation's Influencer program and receive a monthly fee for using their TradingView charts in my analysis.

XRP to $5.50XRP is in its 5th wave, and based on this weekly bull flag, it could reach $5.50 after breaking the resistance line.

QXO Breaking out of bull flagQXO breaking bull flag formation with above average volume. Just had great earnings and the industrials sector is the third best performing sector over the last six months.
Entering 22C 21Nov25
S/L Break below 20.70

TSLA (swingtrade) Bull flag1. Pattern : Bull flag breakout
2. retest: done
3. sma 50 on hold in D1,W
* could fake break out alway stoploss

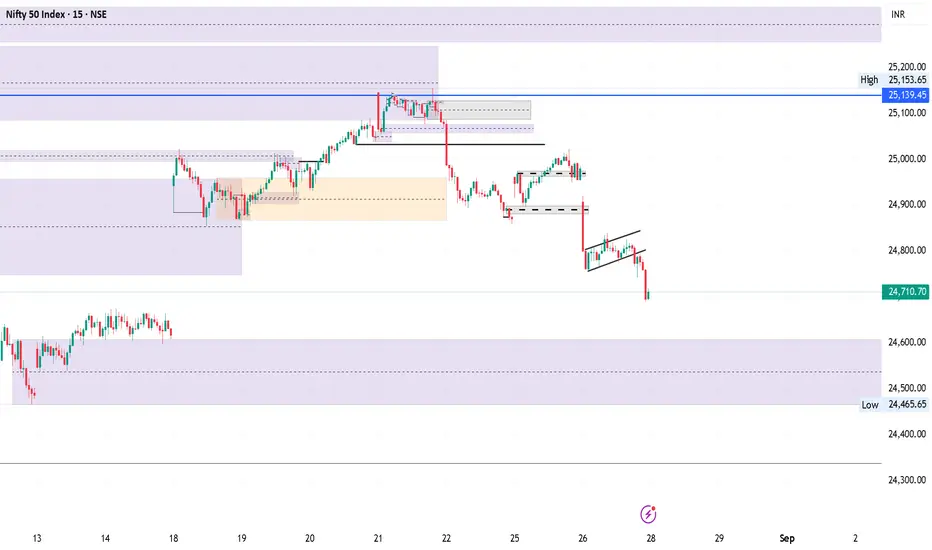
Why is Nifty50 Falling? | Technical OutlookBackground:
On 30th June, Nifty50 made a high of 25,699.35. From that point, the index entered a bearish trend, which extended down to the recent low of 24,337.50. This low marked a Break of Structure (BoS), signaling that a pullback phase was likely to follow.
-----------------------------------------------------------------------------------------------------------------
Pullback Phase:
The pullback began on 11th August, when price failed to break below the previous low and started forming higher highs (HH) and higher lows (HL).
If we plot a Fibonacci retracement from 30th June (high) to 11th August (low), the 0.618 (golden ratio) comes in around 25,139.45.
-----------------------------------------------------------------------------------------------------------------
Price Action:
On 14th August, the market opened with a gap up, likely leaving some unfilled buy orders behind. This gap also opened within the supply premium zone around the golden fib level.
Since then, the price has reversed to the downside, forming lower lows (LL) and lower highs (LH) aligning with the higher time frame bearish trend.
------------------------------------------------------------------------------------------------------------------
Key Levels to Watch:
24,600 – 24,465: Important POI (Point of Interest) for buyers.
24,337.50: A crucial structural level. If this level holds and price begins to form HH and HL again, it can be considered a strong low for buyers.
-------------------------------------------------------------------------------------------------------------------
Chart Patterns (15m timeframe):
Head & Shoulders formation.
Bear Flag pattern.
------------------------------------------------------------------------------------------------------------------
Additionally, Gift Nifty is already showing signs of weakness near 24,600. With markets closed tomorrow for the festive holiday, Thursday could potentially open with a gap down.
ETHUSD🔎 Chart Setup
ETH/USD 1H → Bearish flag = continuation pattern AB=CD
ETH Dominance (D) → Also breaking flag = confirms weakness in ETH vs other alts/majors
📊 Trade Plan
⚠️ Manage risk strictly (crypto volatility is brutal):
Entry: On breakdown retest of the flag support line 🟥
Stop Loss (SL): Just above flag resistance
rofit (TP):
🎯 TP1 (1:1 RR) → Secure partial profits (50% book)
🎯 TP2 (1:2 RR) → Let rest run, trail SL
💡 Risk Management
Max 1%–2% account risk per trade ⚖️
Always use hard stop, don’t widen 🚫
Partial booking keeps you safe + confident 🛡️


SUDARSHANCHEMSUDARSHANCHEM showing very good strength and consolidating since a month near ATH. Result is expected tomorrow on 25-Aug. If it declares bumper result then we may see next leg of steep rally. In recent time accumulation has been observed. Provided that if it closes above 1380 level then one may get very good risk-reward trade from hereon. Keep a stock in watch list. Just a small volume may push it above resistance line.

Bullish Flag Pattern Zora has formed a bullish flag pattern and can climb as high as the flag's length.


UNI UPDATE (4H)After completing a five-wave impulsive move to the upside, UNI now appears to have entered a corrective A–B–C pattern.
Additionally, a head and shoulders formation has already broken down and been retested, further confirming bearish momentum. All signals currently point toward a downward continuation.
On the 15-minute timeframe, a mini bear flag has also formed, which strengthens this bearish outlook.
Good Luck.

PSX: Haleon - Weekly TF - Long positionContinuation pattern for Haleon
Long position.
Important note:
If the medicine prices are regulated by the government again, this could have -ve impact and hamper the continuation.

XAUUSD (Gold) – 4H Outlook | CAN BE BULLISH?Structure | Trend | Key Reaction Zones
Price broke out of a falling wedge pattern 🔻➡️🚀.
Retested the 3330 support zone ✅ and surged strongly.
Now hovering around 3375, testing previous breakdown structure.
Market Overview
📈 Bullish Case → If 3375 holds, momentum could extend higher:
🎯 Target 1: 3385
🎯 Target 2: 3409
📉 Bearish Case → If rejected near 3375/3380, possible pullback:
🎯 Target 1: 3358
🎯 Target 2: 3351
Current Levels to Watch
Resistance: 3375 – 3409 ❌
Support: 3358 – 3351 ✅
Disclaimer
This analysis is for educational and informational purposes only. It is not financial advice. Please conduct your own research before trading.

EURGBPBairish momentum Changed into bullsih trend, Bullish Flag pattern found in EURGBP chart, which looks like bullish, expected entry point and stop loss mention with TP.

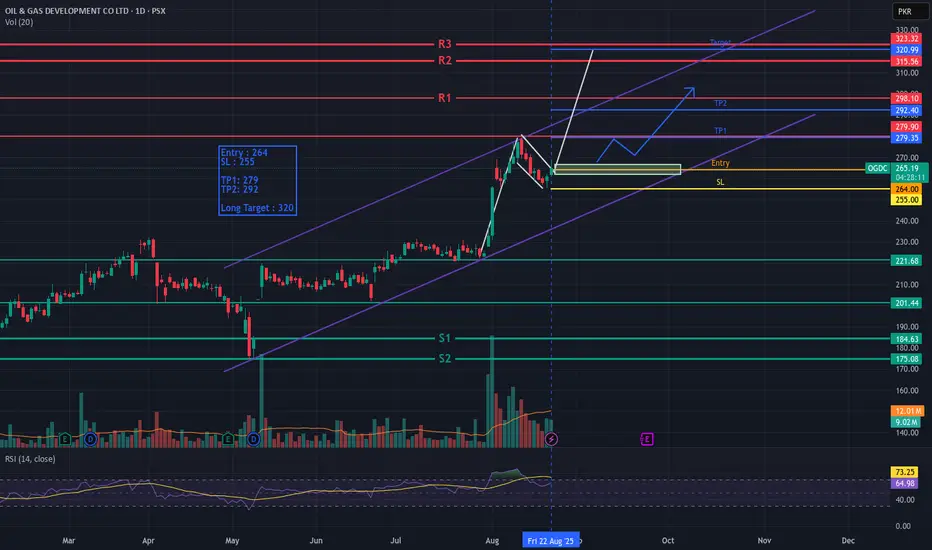
OGDC – Bullish Flag Breakout SetupOGDC has formed a Bullish Flag pattern, indicating potential continuation of the uptrend. The stock is showing strength and is likely to resume its upward momentum.
📌 Trade Setup:
Entry: 264
Stop Loss: 255
Target 1: 279
Target 2: 292
Long-term Target: 320
Risk management is key – position sizing should be adjusted according to individual risk appetite.
This setup is based on technical analysis and is not financial advice. Please do your own research before making trading decisions.
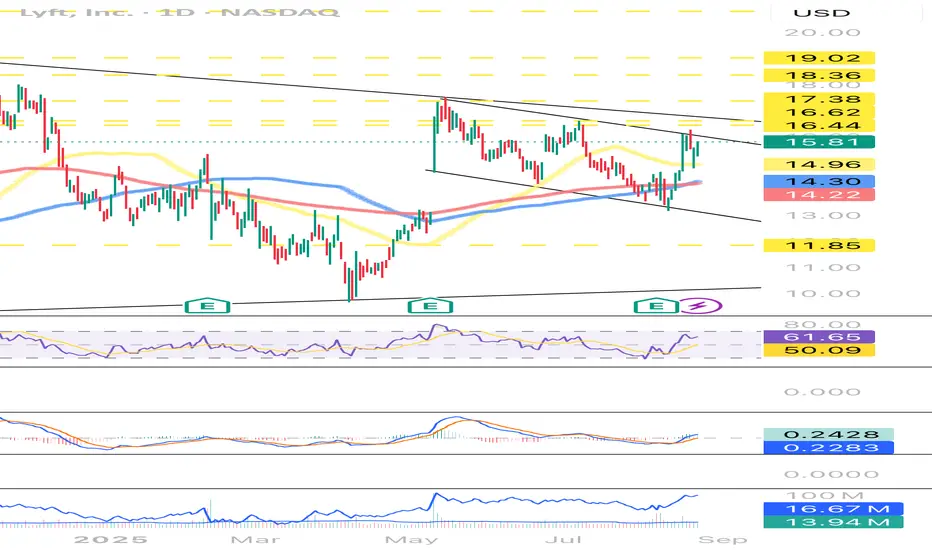
LYFT May Be Ready for a Bullish Breakout
Lift is currently sitting above the 50, 100, and 200 moving averages.
It just filled the gap it left from May earnings and since then it’s been consolidating while forming a bull flag pattern.
RSI is also trending higher but just crossed 60 leaving it room to run and MACD line has also crossed the signal line.
OBV has returned to its May levels and average volume has begun to rise a bit over the last couple of weeks potentially due to to the founders announcing they’re stepping away in Feb2025.
Until there’s a major change in buying sentiment for Lyft it’ll probably keep consolidating. Just needs some good news. Maybe those two founders stepping away could be the start.