Bear Flag BreakdownHIMS has been trading inside a bear flag / rising wedge structure following a strong downside move. The recent candles show a clean breakdown beneath the lower trendline, signaling the pattern may be completing and momentum could continue lower.
Flag

What's up with Nokia? Bullish PredictionNYSE:NOK
Nokia is predicted to continue the positive market response confirmed by bullish flag pattern.
If the analysis is relevant, Nokia should be hit on target $8.70 at the end of January 2026

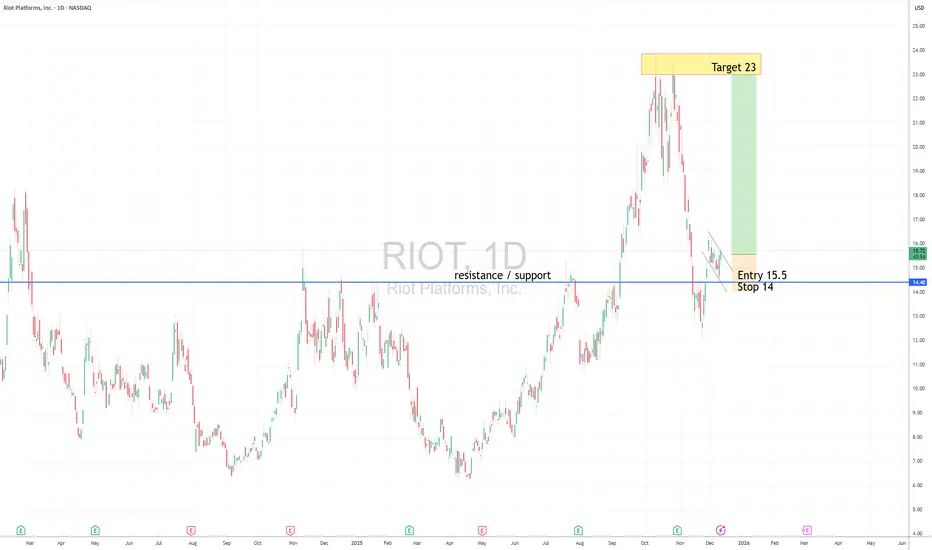
RIOT LongFlag pattern in Uptrend, Near support line
Long entry 15.5
Stop 14
Target 23
Risk management is much more important than a good entry point.
I am not a PRO trader.
In my trading plan, the Max Risk of each short term trade should be less than 1% of an account.
Nasdaq December Rally starting?Institutionals have been leaving some traces of what its about to happen. Are we ready to surf the wave?
What if it doesn't wave and it was all a bear trap?
Stay tuned!

EURJPY: Uptrend Continues 🇪🇺🇯🇵
EURJPY finally completed a bullish accumulation
and broke a resistance of a horizontal range yesterday.
The market will most likely continue rising.
Next resistance - 183.0
❤️Please, support my work with like, thank you!❤️
I am part of Trade Nation's Influencer program and receive a monthly fee for using their TradingView charts in my analysis.

Alert: Bitcoin Price Charts Bear Flag Bitcoin follows the downward path posted earlier on the weekly chart (see related)
The falling knife accelerated after price broke below $100k as it swiftly hit the 80k level and stopped there just ahead of the next viable support at $74k
The price is now within a pink downtrend channel as RSI turned bearish below the 50 reading
Every strong move is followed by corrective price action
So the price bounced off the $80k and is now in a sideways consolidation
This is how the Bear Flag pattern has formed (white lines)
I think one more minor leg up is likely to complete the corrective structure
Watch for a breakdown of the flag’s downside to target the distance of the flagpole below
This aligns with both the downside of the descending channel and the $64k strong support
As I checked, MicroStrategy’s (MSTR) BTC cost basis is around $66k
Watch RSI as it should remain bearish below 50 to support the drop

USDJPYUSDJPY is bullish momentum while moving in a parallel channel. RSI divergence formed at 4H and 1H which pushes the price from fib lvl 0.382 back in the channel confirm the upward momentum. Flag pattern making is in progress. Holidays in US will impact the price and most probably it will go side ways after mid of Dec but rate cut is expected in coming week. Will see some upward momentum, as DXY has almost absorbed the expected rate cut and RSI divergence is playing at 4H

EURCHF new bullish expected
OANDA:EURCHF trend based analysis, we are have strong bullish push, currently price in BULLISH FLAG pattern, from here expecting new bullish push
SUP zone: 0.93100
RES zone: 0.93950, 0.94150

GBP/USD: Very Bullish PatternThe GBPUSD pair is currently trading in a long term bullish trend.
Earlier this month, the market established a new higher high, subsequently initiating a corrective movement.
A bullish flag pattern has formed, within which a minor bearish trend has been established.
Yesterday, the pair began to appreciate, with buyers successfully violating the resistance level of the flag.
This development may potentially instigate a trend-following movement.
The next objective is 1.3385.

AUDCHF: Bullish More After Breakout 🇦🇺🇨🇭
AUDCHF broke and closed above a key daily horizontal resistance.
Retesting a broken structure, the price formed a bullish flag pattern.
A breakout of its resistance line is a strong confirmation.
It indicates a highly probable movement up to 0.5656 level.
❤️Please, support my work with like, thank you!❤️
I am part of Trade Nation's Influencer program and receive a monthly fee for using their TradingView charts in my analysis.

NFLX: Flag Forming as Market Awaits Clarity on Warner Bros DealNetflix has broken into a wider flag structure as the market digests the recent announcement of its planned acquisition of Warner Bros. Discovery. The initial move lower reflects uncertainty rather than a judgment on long-term value — which is exactly what you typically see in the early stages of large M&A.
For now, we’re waiting for regulatory clarity.
Until there’s a credible signal that the deal is likely to be approved, the market will continue to price in an uncertainty discount.
If regulators turn less hostile, the next key stage is financing clarity.
This is where Netflix will need to show:
how the transaction will be funded (debt vs. equity split),
the impact on leverage and credit profile,
the expected paydown path,
how the combined entity affects forward margins and cash flow.
Once the market understands the financing structure, the major unknowns disappear — and that’s typically when investors begin front-running the upside of the deal.
We could then see a rerating back toward major levels such as $124, and potentially even a retest of the previous all-time highs near $133, if the narrative shifts from “uncertainty” to “strategic value creation.”
For now, the flag is setting up — but confirmation will only come once those fundamental catalysts begin to de-risk.

Silver and Gold Flag and Pole PatternBoth Silver and Gold are forming Flag and pole pattern on charts. If the breakout sustains and prices go higher with support of relatively higher volumes, both commodities can achieve higher prices in near term. The momentum is currently on bulls side in both commodities but silver has more relative strength than gold. So watch both commodities for breakout.

BullsHaving closed above the weekly resistance we await complition of the pullback before we have another go at the buys. This will be targetting the 71% retracement region on the daily chart.

Bitcoin Pumps +10% — Bull Trap or Trend Reversal?Bitcoin( BINANCE:BTCUSDT ) has experienced over a +10% increase in the past two days, which came as a surprise to many analysts considering the previous bearish momentum. In other words, Bitcoin is on something of a roller coaster lately😂.
The question now is whether Bitcoin has started a new bullish trend or if it’s likely to see another decline.
Let’s dive into the 4-hour chart of Bitcoin. Currently, Bitcoin is approaching a resistance zone($94,850-$93,000), a Cumulative Short Liquidation Leverage($94,710-$94,063), and the monthly pivot point. This cluster of resistances, combined with the recent upward momentum, might make it challenging for Bitcoin to break through.
It’s also worth noting that the trading volume during this recent rally hasn’t been particularly high, so Bitcoin could still surprise us. This recent behavior shows that Bitcoin can move sharply both up and down, so it’s crucial to maintain proper risk management.
From an Elliott Wave perspective, considering Bitcoin’s recent decline, I initially expected that Bitcoin might at least test the low of its main wave 3 again. However, the recent rebound suggests that the main wave 5 may be truncated, and the corrective waves could still push Bitcoin lower, potentially even below $75,000.
From a classical technical analysis perspective, Bitcoin might be forming a bearish flag pattern, with the ascending channel acting as the flag’s pole.
In addition, the USDT.D%( CRYPTOCAP:USDT.D ) is still on an upward trend, which indicates that the cryptocurrency market might still face downward pressure.
Moreover, geopolitical tensions, such as those between the U.S. and Venezuela, could also act as a trigger for further Bitcoin declines if they escalate.
Lastly, the S&P 500 index( SP:SPX ), despite its recent bullish trend, doesn’t show the same positive correlation with Bitcoin. In fact, a decline in the S&P 500 could amplify Bitcoin’s downward movement.
Considering all these factors, I expect Bitcoin to continue its bearish trend and potentially test the heavy support zone. If these support levels break, we could see even more significant declines in the crypto market.
Based on the above explanation, I expect Bitcoin to have at least a correction to the targets I specified on the chart, and then depending on the momentum, we can expect a continuation of the decline or a resurgence.
Note: In general, with the opening of the US markets, financial market movements have become more intense these days than before, and it is better to be prepared for any scenario at that time.
What do you think? Do you believe Bitcoin will dip below $75,000, or will it bounce back?
Cumulative Short Liquidation Leverage: $98,591-$96,688
Cumulative Long Liquidation Leverage: $91,860-$90,960
Stop Loss(SL): $96,200
Points may shift as the market evolves
💡 Please respect each other's opinions and express agreement or disagreement politely.
📌Bitcoin Analysis (BTCUSDT), 4-hour time frame.
🛑 Always set a Stop Loss(SL) for every position you open.
✅ This is just my idea; I’d love to see your thoughts too!
🔥 If you find it helpful, please BOOST this post and share it with your friends.

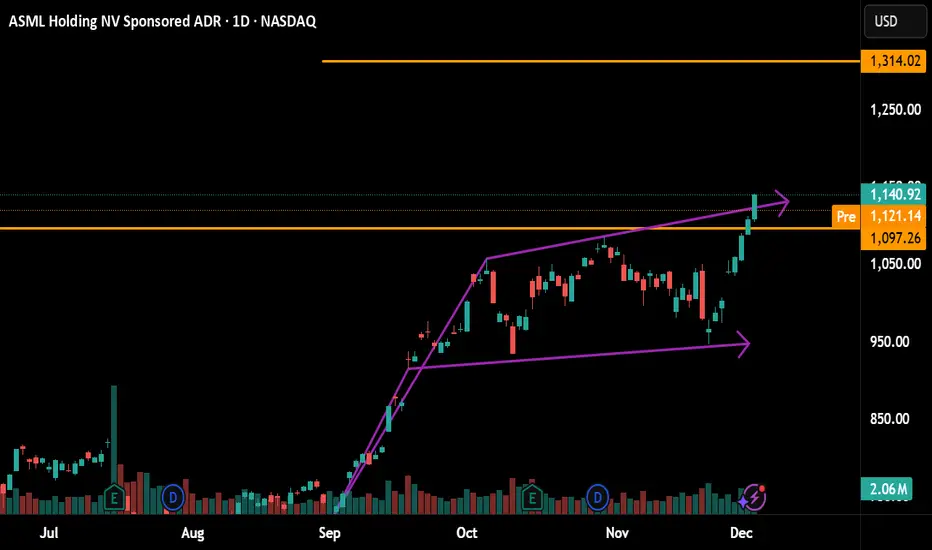
ASML : Flag Bullish Pattern activatedUpside Target 1314
cmp: 1140.92
SL: 929.
Risk Reward is not favorable so, decline is as strong opportunity 1000 around.
Manage Your Risk
Flag Bullish Pattern Breakout done
BIDU: 97 Key LevelGood investment opportunity,
If It will be sustained 97 level,
Target upside 179
SL Below 97
Good Risk to Reward Ratio.
And Flag Bullish Pattern also.

TSM :Thanks So Much : (295.45 = 400) Opportunity by Flag BullishFlag Bullish Pattern. Investment.
cmp : 295.45
Waiting for breakout.
Accumulate before stop Loss: 260.
Target : 400
Manage your Risk ..

MarketBreakdown | USDJPY, EURCAD, Dollar Index, US30
Here are the updates & outlook for multiple instruments in my watch list.
1️⃣ #USDJPY daily time frame 🇺🇸🇯🇵
Correctional movement continues.
The price now formed a falling parallel channel - a bullish flag.
A bullish breakout of its resistance and a daily candle close above
will confirm a completion of a correction and a resumption
of a long-term uptrend.
2️⃣ #EURCAD daily time frame 🇪🇺🇨🇦
The market is in a deep consolidation.
The price is stuck within a wide horizontal range on a daily
for more than a month.
We can expect a bullish continuation to a resistance of the range.
A bearish movement will most likely follow from that.
3️⃣ Dollar Index #DXY daily time frame $
The market reached a significant daily horizontal support cluster.
Due to its historic importance, there is a high probability
to see a pullback from that.
4️⃣ DOW Jones Index US30 daily time frame
The market continues coiling alongside a recently broken
trend line that turned into a strong vertical resistance now.
There is a high probability that we will see a stronger retracement
from that and a bearish movement.
Do you agree with my market breakdown?
❤️Please, support my work with like, thank you!❤️
I am part of Trade Nation's Influencer program and receive a monthly fee for using their TradingView charts in my analysis.


AUDUSDCup formation complete-handle formation to be waited. Divergence confirmed at 1H timeframe which make a expected retracement at fib retracement lvl of 0.368.
Order can be put with tight SL at top of cup or trade can be executed at smaller timeframe.
Will wait for proper cup&handle formation for the execution of long trade at top of cup/pole of flag

The #1 Indicator For Stop LossesOne time I had to defend myself
because a person I thought was my friend
approached when he was drunk.
I recently just had eye surgery so
I told him about it..
for some odd reason, he thought
he could take advantage of me.
I then defended myself.
He tried again when he was drunk
I then walked away from him
But I give him a "middle finger"
in words..
He retaliated and came back with a gang
and with
insults.
I didn't hear him because
I was on the phone talking to a girl
that I dig...lol!
Today I saw him a distance
and I recognised his walk.
Then he saw me and walked away instantly
Keep in mind this was at a distance.
while he was sober..
He didn't want that smoke.
He knew once he get that smoke
with me.He's gonna shiver in
his little baby boy pants.
The point am trying to make to you
is that it takes time to master something
and as we journey
together on this trading.
I need you to be patient
and learn not only
from my mistakes
but also from yours
am now the O.G I used to look up
to.
On this chart, I have used the
parabolic
to set my stop loss and buy stop
order
And so far I think its a good trade.
A good Buy trade
plus, sentiment is very strong.
its perfect- I think
it will turn out well.
Trade safely out there.
Rocket boost this content to learn more
Disclaimer: Trading is risky. Please use risk management
and profit taking
strategies
Also feel free to use a simulation trading account
before you trade with real money.

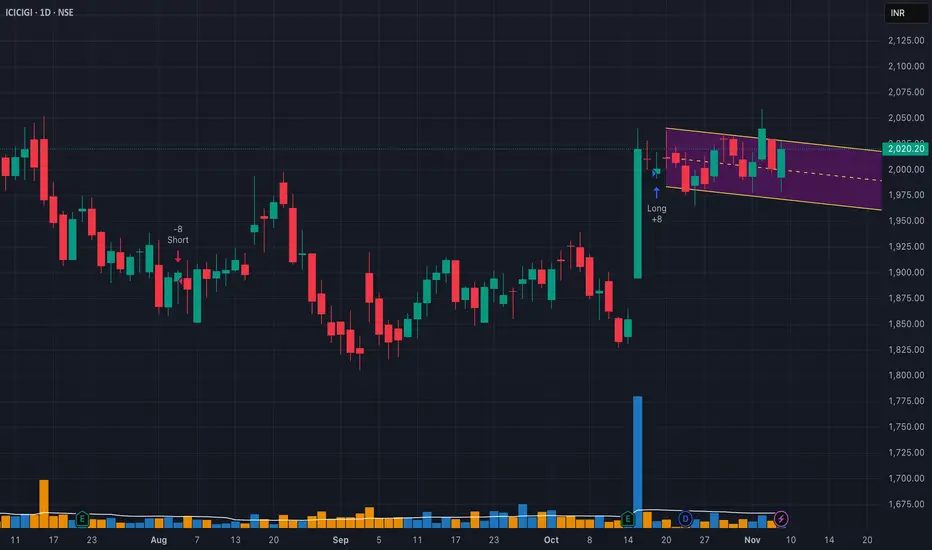
ICICI Lombard Signalling Flag PatternObserved Volume breakout on 15 th October.
Now consolidating in a channel.
Showing an Pole and Flag Pattern.
Entry above on Channel Breakout.
SL below Channel
Target 2080/2250
$RDDT – Larger Head & Shoulders + Bear Flag = Trouble AheadReddit ( NYSE:RDDT ) is showing a bigger-picture head & shoulders pattern combined with a near-term bear flag, and the downside risk is real if the market continues to weaken — especially if NASDAQ:NVDA disappoints on earnings.
🔹 The Bigger Structure:
Head: The peak around $280
Right Shoulder: Forming around $230
This entire pattern is stretched over months — a structural topping pattern with heavy implications.
🔹 Near-Term Structure:
Between $180–$190, NYSE:RDDT is building a tight bear flag.
This is exactly the kind of setup that resolves to the downside when market sentiment turns.
🔹 Downside Levels:
First real support sits around $202, and that’s where sellers likely target first.
A breakdown of the flag could send it there quickly, especially in a risk-off tape.
🔹 Macro Risk:
If NASDAQ:NVDA misses earnings, this market is sitting on a cliff.
Momentum names and high-beta IPOs like NYSE:RDDT tend to get hit the hardest when liquidity dries up.
Combine macro weakness + a topping pattern + a bear flag… and you have a real setup for further downside.
🔹 My Trade View:
1️⃣ Bias: Bearish while under the 9 EMA.
2️⃣ Trigger: Breakdown under the bear flag ($180–$190 zone).
3️⃣ Target: $202 first, and potentially lower depending on market conditions.
4️⃣ Stop: Above the flag highs / 9 EMA.
Why This Matters:
You don’t often see a multi-month topping pattern line up cleanly with a short-term continuation short setup.
NYSE:RDDT has room to fall if the broader market unwinds.
This is one of the cleanest momentum breakdown candidates on the board.
