$IREN – First 20 SMA Retest + Flag Breakout SetupIris Energy ( NASDAQ:IREN ) is setting up a powerful flag breakout after its first real pullback of this entire move — and it’s happening right as crypto momentum heats up again.
🔹 The Setup:
After a strong rally from $50 → $75, NASDAQ:IREN pulled back in a controlled, low-volume correction.
Price undercut the 20 SMA, quickly reclaimed it, and now sits back above the 9 EMA — a perfect base reset.
Tight flag pattern forming, primed for expansion once momentum kicks in.
🔹 Crypto Sector Strength:
CRYPTOCAP:BTC and CRYPTOCAP:ETH both popped this weekend — that’s classic risk-on behavior.
The entire crypto stock basket is running hot, with leaders like NASDAQ:CIFR and NASDAQ:IREN showing clean technical setups.
This is the first 20 SMA test of the move — historically the most powerful retest in trending names, as late buyers finally get their chance to enter.
🔹 My Trade Plan:
1️⃣ Entry Zone: Watching dips Monday or Tuesday to build a position near the 9 EMA / 20 SMA zone.
2️⃣ If It Gaps Up: I’ll skip swing entries and just day trade the strength — no chasing.
3️⃣ Stop: Below the 20 SMA — tight, logical risk level.
Why I Like This Setup:
First 20 SMA test after a big run = high probability continuation.
Crypto momentum is back — strong sector correlation.
Technical structure is perfect: shallow pullback, rising EMAs, and a clear trigger.
Flag

SELL XAUUSDXAUUSD (4H Analysis)
After the recent drop on the 4-hour timeframe, the price has formed a rectangle (range) pattern.
If the support of the pattern breaks, we could see a continuation of the bearish move toward lower levels.
However, if the resistance breaks, a short-term bullish correction might occur.

Rgti bull flag Drew this on my phone and I hate that this likely plays out. How is this garbage stock still pumping on zero fundamentals? Anyhow my bet is it pumps very hard into end of year.

$TAO 1hGETTEX:TAO 1H
Beautiful falling channel breakout forming right at key support with clear upside targets (T1–T3).
If CRYPTOCAP:BTC stays stable and continues to perform well, this setup could easily push higher toward resistance. 📈

DIS | A Possible Bull Flag On Disney | LONGThe Walt Disney Co. engages in the business of international family entertainment and media enterprise. It owns and operates television and radio production, distribution and broadcasting stations, direct-to-consumer services, amusement parks, and hotels. It operates through the following business segments: Disney Entertainment, ESPN, and Disney Parks, Experiences, and Products. The company was founded by Walter Elias Disney on October 16, 1923 and is headquartered in Burbank, CA.

NZDUSD: Bearish Trend Continues! 🇺🇸🇳🇿
NZDUSD will most likely continue falling next week,
following a confirmed breakout of a support line of a bearish flag pattern
on a daily time frame.
I will expect a bearish continuation at least to 0.5685 level.
❤️Please, support my work with like, thank you!❤️
I am part of Trade Nation's Influencer program and receive a monthly fee for using their TradingView charts in my analysis.

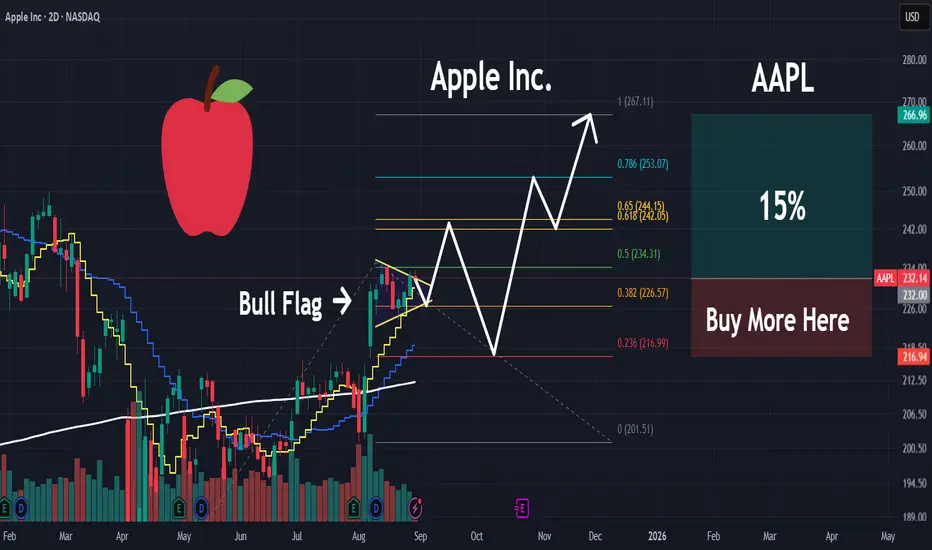
AAPL | Money will Rotate into this MEGA CAP | LONGApple, Inc. engages in the design, manufacture, and sale of smartphones, personal computers, tablets, wearables and accessories, and other varieties of related services. It operates through the following geographical segments: Americas, Europe, Greater China, Japan, and Rest of Asia Pacific. The Americas segment includes North and South America. The Europe segment consists of European countries, as well as India, the Middle East, and Africa. The Greater China segment comprises China, Hong Kong, and Taiwan. The Rest of Asia Pacific segment includes Australia and Asian countries. Its products and services include iPhone, Mac, iPad, AirPods, Apple TV, Apple Watch, Beats products, AppleCare, iCloud, digital content stores, streaming, and licensing services. The company was founded by Steven Paul Jobs, Ronald Gerald Wayne, and Stephen G. Wozniak in April 1976 and is headquartered in Cupertino, CA.
OPEN 1D - Flag Ready for Takeoff?On the daily chart, Opendoor Technologies (OPEN) is forming a clean bullish flag - a consolidation phase following a massive +400% rally since spring 2025. Price action remains tightly contained within the pattern, with strong support from the MA50 and the 6.3–7.4 buy zone, aligning with the 0.618 Fibonacci retracement.
Technically , the setup looks mature: MA50 is trending upward, MA200 sits far below, and volume contraction hints at a breakout ahead. The first target sits at $16.50 (1.618 extension), while the second target lies at $25.60 (2.618 extension) - a potential +200% move from current levels.
Fundamentally, Opendoor is finally emerging from its downturn:
– +37% YoY growth in property transactions;
– operating costs reduced by ~25%;
– positive operating cash flow for the first time in three years;
– partnerships with Zillow and Redfin driving stronger customer acquisition.
With the U.S. housing market showing signs of recovery and potential Fed rate cuts on the horizon, OPEN stands out as a high-upside play in the proptech sector.
Tactical plan: watch for accumulation near 6.3–7.4, add on breakout confirmation. Profit targets: 16.5 → 25.6.
After all, in both trading and real estate - it’s all about timing and location.

AUDCHF: Intraday Bullish Signal 🇦🇺🇨🇭
Quick update for AUDCHF.
Earlier, we spotted a confirmed breakout of a key
daily horizontal resistance.
Retesting the broken structure, the price successfully
violated a resistance line of a falling parallel channel on an hourly time frame.
It suggests a strong buying interest.
We can expect a move up now at least to 0.5264
❤️Please, support my work with like, thank you!❤️
I am part of Trade Nation's Influencer program and receive a monthly fee for using their TradingView charts in my analysis.

What would be the potential?Lookin a the possible bullish flag set up with 510-65% gain potential in the next 4 months!
DOLLAR INDEX (DXY): Confirmed Bullish ContinuationThe DOLLAR INDEX appears to be showing bullish tendencies from both daily and intraday perspectives.
From a daily timeframe, I observe a confirmed breakout of a resistance line within a symmetrical triangle pattern, indicating a trend violation and continuation.
On an hourly timeframe, we see a breakout of a resistance line of a bullish flag pattern, followed by a strong bullish movement.
I anticipate that the market will continue to grow.
The next resistance level is identified at 99.53.

CVX - Potential Swing Upside - Mid TermTimeline - now to 3 months
1. Bullish flag pattern sustained, form during Oct 2021.
2. Rounding bottom above 1D resistance at $130
- Last close is above Fib 88.6% - $154.36
- In the 2 days, weak selling pressure is noticed.
3. More attempts to break 88.6% Fib level opposed to $130 support line
- Bullish angle upthrust stays above 45 degrees
- Concludes high change of breaking 88.6% fib level, towards previous high of $169.66
3. Entry points
EP 1 - buy spot with 1 or 0.5 size
EP 2 - Enter another 1 or 0.5 size if closing prices stay above Fib 78.6% at $141.56

Flag Pattern in Sky Gold and Diamonds LimitedBuy above 376 SL 333
Target : 689-712
CMP 362 @ Oct 30, 2025
Chart by Sandeep Rehlan
Disclaimer: Sharing my personal market view — only for educational purpose not financial advice.

USDCHF Bullish Flag Pattern most of bullish flag patterns gets their targets they are called bullish patterns but dont forget to put STOPLOSS .

STATE BANK OF INDIA.....Buy There are two reasons to buy 1.its broken out of a flag pattern...so Hence I calculated the first leg of the flag and arrived at the tgt mentioned on the chart...2.Another reason to buy is simple...Its hit blue skies ..meaning new unchartered territory..So buy with day close stoploss below the previous two days bars..

AUDCADexpecting a long call on AUDCAD.
it broke a strong level where sellers had been found.
its been creating continuation patterns
bullish flag patterns
expecting upside momentum

Momentum Building for a Break Above 183This month is about to close with a Bullish Engulfing candle. On the weekly timeframe, a clear W pattern has formed, supported by a bullish RSI divergence, strengthening the bullish outlook. The daily timeframe also reflects a W pattern, and price action is now shaping a pole and flag pattern near the neckline of the previous formation. With major resistance around 183, a decisive breakout above this level could trigger a bullish move toward 210.
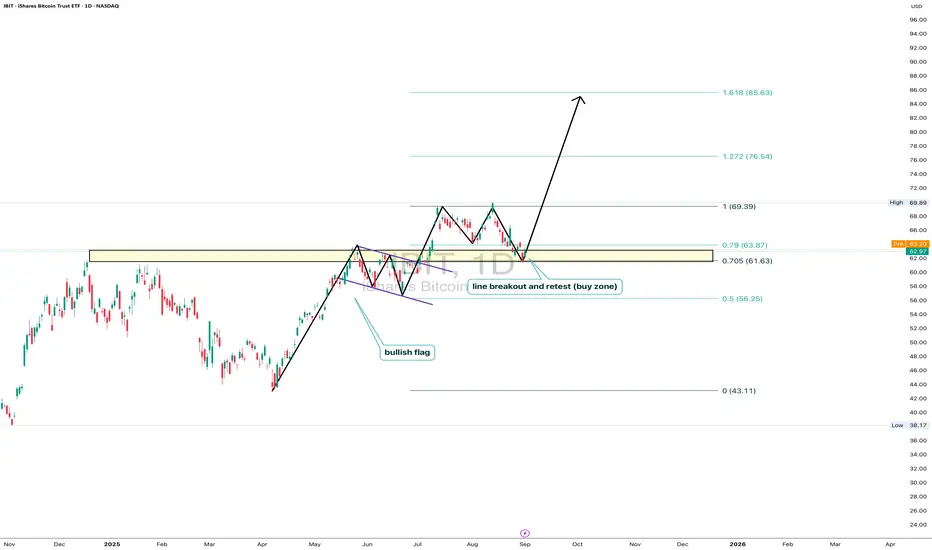
IBIT: ready for liftoffOn the daily chart, iShares Bitcoin Trust (IBIT) trades at $62.97, testing the key 0.705–0.79 Fibo zone ($61.63–63.87). This area marks a breakout and retest line, forming a clear buy zone. The technical structure remains bullish: after breaking out and pulling back, price holds potential to move toward $69.39, with Fibo extensions targeting $76.54 and $85.63. Volumes confirm buyer activity on dips, and the bullish flag pattern supports the continuation of the upward trend.
Fundamentally , the main driver is bitcoin itself, with institutional demand for BTC ETFs staying strong. Large funds continue accumulating positions, while expectations of a softer Fed tone add pressure on the dollar, fueling capital inflows into crypto. This strengthens the bullish case for IBIT.
Tactical plan: watch $61.6–63.8 as the key entry zone. Holding above opens the path toward $69.3, followed by $76.5 and $85.6. The scenario breaks only if price falls below $61.
And let’s be honest: IBIT isn’t just a ticker - it’s the “accelerate bitcoin” button for your portfolio.
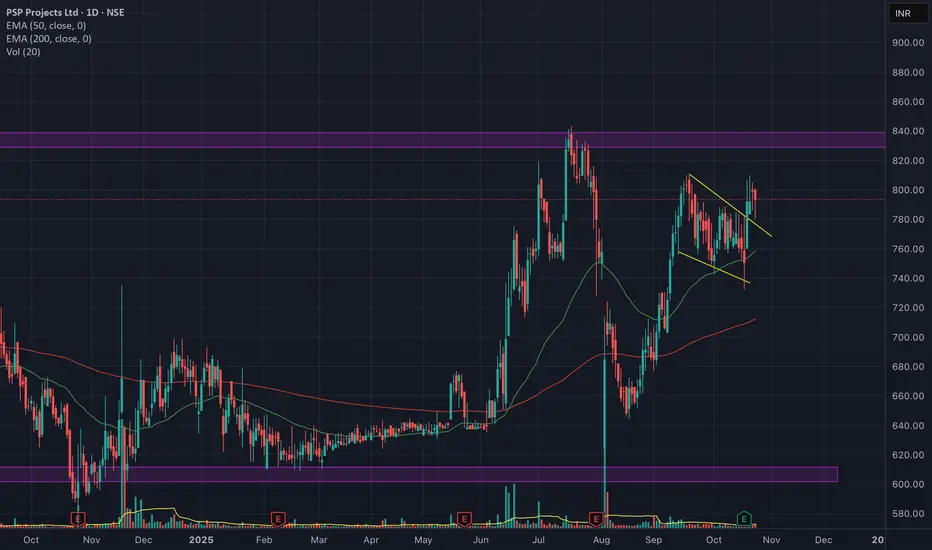
Pole n Flag pattern break out, getting ready for upside.This stock has given break out of pole n flag pattern on weekly and daily timeframe. Volumes are also supporting chart and candle patterns. Stock is moving within range, any close above 800 on daily timeframe, can test higher side of the range I.e. 845.
PD, about to start a long journey.For PD, on the weekly chart, big movement is coming. As seen with the circles, it is the time to break out for long journey. Volume negative divergence is on the spot.
Targets 21 - 26 - 35 and 41 with the Fib 0,618.
* Not for the trading advice *

Live YM Trade - Opening Range BreakoutCBOT_MINI:YM1!
Opening range breakout trade
Set stop orders on both ends for entry
Around a 100 point profit

WLFI 1H$WLFI 1H Chart
WLFI forming a bullish flag pattern after a strong impulse move.
A breakout above the flag resistance could trigger continuation toward the $0.16–$0.17 target.
Invalidation below $0.13.
#WLFI #Crypto #TradingView

USDCHF short calling this trade
USDCHF sell.
broke the rising wedge
creaated a continuation pattern for entry to the downside.
