XAUUSD 15M — Liquidity Sweep & 15M Order BlockGold is currently trading inside a short-term ascending structure after recovering from the lower range. Price has approached the 4,149–4,160 area, where the chart identifies a 15M Order Block.
A notable feature is the liquidity sweep around the previous high near 4,149. Price briefly interacted with this liquidity area before showing rejection, making the 15M OB an important zone to monitor.
Key Levels
🔴 15M OB: ~4,149–4,160
⚪ Liquidity area: around 4,149
🔵 Current structure: short-term ascen
FLOW
UNI – Correction Into the Perfect Zone?UNI is currently in a correction phase after its recent strong bullish impulse.
The key area to watch is the intersection of three important technical factors:
The previous structure
The green demand zone
The 0.618 Fibonacci retracement
This confluence around the $4.60–$4.80 area could provide a strong location for the next bullish reaction.
As price approaches this intersection, we will be looking for trend-following long setups and confirmation that buyers are stepping back in.
📌 The corr
Headline Indices Repair, but Breadth Still Refuses to ConfirmMarket Regime: Mixed / Narrow Leadership / Tactical Caution
Macro Regime: Long-End Yield Pressure / Hostile Tilt
Systemic Stress: Not confirmed
Confidence: High
The shortened trading week begins with MES and MNQ holding repaired structures, but the broader market still has not confirmed the strength displayed by the capitalization-weighted indices.
Because Monday was a market holiday, the latest cash-market breadth and internal readings remain Friday’s information. Tuesday’s opening participat
BTCUSD Market Structure & Liquidity Analysis | 1DThis BTCUSD 1D chart presents a detailed market structure and liquidity analysis, highlighting the transition from a prolonged corrective phase into a strong bullish expansion. The chart focuses on price action, Market Structure Shifts (MSS), Breaks of Structure (BOS), liquidity levels, demand zones, resistance areas, and key reaction points.
The earlier price action shows a period of volatility and structural changes, with multiple MSS and BOS formations developing as the market moved through
FLOW / FLOWUSDT Long Setup | Breaker Block ReclaimMARKET ANALYSIS
FLOW is currently reacting from a key technical area highlighted on the chart.
As long as the protected support zone remains intact, the bullish market structure remains valid and higher liquidity targets may continue to attract price action.
A breakdown below the invalidation level would weaken the current bullish scenario and require a reassessment of market conditions.
📍 Entry, Stop Loss and Take Profit levels are marked directly on the chart.
━━━━━━━━━━━━━━
⚠️ DISCL
EUR/USD – Ascending Channel Eyes Major Resistance at 1.1650EUR/USD continues to respect a well-defined ascending channel since the late-July low, with a series of higher lows and consecutive BOS confirming bullish structure.
Clean bullish market structure with sequential ChoCH → BOS shifts marking the trend change from late July
Price has repeatedly bounced off the lower channel trendline, respecting the ascending structure
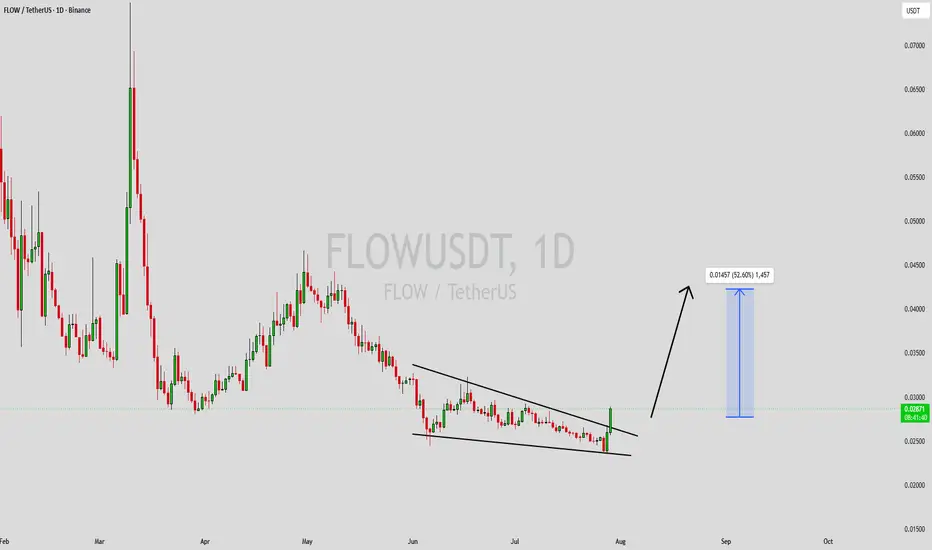
FLOWUSDT Forming Falling WedgeFLOWUSDT is forming a clear falling wedge pattern, a classic bullish wave signal that often indicates an upcoming breakout. The price has been consolidating within a narrowing range, suggesting that selling pressure is weakening while buyers are beginning to regain control. With consistent volume confirming accumulation at lower levels, the setup hints at a potential bullish breakout soon. The projected move could lead to an impressive gain of around 40% to 50% once the price breaks above the we
SILVER - CVD Pressure Aura Weather ReportSILVER
On the 20-minute timeframe, the upper red flood stretched 6+ ATRs from the 200 SMA (gravity building). Watch the chaotic lightning field ignite above the envelope — sellers at exhaustion.
Then the clamps release and the green surge returns. This is what saturation + reversion looks like as weather.
Who Is The Marginal Buyer of Bitcoin Now?ETF Flows vs. Perp Leverage: Who Is The Marginal Buyer of Bitcoin Now?
Most traders ask:
“Who is selling Bitcoin?”
But the better question is:
“Who is no longer buying?”
In 2024 and 2025, one of the strongest narratives behind BTC was institutional demand through spot ETFs.
This created a powerful and simple story:
new regulated vehicles, new capital, new marginal bid.
But market structure changes when that bid slows down.
When ETF inflows are strong, spot demand can absorb volatility.
Flow · The altcoins bull market starts now · Crypto is going up Some projects leave no room for doubt. You look at this chart and there is no way to conceive the start of a bear market. It is just not possible. A really long one just ended late last month.
FLOWUSDT produced the highest volume ever in March 2026, by far the highest, truly something. The 9-March weekly session produced 275.06 M worth of volume. To add some perspective, the second highest week on this chart did 139.54 M in January 2024. Then it goes much lower and this happened only several ti
ETHUSDT 8H | Secondary Path Activating | ABC Corrective → $2,060The diagonal delivered so far.
Wave 5 printed its terminal candle into the $2,390–$2,400 zone — the exact IF condition from the prior analysis.
The THEN is now in motion.
ABC corrective sequence is activating:
Wave A → $2,175 structural target
Wave B → ~$2,250 partial retrace
Wave C → $2,060 POC — the highest-volume node on the entire 8H structure
That yellow level is institutional memory.
The price the market has agreed on as fair value more than any other on this chart.
It also sits insid
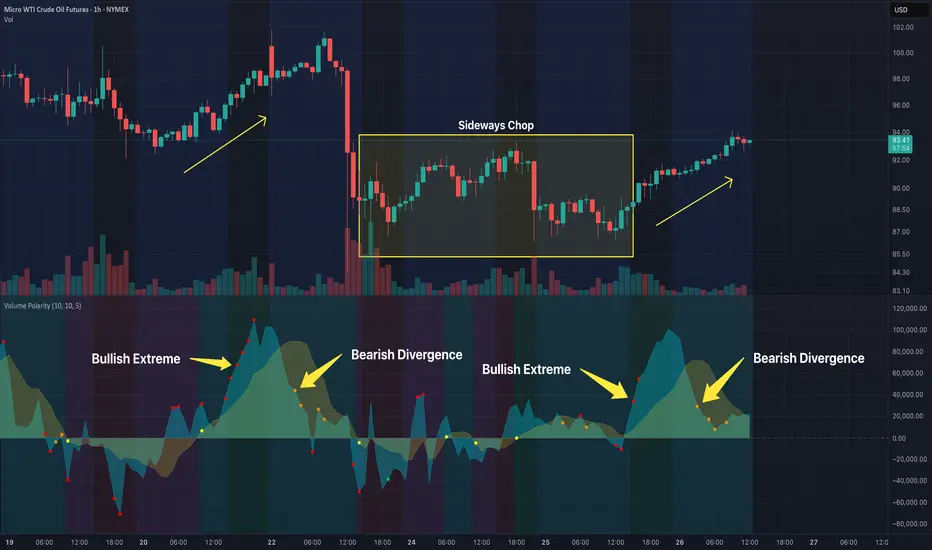
MCL1! Volume Polarity is flashing the same warning that precededHistory doesn’t always repeat, but it often rhymes.
On March 20th, Volume Polarity showed clear signs of exhaustion:
Bullish volume reached extreme levels (red dots)
Raw volume differential crossed under the smoothed differential
Bearish divergences began printing (orange dots)
This was followed by a sharp $14.23 drop.
We are now seeing an almost identical setup after several days of sideways chop:
Bullish volume is once again pushing into extreme territory
Raw differential has c
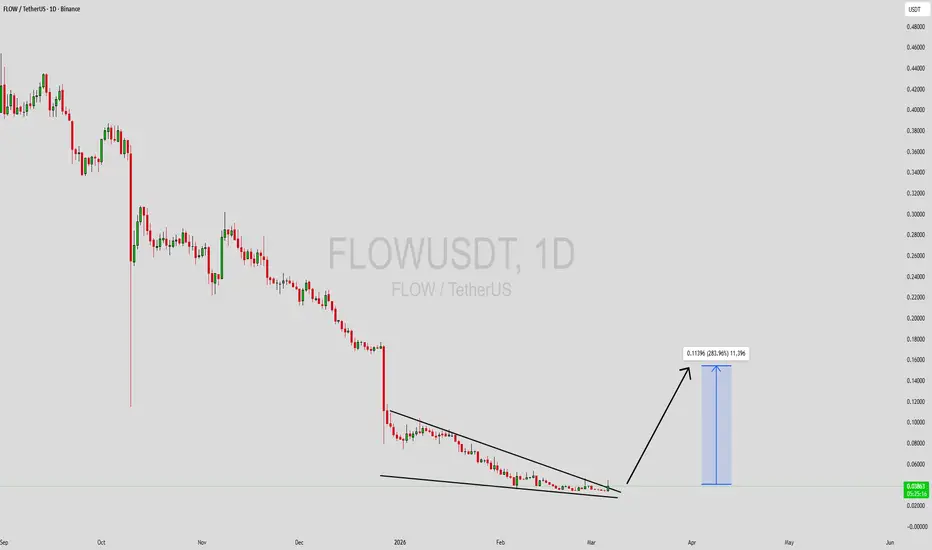
FLOWUSDT Forming Falling WedgeFLOWUSDT is forming a clear falling wedge pattern, a classic bullish reversal signal that often indicates an upcoming breakout. The price has been consolidating within a narrowing range, suggesting that selling pressure is weakening while buyers are beginning to regain control. With consistent volume confirming accumulation at lower levels, the setup hints at a potential bullish breakout soon. The projected move could lead to an impressive gain of around 290% to 300% once the price breaks above
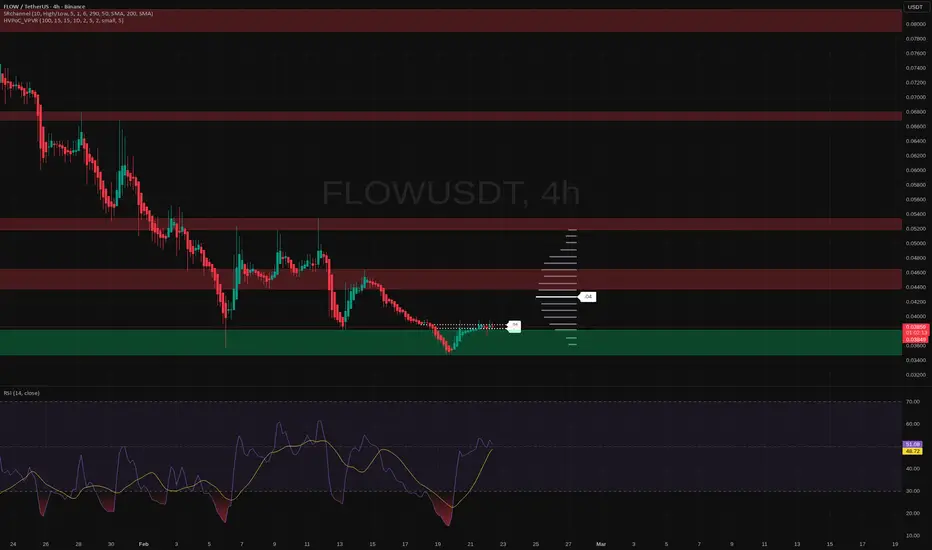
FLOW: bounce or drop? key levels and targets for todayFLOW
Who’s brave enough to touch a chart that looks like a ski slope straight to zero? According to market chatter, FLOW’s been under pressure with weak liquidity and fading hype, but lately the headlines about ecosystem updates and partnerships are starting to creep back in. That’s usually when smart money quietly accumulates while everyone else memes it to death.
On the 4H chart we’re sitting on a heavy demand pocket after a brutal bleed, with RSI stuck in oversold but curling up. I see a t
FLOWUSDT Forming Bullish PennantFLOWUSDT is forming a clear bullish pennant pattern, a classic bullish continuation signal that often indicates an upcoming breakout. The price has been consolidating within a narrowing range, suggesting that selling pressure is weakening while buyers are beginning to regain control. With consistent volume confirming accumulation at lower levels, the setup hints at a potential bullish breakout soon. The projected move could lead to an impressive gain of around 190% to 200% once the price breaks
FLOW: ready for a bounce? key levels to watch in the days aheadFLOW. Tired of watching this one bleed every week? News feed is still cold on NFT and gaming coins, while liquidity keeps hugging the majors, which is exactly why I like hunting oversold bounces here. FLOW is sitting on a fat multi-week demand zone that the market keeps defending.
On the 4H chart price is parked in the green box around 0.036-0.039, RSI just ripped up from deep oversold and is back above 50. VPVR shows the next serious liquidity node up near 0.042-0.044, right where my first red
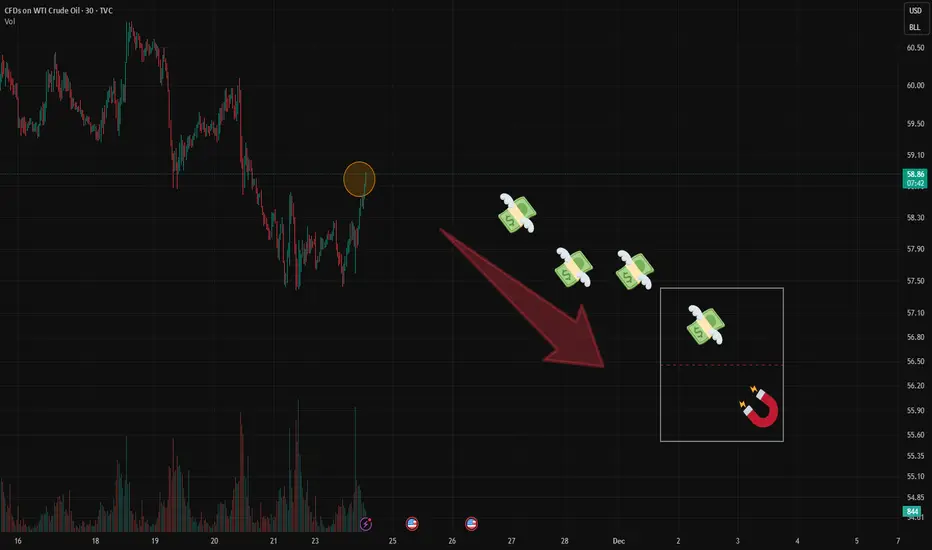
Oil Upd:Price at Resistance–But the Real Story Is in OptionFlowRight now, price has reached the upper boundary of the 1σ Expected Range (ER).
A pause or rejection here is possible.
But that’s not the main story.
Bears are getting active in the options market.
First sign: A significant Put Condor has appeared — large enough to stand out.
Target range: $55–$57
Timeframe: 20 days to expiry
📌 For those still learning:
A Condor profits most when price stays within a tight range at expiry.
Second wave of bearish positioning:
Additional players are pl
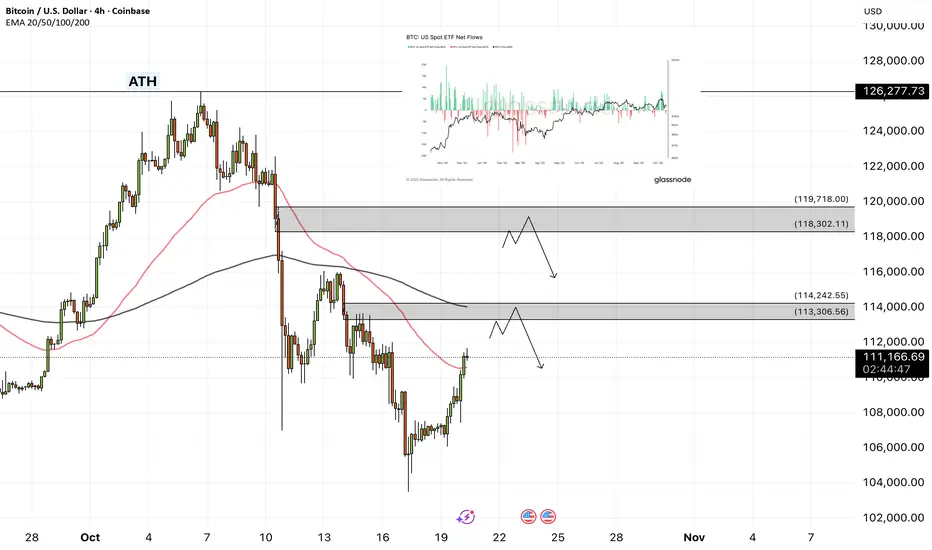
Bitcoin - Will Bitcoin also cross $100,000?!Bitcoin is located between EMA50 and EMA200 on the four-hour timeframe and is in its medium-term ascending channel. In case of an upward correction towards the specified supply range, it is possible to sell Bitcoin with a better risk-reward.
It should be noted that there is a possibility of heavy fluctuations and shadows due to the movement of whales in the market and compliance with capital management in the cryptocurrency market will be more important. If the downward trend continues, we can b
What Bitcoin Options on CME Are Whispering Right Now
A quick look at the flow — and it’s clear:
the market is pricing in a move toward $145K–$150K.
But here’s the nuance:
nearly all these call spreads come with a hedge — a short futures leg added right away.
This isn’t pure bullish speculation.
It’s a structured play.
🔍 The Logic Behind It:
Primary goal: Profit from upside as BTC rallies.
But also prepared for downside:
These portfolios assume a potential drop to $103K, and in some cases even $101K — which are the break-even points of the s
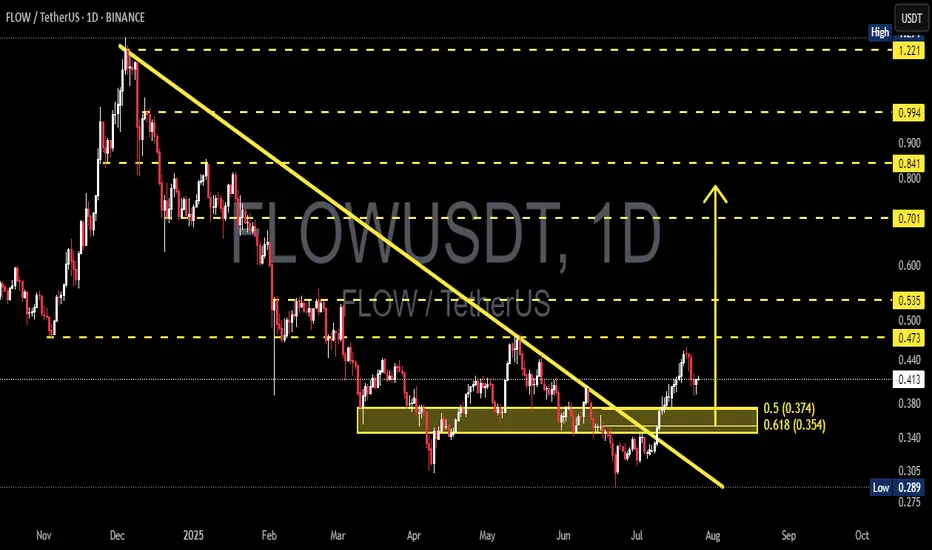
FLOWUSDT Breakout + Golden Pocket Retest: Ready to Explode?After being trapped in a persistent downtrend for months, FLOW has finally shown a major technical signal: a clean breakout from the dominant descending trendline that has defined price action since late 2024.
This breakout isn’t just visually appealing — it’s backed by strong technical confluence, including a key demand zone, Fibonacci retracement support, and potential shift in market psychology.
---
🧠 Technical Structure & Chart Breakdown
📉 Descending Trendline Breakout
The major downtre