SILVER: Short Signal Explained
SILVER
- Classic bearish formation
- Our team expects pullback
SUGGESTED TRADE:
Swing Trade
Short SILVER
Entry - 78.099
Sl - 80.385
Tp - 74.346
Our Risk - 1%
Start protection of your profits from lower levels
Disclosure: I am part of Trade Nation's Influencer program and receive a monthly fee for using their TradingView charts in my analysis.
❤️ Please, support our work with like & comment! ❤️
Forex

TESLA Massive Long! BUY!
My dear followers,
This is my opinion on the TESLA next move:
The asset is approaching an important pivot point 410.99
Bias - Bullish
Technical Indicators: Supper Trend generates a clear long signal while Pivot Point HL is currently determining the overall Bullish trend of the market.
Goal - 425.61
About Used Indicators:
For more efficient signals, super-trend is used in combination with other indicators like Pivot Points.
Disclosure: I am part of Trade Nation's Influencer program and receive a monthly fee for using their TradingView charts in my analysis.
———————————
WISH YOU ALL LUCK

NATGAS Technical Analysis! BUY!
My dear subscribers,
This is my opinion on the NATGAS next move:
The instrument tests an important psychological level 3.405
Bias - Bullish
Technical Indicators: Supper Trend gives a precise Bullish signal, while Pivot Point HL predicts price changes and potential reversals in the market.
Target - 3.488
My Stop Loss - 3.360
About Used Indicators:
On the subsequent day, trading above the pivot point is thought to indicate ongoing bullish sentiment, while trading below the pivot point indicates bearish sentiment.
Disclosure: I am part of Trade Nation's Influencer program and receive a monthly fee for using their TradingView charts in my analysis.
———————————
WISH YOU ALL LUCK

US30 My Opinion! SELL!
My dear friends,
Please, find my technical outlook for US30 below:
The instrument tests an important psychological level 50111
Bias - Bearish
Technical Indicators: Supper Trend gives a precise Bearish signal, while Pivot Point HL predicts price changes and potential reversals in the market.
Target - 49609
About Used Indicators:
Super-trend indicator is more useful in trending markets where there are clear uptrends and downtrends in price.
Disclosure: I am part of Trade Nation's Influencer program and receive a monthly fee for using their TradingView charts in my analysis.
———————————
WISH YOU ALL LUCK

EURUSD Set To Fall! SELL!
My dear friends,
Please, find my technical outlook for EURUSD below:
The price is coiling around a solid key level - 1.1814
Bias - Bearish
Technical Indicators: Pivot Points Low anticipates a potential price reversal.
Super trend shows a clear sell, giving a perfect indicators' convergence.
Goal - 1.1802
Safe Stop Loss - 1.1823
About Used Indicators:
The pivot point itself is simply the average of the high, low and closing prices from the previous trading day.
Disclosure: I am part of Trade Nation's Influencer program and receive a monthly fee for using their TradingView charts in my analysis.
———————————
WISH YOU ALL LUCK

Gold ( important zone )As you can see in the attached TradingView chart (1-hour timeframe, XAU/USD around 4,964.62), gold has recently rallied sharply from lower levels (around the green demand zone near 4,700–4,750) and is now approaching a multi-layered supply zone highlighted in red.
Key observations from the chart:
Price has tested and reacted to the red supply bands multiple times, particularly around 5,024–5,035 and higher at 5,074–5,100.
The current price is consolidating/testing the lower edge of this supply area (~4,986–5,024), with yellow arrows indicating potential rejection and downward moves.
Bearish structure is visible with the price failing to hold higher after the recent pump, showing signs of exhaustion near these resistance layers.
On the 1H chart, we see potential bearish candlestick formations or rejection wicks at these levels.
I expect gold to show a very strong reaction (rejection) from these supply zones. With proper confirmations — such as a bearish engulfing candle, failure to break above 5,000–5,024 decisively, increased volume on downside, or bearish divergence on RSI/MACD — we can look to enter a sell trade targeting longer-term downside objectives, potentially back toward 4,850–4,900 initially, and deeper if momentum builds (e.g., toward the prior low zones or 4,700 area).
Risk management: Stops should be placed above the supply zone (e.g., above 5,074 or recent swing high) to protect against a breakout invalidation.
This is not financial advice; always DYOR and manage risk carefully.

EURUSD reay to bounceEURUSD is holding a structurally bullish recovery after a strong impulsive move higher, with price now retracing into a well-defined daily support and demand zone that previously acted as resistance, indicating a classic support flip and healthy pullback within an emerging uptrend. The current consolidation above this key level suggests sellers are losing momentum while buyers defend value, keeping bullish market structure intact as long as price holds above the zone. Fundamentally, the pair remains supported by easing US dollar strength amid growing expectations of Federal Reserve rate cuts later in the year, softer US macro data, and stabilizing risk sentiment, while the euro benefits from improving Eurozone growth outlook and reduced recession fears despite ongoing ECB caution. With liquidity absorbed on the downside, rising bullish momentum, and macro drivers favoring dollar weakness, this technical pullback into support aligns with continuation behavior, positioning EURUSD for a potential upside expansion toward higher liquidity zones, making this a favorable risk-to-reward environment for trend-following and smart money aligned long setups.

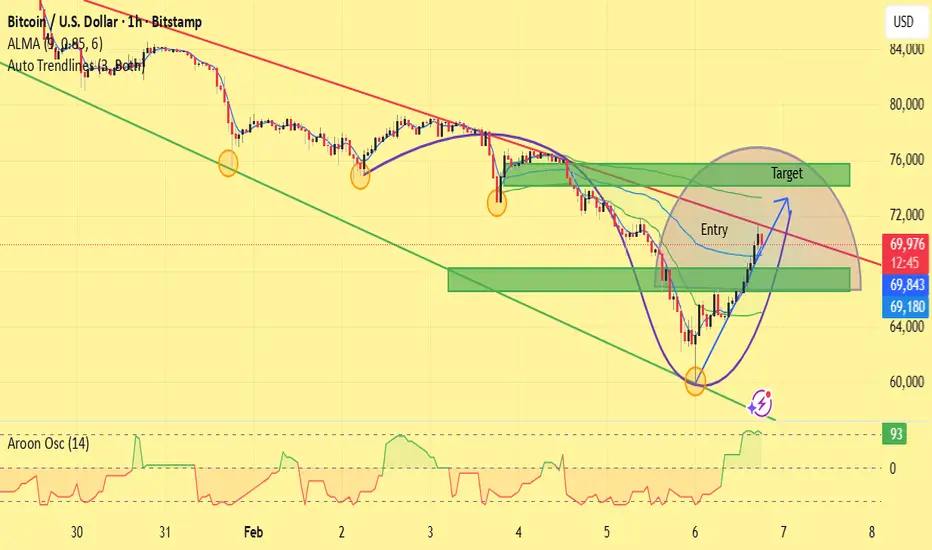
BTCUSD – 1H Chart Analysis & Trade Idea Bitcoin is trading within a broader descending channel, but recent price action shows a strong bullish reaction from channel support, suggesting a potential short-term recovery.
Technical Analysis
Price respected the lower trendline support of the descending channel and formed a rounded bottom / V-shaped recovery, indicating exhaustion of sellers.
A bullish structure shift is visible after the strong bounce from the lows, with higher highs and higher lows on the lower timeframe.
The green demand zone has acted as a solid support area, from which price is pushing upward.
The red descending trendline above is a key resistance and confluence area.
ALMA and dynamic levels suggest price is attempting a corrective move within the overall downtrend.
Aroon Oscillator is strongly bullish, confirming increasing upside momentum.
Trade Idea
Entry: Buy on pullback / confirmation within the marked green support zone.
Target: Upper resistance zone near the descending trendline (marked “Target”).
Bias: Short-term bullish correction, long-term trend still bearish unless price breaks and holds above the descending trendline.
Invalidation: A strong close below the demand zone and channel support.
Conclusion
This setup favors a counter-trend bullish move toward resistance. Traders should manage risk carefully, as the overall market structure remains bearish until a confirmed breakout occurs.
This analysis is for educational purposes only and not financial advice.
BTCUSD CHoCH Signals Trend Reversal Clear structure break + CHoCH on BTCUSD (2H). Based on what you marked, here are clean upside targets:
🎯 BTCUSD Upside Targets (after CHoCH)
Target 1 (TP1):
78,000 – 79,000
Previous supply / structure resistance
First logical profit-taking zone
Target 2 (TP2):
83,500 – 84,500
Higher timeframe resistance
Major liquidity / imbalance area
Strong swing target if bullish momentum continues
Invalidation / Risk Area (for bias)
If BTC loses 65,000 – 64,000, bullish setup weakens and downside continuation becomes likely.
Short & Simple Caption (for your post)
BTC breaks bearish structure and shows CHoCH on 2H, hinting at a potential trend reversal. Price may target higher liquidity zones if bullish momentum holds.

SOLANA CHoCH Signals Short-Term ReversalClean setup on SOLANA (30m) 👌 CHoCH after a strong bearish channel = potential short-term bullish continuation.
🎯 SOLANA Upside Targets
1️⃣ Target 1 (TP1):
👉 97.0 – 98.0
Prior structure resistance / supply zone
First liquidity pool above current price
2️⃣ Target 2 (TP2):
👉 105.0 – 107.0
Higher timeframe resistance
Major imbalance / premium zone
Good final target if momentum stays bullish
🔻 Invalidation (for bullish idea)
❌ Bullish bias weakens if price falls back below 82.0 – 80.0 (reclaim of bearish channel / cloud support lost).
One-liner description:
After breaking bearish structure, SOL shows CHoCH and aims for higher liquidity zones if buyers hold control.

EUR/USD Daily Chart Analysis For Week of Feb 6, 2026Technical Analysis and Outlook:
In the past week’s trading session, the Euro has exhibited a limited trading range, having fallen below the Mean Support level of 1.185 and currently trading closely below the Mean Resistance level of 1.183.
It is anticipated that, following the achievement of the letter target, a retracement towards the Mean Support at 1.177 will commence. This retracement is expected to precipitate a renewed downtrend, with the primary target set at the Outer Currency Dip of 1.166, supported by Mean Support levels at 1.177 and 1.168, which will present consequential hurdles. The rebounds are expected to be initiated from the aforementioned support levels and ultimate reached target the Outer Currency Dip 1.166.
Furthermore, market participants should remain vigilant regarding the potential for the currency to experience a gradual intermediate oscillation between the Mean Support at 1.177 and the Mean Resistance at 1.183 before resuming the downward movement.

ETHUSD Is Going Up! Long!
Please, check our technical outlook for ETHUSD.
Time Frame: 1D
Current Trend: Bullish
Sentiment: Oversold (based on 7-period RSI)
Forecast: Bullish
The market is approaching a key horizontal level 2,050.77.
Considering the today's price action, probabilities will be high to see a movement to 2,817.29.
P.S
Overbought describes a period of time where there has been a significant and consistent upward move in price over a period of time without much pullback.
Like and subscribe and comment my ideas if you enjoy them!

GBPNZD Will Go Higher From Support! Buy!
Take a look at our analysis for GBPNZD.
Time Frame: 5h
Current Trend: Bullish
Sentiment: Oversold (based on 7-period RSI)
Forecast: Bullish
The market is on a crucial zone of demand 2.261.
The oversold market condition in a combination with key structure gives us a relatively strong bullish signal with goal 2.277 level.
P.S
The term oversold refers to a condition where an asset has traded lower in price and has the potential for a price bounce.
Overbought refers to market scenarios where the instrument is traded considerably higher than its fair value. Overvaluation is caused by market sentiments when there is positive news.
Like and subscribe and comment my ideas if you enjoy them!

BITCOIN BUYERS WILL DOMINATE THE MARKET|LONG
BITCOI SIGNAL
Trade Direction: long
Entry Level: 69,967.58
Target Level: 85,412.99
Stop Loss: 59,642.66
RISK PROFILE
Risk level: medium
Suggested risk: 1%
Timeframe: 1D
Disclosure: I am part of Trade Nation's Influencer program and receive a monthly fee for using their TradingView charts in my analysis.
✅LIKE AND COMMENT MY IDEAS✅

GBP/AUD BULLISH BIAS RIGHT NOW| LONG
Hello, Friends!
The BB lower band is nearby so GBP-AUD is in the oversold territory. Thus, despite the downtrend on the 1W timeframe I think that we will see a bullish reaction from the support line below and a move up towards the target at around 1.950.
Disclosure: I am part of Trade Nation's Influencer program and receive a monthly fee for using their TradingView charts in my analysis.
✅LIKE AND COMMENT MY IDEAS✅

GBP/CHF BEST PLACE TO SELL FROM|SHORT
Hello, Friends!
Bearish trend on GBP/CHF, defined by the red colour of the last week candle combined with the fact the pair is overbought based on the BB upper band proximity, makes me expect a bearish rebound from the resistance line above and a retest of the local target below at 1.050.
Disclosure: I am part of Trade Nation's Influencer program and receive a monthly fee for using their TradingView charts in my analysis.
✅LIKE AND COMMENT MY IDEAS✅

GBPUSD Pullback into Resistance After Channel Breakdown...GBPUSD (1H), price has reacted from the demand zone and is now pulling back inside a broader bearish structure (below the descending channel + under the Ichimoku cloud). So the clean play here is a bullish pullback target into resistance:
🎯 Upside Targets (for the current bounce)
1st Target (TP1): ~1.3600
➜ Nearest horizontal resistance / prior structure support turned resistance.
2nd Target (TP2): ~1.3660 – 1.3680
➜ Strong resistance zone near the Ichimoku cloud + previous range high.
🔻 If you’re still bearish (trend continuation view)
Rejection from 1.3600–1.3680 opens continuation back toward 1.3520 → 1.3500 (demand zone lows).

XAUUSD BEARISH MOVE(READ CAPTION)Hi trader's what do you think about gold
Gold is currently showing a bearish market structure, with price facing strong selling pressure near key resistance levels. The market is struggling to sustain upward moves, and rallies are being treated as potential selling opportunities within the broader downtrend.
🔴 Resistance 1: 5,112
The 5,112 level is acting as an important short-term resistance. Rejection from this level may confirm continued bearish momentum.
🔴 Resistance 2: 5,207
This level represents a major resistance and supply area. As long as price remains below 5,207, the overall bias stays bearish.
🟢 Demand Zone: 4,860
The 4,860 level is a strong demand and support zone, where buyers may attempt to slow down the bearish move or create a temporary bounce.
📉 Market Bias
Below 5,112 – 5,207 → Bearish trend remains active
Rejection from resistance → Sell-on-rallies scenario
Strong reaction near 4,860 → Possible short-term bounce
Overall, Gold favors a sell-on-rallies strategy while price trades below the key resistance zone
please don't forget to like comment and follow

USDCAD: Bullish Outlook Explained 🇺🇸🇨🇦
USDCAD will likely continue rising on Monday, following
a confirmed breakout of a resistance line of a falling channel.
The violation occurred after a test of a strong intraday support.
Expect a rise at least to 1.704 level.
❤️Please, support my work with like, thank you!❤️
I am part of Trade Nation's Influencer program and receive a monthly fee for using their TradingView charts in my analysis.

USDCAD - HTF AnalysisJust some analysis on USDCAD on the higher timeframes such as the daily, weekly, monthly.
Of course, using the usual concepts I use.
All is mentioned in the video, so do watch, share your thoughts.
Safe trading!
- R2F Trading

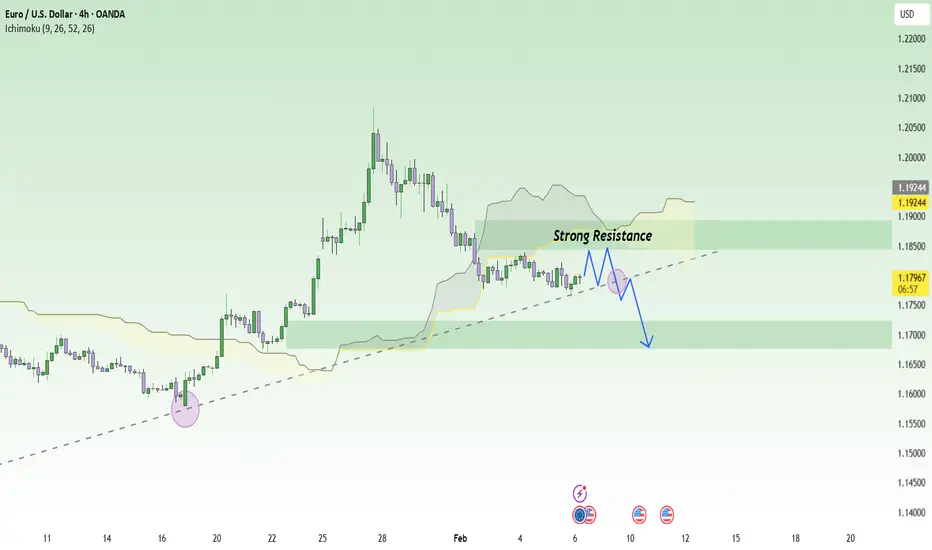
Don’t Rush to Buy EURUSD – The Bearish Trend Is Speaking UpEURUSD is currently leaning toward a short-term BEARISH trend, as recent news continues to favor the U.S. dollar over the euro . The ECB has kept interest rates unchanged with a rather cautious tone , while Eurozone data and momentum remain too weak to support a sustainable EUR recovery. In contrast, the USD is still supported by expectations that U.S. interest rates will stay higher for longer , making EURUSD rallies vulnerable to selling pressure.
On the chart, after the strong rally at the end of January , price has entered a corrective phase and is now trading below the Ichimoku cloud. This signals that bullish momentum has faded , and the market is shifting into a “technical rebound within a short-term downtrend” . Recent candles are compressing around the 1.17–1.18 zone, which may look like accumulation, but in reality it is more likely consolidation before a downside break if price fails to clear overhead resistance.
The 1.1840 area stands out as a clear resistance zone (supply confluence + cloud resistance) , where selling reactions are highly likely. If price pulls back toward 1.1840 but fails to hold, the higher-probability scenario is a renewed move lower, with an initial focus on 1.1700, and a deeper extension toward 1.1677, in line with the marked targets.
Bitcoin Rebound: Pause Before the Next Move Lower?Hello everyone, looking at Bitcoin on the H4 timeframe, the overall picture hasn’t changed much. The dominant trend remains bearish, and the recent rebound is more likely a technical move rather than a genuine reversal signal.
From a structural perspective, price is still trading below the key EMA levels, and these EMAs continue to slope downward — a clear sign that selling pressure remains in control. The recent bounce came immediately after a sharp sell-off, which is a very typical characteristic of a technical rebound: price retraces to release downside pressure, but without meeting the conditions required to confirm a new uptrend. Volume supports this view as well — selling volume expanded strongly during the decline, while the rebound lacked the kind of volume that would confirm sustained buying interest.
From my experience, when price rallies but fails to reclaim the EMA zone above, it usually signals a pullback within the dominant trend rather than the start of a longer bullish phase.
So what are the key levels to watch next?
On the downside, the 63,000–65,000 USDT area is the nearest support zone I’m closely monitoring. If selling pressure continues, this is a level Bitcoin could realistically revisit to test market reaction. My base case scenario is a move down toward support, potentially followed by short-term consolidation or even a false break, before a rebound toward the resistance zone around 72,000–75,000 USDT.
Only if price can break above and hold above the medium-term EMA zone, while rebuilding a Higher High – Higher Low structure, would I begin to seriously consider a transition into a more sustainable bullish trend.
From a macro and news perspective, current pressures have not fully faded. Based on information flows from Forex Factory and other mainstream financial sources, US interest rate expectations continue to weigh on risk assets. While the market has started to talk more about potential easing in the second half of the year, the Fed has yet to deliver a sufficiently dovish signal to attract large-scale capital back into crypto. At the same time, short-term risk-off sentiment still emerges as investors react to economic data and sharp moves across global financial markets, while larger players appear more patient, waiting for deeper discounted price zones rather than chasing rebounds.
Putting everything together, I’m still leaning toward a decline–rebound–decline scenario. My personal approach is to avoid chasing buys during technical rebounds and instead focus on observing price behavior around the 63k–65k zone. If price rallies into the 72k–75k area but fails to break the broader trend structure, this region is likely to remain a notable selling zone.
What about you? Are you expecting Bitcoin to hold support and form a base, or are you still preparing for a deeper correction ahead?

EURGBP Channel Down topped. Sell Signal.The EURGBP pair has been trading within a Channel Down since the November 14 2025 High. Yesterday the price hit the pattern's Top (Lower Highs trend-line) and got rejected exactly on the 1D MA50 (blue trend-line), similar to the previous Lower High.
That High initiated a -1.52% Bearish Leg and we expect the market to drop at least by the same % as it's the minimum Bearish Leg drop it had within this Channel Down. As a result, our Target s 0.85900, which would also make a perfect test of the 1W MA200 (red trend-line), the market's natural long-term Support.
---
** Please LIKE 👍, FOLLOW ✅, SHARE 🙌 and COMMENT ✍ if you enjoy this idea! Also share your ideas and charts in the comments section below! This is best way to keep it relevant, support us, keep the content here free and allow the idea to reach as many people as possible. **
---
💸💸💸💸💸💸
👇 👇 👇 👇 👇 👇
