GBPUSD H4: Correction Before the Next Bullish ExpansionHi!
GBPUSD is currently transitioning into a short-term corrective phase after showing signs of trend exhaustion near the upper boundary of the ascending channel. Following the strong impulsive rally, price failed to sustain momentum at the channel top and has since reacted lower, signaling that buyers are stepping back temporarily.
The recent decline has brought price back below the internal trendline and short-term structure, with prior support now acting as near-term resistance. This shift suggests that any rebound toward the 1.3650–1.3700 area is more likely to be sold into, rather than developing into a fresh impulsive move higher.
From a structural perspective, the broader trend remains bullish, but the current price action favors further downside testing first. I expect GBPUSD to continue correcting toward the 1.3550–1.3600 demand zone, where previous accumulation and channel support converge. This area is key to watch for signs of stabilization or bullish reaction.
As long as price holds above the lower boundary of the ascending channel, this pullback should be viewed as a healthy retracement within a broader uptrend, not a reversal. A successful defense of support could open the door for the next bullish leg, targeting 1.3750 initially, and potentially extending higher as momentum rebuilds.
In summary, short-term bias is corrective to bearish, while medium-term structure remains constructive. I’m treating rallies as corrective until price reclaims broken structure — patience around support will be critical for the next directional move.
Forex

AUDUSD Will Go Down! Short!
Take a look at our analysis for AUDUSD.
Time Frame: 4h
Current Trend: Bearish
Sentiment: Overbought (based on 7-period RSI)
Forecast: Bearish
The market is testing a major horizontal structure 0.697.
Taking into consideration the structure & trend analysis, I believe that the market will reach 0.689 level soon.
P.S
Please, note that an oversold/overbought condition can last for a long time, and therefore being oversold/overbought doesn't mean a price rally will come soon, or at all.
Like and subscribe and comment my ideas if you enjoy them!

USDCHF - The Breakdown You Can’t Afford to IgnoreHello Traders! 👋
What are your thoughts on USDCHF?
This chart shows a bearish technical analysis for the USD/CHF (US Dollar vs. Swiss Franc) currency pair on a daily timeframe.
The overall sentiment is that the pair has broken below long-term support and is now showing signs of further weakness.
Key Takeaways
Bearish Breakdown: The price has fallen significantly below a long-standing consolidation range (the blue support zone around 0.7850).
Role Reversal: The previous "Support" (blue zone) is now acting as "Resistance." The red arrow indicates a "retest" of this level—a common technical pattern where price returns to a broken level before continuing lower.
Descending Trend: The purple lines highlight a series of "Lower Highs," indicating a sustained downward trend over the past several months.
Don’t forget to like and share your thoughts in the comments! ❤️


Bitsounis / EURAUD Short limitEURAUD has broken the upward trend in 1h.
and I am waiting for an entry in the fib level zone.

XRPUSD 1H Chart Targets...XRPUSD – 1H Chart Targets 📊
Based on the chart (strong sell-off → demand reaction + Ichimoku resistance above):
🔍 Market Bias
Short-term Bullish Pullback (Relief Rally)
Overall trend still bearish until major resistance breaks.
📈 Buy Setup (from demand zone)
Buy Zone:
1.22 – 1.25 (highlighted demand area)
Targets:
🎯 TP1: 1.45
🎯 TP2: 1.55
🎯 TP3: 1.60 (major resistance / marked target)
Stop Loss:
🛑 Below 1.18
⚠️ Trade Notes
This is a pullback trade, not trend reversal
Expect rejection near Ichimoku cloud
Secure partial profits at each target

GBP/USD Declines After Bank of England DecisionGBP/USD Declines After Bank of England Decision
Yesterday’s decision by the Bank of England came as a surprise to forex traders. While the Official Bank Rate was left unchanged at 3.75%, markets were caught off guard by the notably dovish signals regarding future policy.
According to media reports, four out of nine Monetary Policy Committee members voted for an immediate rate cut. This has brought forward expectations of easing by the Bank of England, making the pound less attractive to hold and triggering its weakness yesterday.
Technical Analysis of GBP/USD
Price action in GBP/USD has been forming an upward trend (outlined by a channel) since November last year. However, yesterday’s move has put this channel at risk of a downside break.
It is worth noting that the market had only recently been in a very strong bullish phase. GBP/USD was advancing along the blue support line and even pushed above the upper boundary of the ascending channel.
Sentiment then shifted abruptly. Bears stepped in aggressively, driving the pair lower and breaking through several technical levels in sequence:
→ the blue trendline;
→ the upper boundary of the channel;
→ the channel median, reinforced by the 1.3640 level.
As a result, the price fell towards the lower boundary of the channel, strengthened by the 1.3530 level, which had acted as resistance in late December and early January.
Almost all of the bullish gains made in late January have now been erased. It cannot be ruled out that today’s rebound in GBP/USD is merely a technical recovery — a pause that allows bears to regroup before attempting a break below the lower boundary of the ascending channel, potentially steering the market into a downward trajectory (shown in red).
This article represents the opinion of the Companies operating under the FXOpen brand only. It is not to be construed as an offer, solicitation, or recommendation with respect to products and services provided by the Companies operating under the FXOpen brand, nor is it to be considered financial advice.

Gold at a Decision Zone Structure Will Decide the Next MoveGold is currently trading inside a compression structure after a sharp move.
Price is reacting near a key decision zone where liquidity sits on both sides.
A break in either direction could trigger the next expansion phase.
Focus remains on structure confirmation rather than prediction.

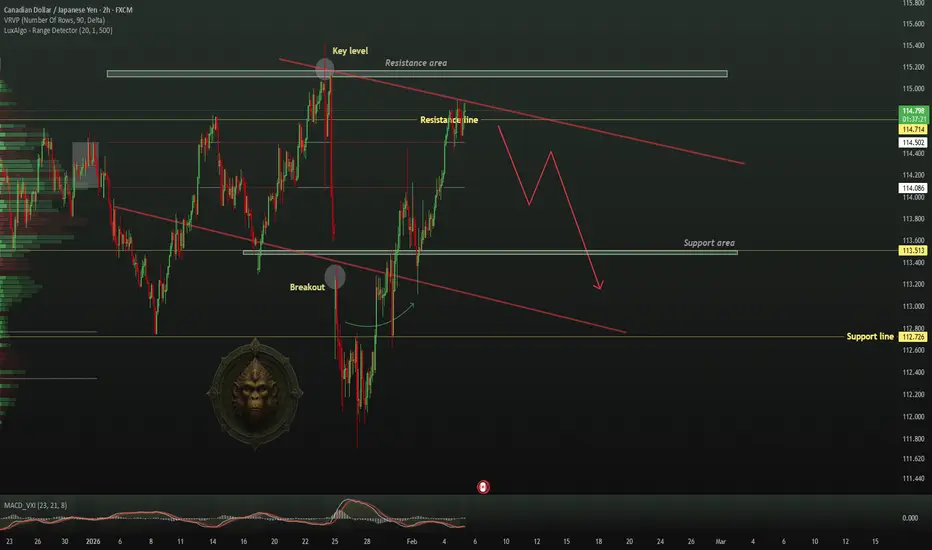
TheGrove | CADJPY Sell | Idea Trading AnalysisYou can expect a reaction in the direction of selling from the specified Resistance area
CADJPY moving higher as it tests the strong resistance level..
We expect a bearish move from the confluence zone.
Hello Traders, here is the full analysis.
I think we can soon see more fall from this range! GOOD LUCK! Great SELL opportunity CADJPY
I still did my best and this is the most likely count for me at the moment.
-------------------
Traders, if you liked this idea or if you have your own opinion about it, write in the comments. I will be glad 🤝
EURNZD – 1H Chart Targets...EURNZD – 1H Chart Targets 📊
Based on my chart (trendline break + strong bullish impulse + pullback zone):
🔍 Market Bias
Bullish continuation (buy on pullback)
📈 Buy Setup
Buy Zone:
1.9650 – 1.9700 (highlighted demand + cloud support)
Targets:
🎯 TP1: 1.9850
🎯 TP2: 1.9900
🎯 TP3 (Final): 1.9950 ✅ (marked target zone)
Stop Loss:
🛑 Below 1.9580
⚠️ Trade Notes
Previous downtrend already broken
Healthy pullback expected before next push up
Partial profit booking recommended at TP1 & TP2

XAUUSD – H4 OutlookXAUUSD – H4 Outlook: Technical Rebound as Precious Metals Stabilise | Lana ✨
Precious metals are showing early signs of stabilisation after a period of heavy volatility. As silver rebounds sharply from intraday lows, gold is also attempting to rebuild structure following a strong corrective sell-off.
This move appears to be a technical recovery, not yet a full trend reversal, but it provides important clues about the next directional phase.
📈 Market Structure & Price Action
After failing to hold above the upper supply zone near 5,500, gold experienced a sharp bearish displacement, breaking previous structure and accelerating lower. However, price found strong demand around the 4,600–4,650 support zone, where selling pressure was absorbed.
From this base, gold is now forming higher lows, indicating a short-term recovery within a broader corrective structure. The descending trendline remains intact, keeping the market in a decision-making phase.
🔍 Key Technical Zones
Strong Support / Demand: 4,600 – 4,650
This area acted as a clear liquidity base and remains critical for any recovery scenario.
Near-Term Resistance / Reaction Zone: ~4,900 – 4,920
Price is currently reacting here. Acceptance above this level would strengthen bullish momentum.
Mid Resistance: ~5,050 – 5,100
A key zone aligned with prior structure and imbalance.
Major Supply Zone: ~5,500
This remains the upper boundary where sellers previously regained control.
🎯 Possible Scenarios
Base Case:
Gold continues to consolidate above 4,600–4,650, building structure before attempting a push toward 4,900–5,050.
Bullish Extension:
Acceptance above 5,050 could open the door for a broader recovery toward higher supply zones.
Failure Scenario:
A breakdown below 4,600 would invalidate the rebound and shift focus back to lower liquidity.
🌍 Intermarket Context
Silver’s sharp rebound after a deep sell-off suggests panic-driven liquidation is easing across metals. Historically, such moves often support short-term recoveries in gold, even if volatility remains elevated.
🧠 Lana’s View
This is a recovery-in-progress, not a market to chase. The focus should remain on how price behaves at key resistance zones, especially near 4,900–5,050.
Patience is key while the market decides whether this rebound develops into a broader trend shift or remains corrective.
✨ Respect the structure, trade the levels, and let the market confirm the next move.

GBPCAD: Deep Trap?! 🇬🇧🇨🇦
It looks like we have a deep false violation of an intraday support on GBPCAD.
We see a strong bullish price action during the London session opening today.
I expect a rise at least to 1.862 level.
❤️Please, support my work with like, thank you!❤️
I am part of Trade Nation's Influencer program and receive a monthly fee for using their TradingView charts in my analysis.

CHFJPY Will Collapse! SELL!
My dear subscribers,
My technical analysis for CHFJPY is below:
The price is coiling around a solid key level - 201.99
Bias - Bearish CHFJPY
Technical Indicators: Pivot Points High anticipates a potential price reversal.
Super trend shows a clear sell, giving a perfect indicators' convergence.
Goal - 201.09
About Used Indicators:
By the very nature of the supertrend indicator, it offers firm support and resistance levels for traders to enter and exit trades. Additionally, it also provides signals for setting stop losses
Disclosure: I am part of Trade Nation's Influencer program and receive a monthly fee for using their TradingView charts in my analysis.
———————————
WISH YOU ALL LUCK

SPX500: Bearish Drop to 6850?As the previous analysis worked exactly as predicted, FX:SPX500 is eyeing a bearish reversal on the 4-hour chart , with price testing a key resistance zone after lower highs, converging with a potential entry area that could trigger downside momentum if sellers defend amid recent volatility. This setup suggests a pullback opportunity in the uptrend, targeting lower support levels with more than 1:4 risk-reward .🔥
Entry between 7050–7080 for a short position (entry from current price with proper risk management is recommended). Target at 6850 . Set a stop loss at a daily close above 7100 , yielding a risk-reward ratio of more than 1:4 . Monitor for confirmation via a bearish candle close below entry with rising volume, leveraging the index's dynamics near resistance.🌟
Fundamentally , the S&P 500 closed just shy of a record high on February 2, 2026, up 0.5% to 6,976.44, driven by gains in chipmakers and small caps amid AI optimism. However, February historically poses risks, with waning momentum and potential 10% drops if reversals occur. Today's JOLTS Job Openings (Dec) at 8:00 AM ET (forecast 7.7M) could strengthen USD and pressure equities if robust, signaling resilient labor markets amid Fed caution. 💡
📝 Trade Setup
🎯 Entry (Short):
7050 – 7080
(Entry from current price is valid with proper risk & position sizing.)
🎯 Target:
• 6850
❌ Stop Loss:
• Daily close above 7100
⚖️ Risk-to-Reward:
• > 1:4
💡 Your view?
Is SPX500 setting up for a healthy pullback toward 6850, or will buyers absorb supply and push into new all-time highs above 7100? 👇

BTC LONG FEB 4 2026 READ DESCRIPTION I have created long positions in bitcoin here as I can see potential buying. I am clarifying that I have added this in my portfolio and I am not trading this. I will explain the price action of bitcoin today.
Thanks for all the love & support

CAD/JPY BEARISH BIAS RIGHT NOW| SHORT
Hello, Friends!
We are going short on the CAD/JPY with the target of 113.961 level, because the pair is overbought and will soon hit the resistance line above. We deduced the overbought condition from the price being near to the upper BB band. However, we should use low risk here because the 1W TF is green and gives us a counter-signal.
Disclosure: I am part of Trade Nation's Influencer program and receive a monthly fee for using their TradingView charts in my analysis.
✅LIKE AND COMMENT MY IDEAS✅

GBPUSD: Bearish Drop to 1.334?FX:GBPUSD is eyeing a bearish reversal on the 4-hour chart , with price testing resistance after recent highs in an upward trendline from June 2025, converging with a potential entry zone that could spark downside momentum if sellers defend amid volatility. This setup suggests a pullback opportunity post-rally, targeting lower support levels with more than 1:2 risk-reward .🔥
Entry between 1.3566–1.3586 for a short position. Target at 1.3341 . Set a stop loss at a close above 1.3664 , yielding a risk-reward ratio of more than 1:2 . Monitor for confirmation via a bearish candle close below entry with rising volume, leveraging the pair's dynamics near resistance.🌟
Fundamentally , GBPUSD is trading around 1.357 in early February 2026, with key events this week. For the US Dollar, Nonfarm Payrolls (Jan, forecast 50K) on February 6 at 1:30 PM UTC, the week's highlight—weak data could favor GBP upside. 💡
📝 Trade Setup
🎯 Entry (Short):
1.3566 – 1.3586
(Entry from current price is valid with proper risk & position sizing.)
🎯 Target:
• 1.3341
❌ Stop Loss:
• Close above 1.3664
⚖️ Risk-to-Reward:
• > 1:2
💡 Your view?
Is this the start of a healthy pullback toward 1.3340, or will GBP bulls push through resistance and extend the rally? 👇

CABLE H4 | Potential Bullish BounceThe price is reacting off our buy entry level at 1.3549, which is a pullback support that aligns with the 61.8% Fibonacci retracement and the 78.6% Fibonacci projection.
Our stop loss is set at 1.3479, which is a pullback support that aligns with the 100% Fibonacci projection.
Our take profit is set at 1.3685, which is a pullback resistance that aligns with the 50% Fibonacci retracement.
High Risk Investment Warning
Stratos Markets Limited fxcm.com Stratos Europe Ltd fxcm.com
CFDs are complex instruments and come with a high risk of losing money rapidly due to leverage. 69% of retail investor accounts lose money when trading CFDs with this provider. You should consider whether you understand how CFDs work and whether you can afford to take the high risk of losing your money.
Stratos Global LLC fxcm.com Losses can exceed deposits.
Please be advised that the information presented on TradingView is provided to FXCM (‘Company’, ‘we’) by a third-party provider (‘TFA Global Pte Ltd’). Please be reminded that you are solely responsible for the trading decisions on your account. Any information and/or content is intended entirely for research, educational and informational purposes only and does not constitute investment or consultation advice or investment strategy. The information is not tailored to the investment needs of any specific person and therefore does not involve a consideration of any of the investment objectives, financial situation or needs of any viewer that may receive it. Past performance is not a reliable indicator of future results. Actual results may differ materially from those anticipated in forward-looking or past performance statements. We assume no liability as to the accuracy or completeness of any of the information and/or content provided herein and the Company cannot be held responsible for any omission, mistake nor for any loss or damage including without limitation to any loss of profit which may arise from reliance on any information supplied by TFA Global Pte Ltd.
Stratos Trading Pty. Limited fxcm.com
Trading FX/CFDs carries significant risks. FXCM AU (AFSL 309763), please read the Financial Services Guide, Product Disclosure Statement, Target Market Determination and Terms of Business at fxcm.com

CADJPY - Price Is At A Strong Resistance (Supply Zone)CADJPY remains in an uptrend channel, but price is testing a key weekly resistance and supply zone.
Bias: watch for short setups, anticipating a near-term pullback.

GBPJPY WILL GROW|LONG|
✅GBPJPY retraces into a key demand PD array after strong bullish expansion. Holding discount levels keeps the higher-timeframe structure intact, favoring a continuation toward buy-side liquidity above. Time Frame 5H.
LONG🚀
✅Like and subscribe to never miss a new idea!✅

GOLD Buyers In Panic! SELL!
My dear subscribers,
GOLD looks like it will make a good move, and here are the details:
The market is trading on 4862.6 pivot level.
Bias - Bearish
My Stop Loss - 4893.5
Technical Indicators: Both Super Trend & Pivot HL indicate a highly probable Bearish continuation.
Target - 4806.5
About Used Indicators:
The average true range (ATR) plays an important role in 'Supertrend' as the indicator uses ATR to calculate its value. The ATR indicator signals the degree of price volatility.
Disclosure: I am part of Trade Nation's Influencer program and receive a monthly fee for using their TradingView charts in my analysis.
———————————
WISH YOU ALL LUCK

BUY XAUUSDGold is approaching a key demand zone around 4672 after an extended short-term sell-off, where price previously reacted and liquidity is likely resting. This area sits near structural support and comes after bearish momentum that looks stretched, making it a logical place for buyers to step in if rejection appears. If price slows into the zone and prints bullish reaction candles or a short-term structure shift on lower timeframes, it would support a corrective rebound toward the higher resistance area marked above, favoring a tactical long setup rather than chasing the breakdown lower.

XAGUSD Bearish Continuation ......This is a 2-hour (H2) XAGUSD (Silver vs USD) chart showing a full market cycle: accumulation → bullish trend → breakdown → bearish continuation.
Key structure & concepts shown:
Range / Accumulation (Left side)
Price consolidates in a marked range, indicating accumulation and liquidity build-up.
Bullish Channel (Markup Phase)
Price breaks out and trends higher within a clean ascending channel, respecting dynamic support and resistance.
Trend Failure & Breakdown
Price loses the channel support and breaks below the prior range base (marked as Breakdown), signaling a bearish market structure shift.
Strong Impulsive Sell-Off
Large bearish candles show aggressive distribution and momentum to the downside.
Fair Value Gap (FVG) / Supply Zone Retest
Price retraces into the highlighted FVG / supply zone, where selling pressure is expected to step in again.
Bearish Continuation Target
A projected downside target is marked at prior demand/liquidity levels, suggesting continuation of the bearish leg after the pullback.
