GBPJPY H4 | Potential bearish reversalBased on the H4 chart analysis, we could see the price rise to the sell entry, which is a pullback resistance that aligns with the 50% Fibonacci retracement and could reverse from this level to the downside.
Sell entry is at 200.05, which is a pullback resistance that aligns with the 50% Fibonacci retracement.
Stop loss is at 201.22, which acts as a swing high resistance.
Take profit is at 198.03, which is a multi swing low support that is slightly below the 161.8% Fibonacci extension.
High Risk Investment Warning
Trading Forex/CFDs on margin carries a high level of risk and may not be suitable for all investors. Leverage can work against you.
Stratos Markets Limited (tradu.com ):
CFDs are complex instruments and come with a high risk of losing money rapidly due to leverage. 65% of retail investor accounts lose money when trading CFDs with this provider. You should consider whether you understand how CFDs work and whether you can afford to take the high risk of losing your money.
Stratos Europe Ltd (tradu.com ):
CFDs are complex instruments and come with a high risk of losing money rapidly due to leverage. 66% of retail investor accounts lose money when trading CFDs with this provider. You should consider whether you understand how CFDs work and whether you can afford to take the high risk of losing your money.
Stratos Global LLC (tradu.com ):
Losses can exceed deposits.
Please be advised that the information presented on TradingView is provided to Tradu (‘Company’, ‘we’) by a third-party provider (‘TFA Global Pte Ltd’). Please be reminded that you are solely responsible for the trading decisions on your account. There is a very high degree of risk involved in trading. Any information and/or content is intended entirely for research, educational and informational purposes only and does not constitute investment or consultation advice or investment strategy. The information is not tailored to the investment needs of any specific person and therefore does not involve a consideration of any of the investment objectives, financial situation or needs of any viewer that may receive it. Kindly also note that past performance is not a reliable indicator of future results. Actual results may differ materially from those anticipated in forward-looking or past performance statements. We assume no liability as to the accuracy or completeness of any of the information and/or content provided herein and the Company cannot be held responsible for any omission, mistake nor for any loss or damage including without limitation to any loss of profit which may arise from reliance on any information supplied by TFA Global Pte Ltd.
The speaker(s) is neither an employee, agent nor representative of Tradu and is therefore acting independently. The opinions given are their own, constitute general market commentary, and do not constitute the opinion or advice of Tradu or any form of personal or investment advice. Tradu neither endorses nor guarantees offerings of third-party speakers, nor is Tradu responsible for the content, veracity or opinions of third-party speakers, presenters or participants.
Forexsignals

KIWI H4 | Could we see a bullish reversal?The price is falling towards the buy entry which is a pullback support and could bounce from this level to the upside.
Buy entry is at 0.5837, which is a pullback support.
Stop loss is at 0.5784, which aligns with the 127.2% Fibonacci extension.
Take profit is at 0.5913, which is a pullback resistance level.
High Risk Investment Warning
Trading Forex/CFDs on margin carries a high level of risk and may not be suitable for all investors. Leverage can work against you.
Stratos Markets Limited (tradu.com ):
CFDs are complex instruments and come with a high risk of losing money rapidly due to leverage. 65% of retail investor accounts lose money when trading CFDs with this provider. You should consider whether you understand how CFDs work and whether you can afford to take the high risk of losing your money.
Stratos Europe Ltd (tradu.com ):
CFDs are complex instruments and come with a high risk of losing money rapidly due to leverage. 66% of retail investor accounts lose money when trading CFDs with this provider. You should consider whether you understand how CFDs work and whether you can afford to take the high risk of losing your money.
Stratos Global LLC (tradu.com ):
Losses can exceed deposits.
Please be advised that the information presented on TradingView is provided to Tradu (‘Company’, ‘we’) by a third-party provider (‘TFA Global Pte Ltd’). Please be reminded that you are solely responsible for the trading decisions on your account. There is a very high degree of risk involved in trading. Any information and/or content is intended entirely for research, educational and informational purposes only and does not constitute investment or consultation advice or investment strategy. The information is not tailored to the investment needs of any specific person and therefore does not involve a consideration of any of the investment objectives, financial situation or needs of any viewer that may receive it. Kindly also note that past performance is not a reliable indicator of future results. Actual results may differ materially from those anticipated in forward-looking or past performance statements. We assume no liability as to the accuracy or completeness of any of the information and/or content provided herein and the Company cannot be held responsible for any omission, mistake nor for any loss or damage including without limitation to any loss of profit which may arise from reliance on any information supplied by TFA Global Pte Ltd.
The speaker(s) is neither an employee, agent nor representative of Tradu and is therefore acting independently. The opinions given are their own, constitute general market commentary, and do not constitute the opinion or advice of Tradu or any form of personal or investment advice. Tradu neither endorses nor guarantees offerings of third-party speakers, nor is Tradu responsible for the content, veracity or opinions of third-party speakers, presenters or participants.

AUDUSD H4 | Bullish reversalThe Aussie (AUD/USD) is falling towards the buy entry, which is a pullback support that aligns with the 61.8% and the 50% Fibonacci retracement and could bounce from this level to the upside.
Buy entry is at 0.6567, which is a pullback support that aligns with the 61.8% and the 50% Fibonacci retracement.
Stop loss is at 0.6511, which is a pullback support that is slightly below the 61.8% Fibonacci retracement.
Take profit is at 0.6636, which is a pullback resistance.
High Risk Investment Warning
Trading Forex/CFDs on margin carries a high level of risk and may not be suitable for all investors. Leverage can work against you.
Stratos Markets Limited (tradu.com ):
CFDs are complex instruments and come with a high risk of losing money rapidly due to leverage. 65% of retail investor accounts lose money when trading CFDs with this provider. You should consider whether you understand how CFDs work and whether you can afford to take the high risk of losing your money.
Stratos Europe Ltd (tradu.com ):
CFDs are complex instruments and come with a high risk of losing money rapidly due to leverage. 66% of retail investor accounts lose money when trading CFDs with this provider. You should consider whether you understand how CFDs work and whether you can afford to take the high risk of losing your money.
Stratos Global LLC (tradu.com ):
Losses can exceed deposits.
Please be advised that the information presented on TradingView is provided to Tradu (‘Company’, ‘we’) by a third-party provider (‘TFA Global Pte Ltd’). Please be reminded that you are solely responsible for the trading decisions on your account. There is a very high degree of risk involved in trading. Any information and/or content is intended entirely for research, educational and informational purposes only and does not constitute investment or consultation advice or investment strategy. The information is not tailored to the investment needs of any specific person and therefore does not involve a consideration of any of the investment objectives, financial situation or needs of any viewer that may receive it. Kindly also note that past performance is not a reliable indicator of future results. Actual results may differ materially from those anticipated in forward-looking or past performance statements. We assume no liability as to the accuracy or completeness of any of the information and/or content provided herein and the Company cannot be held responsible for any omission, mistake nor for any loss or damage including without limitation to any loss of profit which may arise from reliance on any information supplied by TFA Global Pte Ltd.
The speaker(s) is neither an employee, agent nor representative of Tradu and is therefore acting independently. The opinions given are their own, constitute general market commentary, and do not constitute the opinion or advice of Tradu or any form of personal or investment advice. Tradu neither endorses nor guarantees offerings of third-party speakers, nor is Tradu responsible for the content, veracity or opinions of third-party speakers, presenters or participants.

USDJPY H4 | Approaching major resistanceUSD/JPY is rising towards the sell entry which acts as a pullback resistance that aligns with the 127.2% Fibonacci extension and the 61.8% Fibonacci projection, and could reverse from this level to the take profit.
Sell entry is at 148.84, which is a pullback resistance that aligns with the 127.2% Fibonacci extension and the 61.8% Fibonacci projection.
Stop loss is at 150.72, which is a swing high resistance.
Take profit is at 147.44, which is a pullback support level.
High Risk Investment Warning
Trading Forex/CFDs on margin carries a high level of risk and may not be suitable for all investors. Leverage can work against you.
Stratos Markets Limited (tradu.com ):
CFDs are complex instruments and come with a high risk of losing money rapidly due to leverage. 65% of retail investor accounts lose money when trading CFDs with this provider. You should consider whether you understand how CFDs work and whether you can afford to take the high risk of losing your money.
Stratos Europe Ltd (tradu.com ):
CFDs are complex instruments and come with a high risk of losing money rapidly due to leverage. 66% of retail investor accounts lose money when trading CFDs with this provider. You should consider whether you understand how CFDs work and whether you can afford to take the high risk of losing your money.
Stratos Global LLC (tradu.com ):
Losses can exceed deposits.
Please be advised that the information presented on TradingView is provided to Tradu (‘Company’, ‘we’) by a third-party provider (‘TFA Global Pte Ltd’). Please be reminded that you are solely responsible for the trading decisions on your account. There is a very high degree of risk involved in trading. Any information and/or content is intended entirely for research, educational and informational purposes only and does not constitute investment or consultation advice or investment strategy. The information is not tailored to the investment needs of any specific person and therefore does not involve a consideration of any of the investment objectives, financial situation or needs of any viewer that may receive it. Kindly also note that past performance is not a reliable indicator of future results. Actual results may differ materially from those anticipated in forward-looking or past performance statements. We assume no liability as to the accuracy or completeness of any of the information and/or content provided herein and the Company cannot be held responsible for any omission, mistake nor for any loss or damage including without limitation to any loss of profit which may arise from reliance on any information supplied by TFA Global Pte Ltd.
The speaker(s) is neither an employee, agent nor representative of Tradu and is therefore acting independently. The opinions given are their own, constitute general market commentary, and do not constitute the opinion or advice of Tradu or any form of personal or investment advice. Tradu neither endorses nor guarantees offerings of third-party speakers, nor is Tradu responsible for the content, veracity or opinions of third-party speakers, presenters or participants.

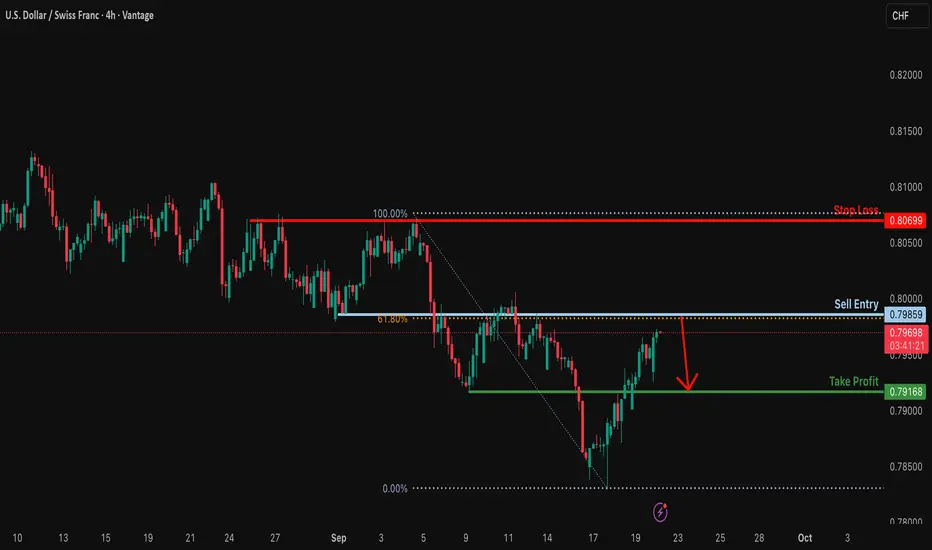
USDCHF H4 | Bearish reversalUSD/CHF is rising towards the sell entry, which is an overlap resistance that aligns with the 61.8% Fibonacci retracement and oculd reverse from this level to the downside.
Sell entry is at 0.7985, which is an overlap resistance that aligns with the 61.8% Fibonacci retracement.
Stop loss is at 0.8066, which is a swing high resistance.
Take profit is at 0.7918, which is a pullback support level.
High Risk Investment Warning
Trading Forex/CFDs on margin carries a high level of risk and may not be suitable for all investors. Leverage can work against you.
Stratos Markets Limited (tradu.com ):
CFDs are complex instruments and come with a high risk of losing money rapidly due to leverage. 65% of retail investor accounts lose money when trading CFDs with this provider. You should consider whether you understand how CFDs work and whether you can afford to take the high risk of losing your money.
Stratos Europe Ltd (tradu.com ):
CFDs are complex instruments and come with a high risk of losing money rapidly due to leverage. 66% of retail investor accounts lose money when trading CFDs with this provider. You should consider whether you understand how CFDs work and whether you can afford to take the high risk of losing your money.
Stratos Global LLC (tradu.com ):
Losses can exceed deposits.
Please be advised that the information presented on TradingView is provided to Tradu (‘Company’, ‘we’) by a third-party provider (‘TFA Global Pte Ltd’). Please be reminded that you are solely responsible for the trading decisions on your account. There is a very high degree of risk involved in trading. Any information and/or content is intended entirely for research, educational and informational purposes only and does not constitute investment or consultation advice or investment strategy. The information is not tailored to the investment needs of any specific person and therefore does not involve a consideration of any of the investment objectives, financial situation or needs of any viewer that may receive it. Kindly also note that past performance is not a reliable indicator of future results. Actual results may differ materially from those anticipated in forward-looking or past performance statements. We assume no liability as to the accuracy or completeness of any of the information and/or content provided herein and the Company cannot be held responsible for any omission, mistake nor for any loss or damage including without limitation to any loss of profit which may arise from reliance on any information supplied by TFA Global Pte Ltd.
The speaker(s) is neither an employee, agent nor representative of Tradu and is therefore acting independently. The opinions given are their own, constitute general market commentary, and do not constitute the opinion or advice of Tradu or any form of personal or investment advice. Tradu neither endorses nor guarantees offerings of third-party speakers, nor is Tradu responsible for the content, veracity or opinions of third-party speakers, presenters or participants.

GBPUSD H4 | Bearish drop from resistanceGBP/USD is rising towards the sell entry, which is a pullback resistance and could drop from this level to the downside.
Sell entry is at 1.3512, which is a pullback resistance level.
Stop loss is at 1.3911, which is a pullback resistance.
Take profit is at 1.3394, which is a pullback support.
High Risk Investment Warning
Trading Forex/CFDs on margin carries a high level of risk and may not be suitable for all investors. Leverage can work against you.
Stratos Markets Limited (tradu.com ):
CFDs are complex instruments and come with a high risk of losing money rapidly due to leverage. 65% of retail investor accounts lose money when trading CFDs with this provider. You should consider whether you understand how CFDs work and whether you can afford to take the high risk of losing your money.
Stratos Europe Ltd (tradu.com ):
CFDs are complex instruments and come with a high risk of losing money rapidly due to leverage. 66% of retail investor accounts lose money when trading CFDs with this provider. You should consider whether you understand how CFDs work and whether you can afford to take the high risk of losing your money.
Stratos Global LLC (tradu.com ):
Losses can exceed deposits.
Please be advised that the information presented on TradingView is provided to Tradu (‘Company’, ‘we’) by a third-party provider (‘TFA Global Pte Ltd’). Please be reminded that you are solely responsible for the trading decisions on your account. There is a very high degree of risk involved in trading. Any information and/or content is intended entirely for research, educational and informational purposes only and does not constitute investment or consultation advice or investment strategy. The information is not tailored to the investment needs of any specific person and therefore does not involve a consideration of any of the investment objectives, financial situation or needs of any viewer that may receive it. Kindly also note that past performance is not a reliable indicator of future results. Actual results may differ materially from those anticipated in forward-looking or past performance statements. We assume no liability as to the accuracy or completeness of any of the information and/or content provided herein and the Company cannot be held responsible for any omission, mistake nor for any loss or damage including without limitation to any loss of profit which may arise from reliance on any information supplied by TFA Global Pte Ltd.
The speaker(s) is neither an employee, agent nor representative of Tradu and is therefore acting independently. The opinions given are their own, constitute general market commentary, and do not constitute the opinion or advice of Tradu or any form of personal or investment advice. Tradu neither endorses nor guarantees offerings of third-party speakers, nor is Tradu responsible for the content, veracity or opinions of third-party speakers, presenters or participants.

EURUSD H4 | Bearish drop confirmedEUR/USD has reacted off the sell entry which is a pullback resistance that aligns with the 23.6% Fibonacci retracement and oculd drop from this levle to the take profit.
Sell entry is at 1.1773, which is a pullback resistance that lines up with the 23.6% Fibonacci retracement.
Stop loss is at 1.1867, which is a pullback resistance that is slightly above the 61.8% FIbonacci retracement.
Take profit is at 1.1678, whichis an overlap support that aligns with the 78.6% Fibonacci retracement.
High Risk Investment Warning
Trading Forex/CFDs on margin carries a high level of risk and may not be suitable for all investors. Leverage can work against you.
Stratos Markets Limited (tradu.com ):
CFDs are complex instruments and come with a high risk of losing money rapidly due to leverage. 65% of retail investor accounts lose money when trading CFDs with this provider. You should consider whether you understand how CFDs work and whether you can afford to take the high risk of losing your money.
Stratos Europe Ltd (tradu.com ):
CFDs are complex instruments and come with a high risk of losing money rapidly due to leverage. 66% of retail investor accounts lose money when trading CFDs with this provider. You should consider whether you understand how CFDs work and whether you can afford to take the high risk of losing your money.
Stratos Global LLC (tradu.com ):
Losses can exceed deposits.
Please be advised that the information presented on TradingView is provided to Tradu (‘Company’, ‘we’) by a third-party provider (‘TFA Global Pte Ltd’). Please be reminded that you are solely responsible for the trading decisions on your account. There is a very high degree of risk involved in trading. Any information and/or content is intended entirely for research, educational and informational purposes only and does not constitute investment or consultation advice or investment strategy. The information is not tailored to the investment needs of any specific person and therefore does not involve a consideration of any of the investment objectives, financial situation or needs of any viewer that may receive it. Kindly also note that past performance is not a reliable indicator of future results. Actual results may differ materially from those anticipated in forward-looking or past performance statements. We assume no liability as to the accuracy or completeness of any of the information and/or content provided herein and the Company cannot be held responsible for any omission, mistake nor for any loss or damage including without limitation to any loss of profit which may arise from reliance on any information supplied by TFA Global Pte Ltd.
The speaker(s) is neither an employee, agent nor representative of Tradu and is therefore acting independently. The opinions given are their own, constitute general market commentary, and do not constitute the opinion or advice of Tradu or any form of personal or investment advice. Tradu neither endorses nor guarantees offerings of third-party speakers, nor is Tradu responsible for the content, veracity or opinions of third-party speakers, presenters or participants.

Heading into major resistance?USD/CAD is rising towards the resistance level, which is a pullback resistance that aligns with the 127.2% Fibonacci extension and could potentially drop from this level to our take profit.
Entry: 148.88
Why we like it:
There is a pullback resistance level that aligns with the 127.2% Fibonacci extension.
Stop loss: 150.74
Why we like it:
There is a swing high resistance level.
Take profit: 147.08
Why we like it:
There is a pullback support level.
Enjoying your TradingView experience? Review us!
Please be advised that the information presented on TradingView is provided to Vantage (‘Vantage Global Limited’, ‘we’) by a third-party provider (‘Everest Fortune Group’). Please be reminded that you are solely responsible for the trading decisions on your account. There is a very high degree of risk involved in trading. Any information and/or content is intended entirely for research, educational and informational purposes only and does not constitute investment or consultation advice or investment strategy. The information is not tailored to the investment needs of any specific person and therefore does not involve a consideration of any of the investment objectives, financial situation or needs of any viewer that may receive it. Kindly also note that past performance is not a reliable indicator of future results. Actual results may differ materially from those anticipated in forward-looking or past performance statements. We assume no liability as to the accuracy or completeness of any of the information and/or content provided herein and the Company cannot be held responsible for any omission, mistake nor for any loss or damage including without limitation to any loss of profit which may arise from reliance on any information supplied by Everest Fortune Group.

Could the Swissie reverse from here?USD/CAD is rising towards the resistance level, which is an overlap resistance that aligns with the 61.8% Fibonacci retracement and could reverse from this level to our take-profit.
Entry: 0.7985
Why we like it:
There is an overlap resistance that aligns with the 61.8% Fibonacci retracement.
Stop loss: 0.8069
Why we like it:
There is a pullback resistance level.
Take profit: 0.7916
Why we like it:
There is a pullback support.
Enjoying your TradingView experience? Review us!
Please be advised that the information presented on TradingView is provided to Vantage (‘Vantage Global Limited’, ‘we’) by a third-party provider (‘Everest Fortune Group’). Please be reminded that you are solely responsible for the trading decisions on your account. There is a very high degree of risk involved in trading. Any information and/or content is intended entirely for research, educational and informational purposes only and does not constitute investment or consultation advice or investment strategy. The information is not tailored to the investment needs of any specific person and therefore does not involve a consideration of any of the investment objectives, financial situation or needs of any viewer that may receive it. Kindly also note that past performance is not a reliable indicator of future results. Actual results may differ materially from those anticipated in forward-looking or past performance statements. We assume no liability as to the accuracy or completeness of any of the information and/or content provided herein and the Company cannot be held responsible for any omission, mistake nor for any loss or damage including without limitation to any loss of profit which may arise from reliance on any information supplied by Everest Fortune Group.
Potential bearish drop off?GBP/USD is rising towards the resistance level, which acts as a pullback resistance and could drop from this level to our take profit.
Entry: 1.3512
Why we like it:
There is a pullback resistance level.
Stop loss: 1.3666
Why we like it:
There is a pullback resistance.
Take profit: 1.3366
Why we like it:
There is an overlap support.
Enjoying your TradingView experience? Review us!
Please be advised that the information presented on TradingView is provided to Vantage (‘Vantage Global Limited’, ‘we’) by a third-party provider (‘Everest Fortune Group’). Please be reminded that you are solely responsible for the trading decisions on your account. There is a very high degree of risk involved in trading. Any information and/or content is intended entirely for research, educational and informational purposes only and does not constitute investment or consultation advice or investment strategy. The information is not tailored to the investment needs of any specific person and therefore does not involve a consideration of any of the investment objectives, financial situation or needs of any viewer that may receive it. Kindly also note that past performance is not a reliable indicator of future results. Actual results may differ materially from those anticipated in forward-looking or past performance statements. We assume no liability as to the accuracy or completeness of any of the information and/or content provided herein and the Company cannot be held responsible for any omission, mistake nor for any loss or damage including without limitation to any loss of profit which may arise from reliance on any information supplied by Everest Fortune Group.

Bearish drop off?EUR/USD has reacted off the resistance level which is a pullback resistance and could drop from this level to our take profit.
Entry: 1.1774
Why we like it:
There is a pullback resistance.
Stop loss: 1.1866
Why we like it:
There is a pullback resistance level.
Take profit: 1.1614
Why we like it:
There is a pullback support level.
Enjoying your TradingView experience? Review us!
Please be advised that the information presented on TradingView is provided to Vantage (‘Vantage Global Limited’, ‘we’) by a third-party provider (‘Everest Fortune Group’). Please be reminded that you are solely responsible for the trading decisions on your account. There is a very high degree of risk involved in trading. Any information and/or content is intended entirely for research, educational and informational purposes only and does not constitute investment or consultation advice or investment strategy. The information is not tailored to the investment needs of any specific person and therefore does not involve a consideration of any of the investment objectives, financial situation or needs of any viewer that may receive it. Kindly also note that past performance is not a reliable indicator of future results. Actual results may differ materially from those anticipated in forward-looking or past performance statements. We assume no liability as to the accuracy or completeness of any of the information and/or content provided herein and the Company cannot be held responsible for any omission, mistake nor for any loss or damage including without limitation to any loss of profit which may arise from reliance on any information supplied by Everest Fortune Group.

Xauusd Short Market 15MinGold positive upwards before a small native pullback. I seem to have projection of 3676 run. Trade with Risk

Bearish continuation for the Swissie?The price is rising towards the pivot which aligns with the 61.8% Fibonacci retracement and could reverse to the pullback support.
Pivot: 0.8027
1st Support: 0.7853
1st Resistance: 0.8169
Disclaimer:
The above opinions given constitute general market commentary, and do not constitute the opinion or advice of IC Markets or any form of personal or investment advice.
Any opinions, news, research, analyses, prices, other information, or links to third-party sites contained on this website are provided on an "as-is" basis, are intended only to be informative, is not an advice nor a recommendation, nor research, or a record of our trading prices, or an offer of, or solicitation for a transaction in any financial instrument and thus should not be treated as such. The information provided does not involve any specific investment objectives, financial situation and needs of any specific person who may receive it. Please be aware, that past performance is not a reliable indicator of future performance and/or results. Past Performance or Forward-looking scenarios based upon the reasonable beliefs of the third-party provider are not a guarantee of future performance. Actual results may differ materially from those anticipated in forward-looking or past performance statements. IC Markets makes no representation or warranty and assumes no liability as to the accuracy or completeness of the information provided, nor any loss arising from any investment based on a recommendation, forecast or any information supplied by any third-party.

Bullish bounce off major support?The Loonie (USD/CAD) is reacting off the pivot, which acts as an overlap support and could bounce to the 1st resistance, which is an overlap resistance that is slightly below the 50% Fibonacci retracement.
Pivot: 1.3755
1st Support: 1.3568
1st Resistance: 1.4015
Disclaimer:
The above opinions given constitute general market commentary, and do not constitute the opinion or advice of IC Markets or any form of personal or investment advice.
Any opinions, news, research, analyses, prices, other information, or links to third-party sites contained on this website are provided on an "as-is" basis, are intended only to be informative, is not an advice nor a recommendation, nor research, or a record of our trading prices, or an offer of, or solicitation for a transaction in any financial instrument and thus should not be treated as such. The information provided does not involve any specific investment objectives, financial situation and needs of any specific person who may receive it. Please be aware, that past performance is not a reliable indicator of future performance and/or results. Past Performance or Forward-looking scenarios based upon the reasonable beliefs of the third-party provider are not a guarantee of future performance. Actual results may differ materially from those anticipated in forward-looking or past performance statements. IC Markets makes no representation or warranty and assumes no liability as to the accuracy or completeness of the information provided, nor any loss arising from any investment based on a recommendation, forecast or any information supplied by any third-party.

Bullish reversal?USD/JPY has bounced off the pivot which acts as an overlap support and could rise to the 1st resistance.
Pivot: 146.62
1st Support: 144.86
1st Resistance: 150.96
Disclaimer:
The above opinions given constitute general market commentary, and do not constitute the opinion or advice of IC Markets or any form of personal or investment advice.
Any opinions, news, research, analyses, prices, other information, or links to third-party sites contained on this website are provided on an "as-is" basis, are intended only to be informative, is not an advice nor a recommendation, nor research, or a record of our trading prices, or an offer of, or solicitation for a transaction in any financial instrument and thus should not be treated as such. The information provided does not involve any specific investment objectives, financial situation and needs of any specific person who may receive it. Please be aware, that past performance is not a reliable indicator of future performance and/or results. Past Performance or Forward-looking scenarios based upon the reasonable beliefs of the third-party provider are not a guarantee of future performance. Actual results may differ materially from those anticipated in forward-looking or past performance statements. IC Markets makes no representation or warranty and assumes no liability as to the accuracy or completeness of the information provided, nor any loss arising from any investment based on a recommendation, forecast or any information supplied by any third-party.

Bearish drop off?The Kiwi (NZD/USD) has reacted off the pivot and could drop to the 1st support, which is a pullback support that is slightly above the 127.2% Fibonacci extension.
Pivot: 0.5937
1st Support: 0.5789
1st Resistance: 0.6047
Disclaimer:
The above opinions given constitute general market commentary, and do not constitute the opinion or advice of IC Markets or any form of personal or investment advice.
Any opinions, news, research, analyses, prices, other information, or links to third-party sites contained on this website are provided on an "as-is" basis, are intended only to be informative, is not an advice nor a recommendation, nor research, or a record of our trading prices, or an offer of, or solicitation for a transaction in any financial instrument and thus should not be treated as such. The information provided does not involve any specific investment objectives, financial situation and needs of any specific person who may receive it. Please be aware, that past performance is not a reliable indicator of future performance and/or results. Past Performance or Forward-looking scenarios based upon the reasonable beliefs of the third-party provider are not a guarantee of future performance. Actual results may differ materially from those anticipated in forward-looking or past performance statements. IC Markets makes no representation or warranty and assumes no liability as to the accuracy or completeness of the information provided, nor any loss arising from any investment based on a recommendation, forecast or any information supplied by any third-party.

GOLD INTRESTED NEXT WEEK IN BULLISH OR BEARISH ? Obviously Bullish 📌
Gold Buy Zones
OB+ 3622 Buying Area To Hold For Much Profitsss
Targets 100 Pips
Targets 500 Pips
Good Luck With Your Trading 🤞

Explaining the Lower Timeframe Function and Its Role in Trading Introduction
Candlesticks on higher timeframes summarize long periods of trading activity, but they hide the internal balance of buying and selling. A daily candle, for instance, may show only a strong close, while in reality buyers and sellers may have fought much more evenly. To uncover this hidden structure, Pine Script offers the requestUpAndDownVolume() function, which retrieves up-volume, down-volume, and delta from a chosen lower timeframe (LTF).
Function in Practice
By applying this function, traders can measure how much of a move was supported by genuine buying pressure and how much came from selling pressure. The function works across timeframes: when analyzing a daily chart, one can select a one-minute or one-second LTF to see how the volume was distributed within each daily bar . This approach reveals details that are invisible on the higher timeframe alone.
Helper for Data Coverage
Lower-timeframe data comes with strict limitations. A one-second chart may only cover a few hours of history, while a one-minute chart can stretch much further back. To make this limitation transparent, a helper was implemented in our code: it shows explicitly how far the available LTF data extends . Instead of assuming full coverage, the trader knows the exact portion of the higher bar that is represented.
//══════════════
// Volume — Lower TF Up/Down
//══════════════
int global_volume_period = input.int(20, minval=1, title="Global Volume Period", tooltip="Shared lookback for ALL volume calculations (e.g., averages/sums).", group=grpVolume)
bool use_custom_tf_input = input.bool(true, "Use custom lower timeframe", tooltip="Override the automatically chosen lower timeframe for volume calculations.", group=grpVolume)
string custom_tf_input = input.timeframe("1", "Lower timeframe", tooltip="Lower timeframe used for up/down volume calculations.", group=grpVolume)
import TradingView/ta/10 as tvta
resolve_lower_tf(bool useCustom, string customTF) =>
useCustom ? customTF :
timeframe.isseconds ? "1S" :
timeframe.isintraday ? "1" :
timeframe.isdaily ? "5" : "60"
get_up_down_volume(string lowerTf) =>
= tvta.requestUpAndDownVolume(lowerTf)
var float upVolume = na
var float downVolume = na
var float deltaVolume = na
string lower_tf = resolve_lower_tf(use_custom_tf_input, custom_tf_input)
= get_up_down_volume(lower_tf)
upVolume := u_tmp
downVolume := d_tmp
deltaVolume := dl_tmp
//──── LTF coverage counter — counts chart bars with valid Up/Down (non-na) 〔Hazel-lite〕
var int ltf_total_bars = 0
var int last_valid_bar_index = na // new: remember the bar_index of the last valid LTF bar
if not na(deltaVolume)
ltf_total_bars += 1
last_valid_bar_index := bar_index
int ltf_safe_window = ltf_total_bars
var label ltf_cov_label = na // label handle for the “coverage” marker
Use in Strategy Development
Because both the main function and the helper for data coverage have been implemented in our work, we use the Hazel-nut BB Volume strategy here as a practical example to illustrate the subject. This strategy serves only as a framework to show how lower-timeframe volume analysis affects higher-timeframe charts. In the following sections, several charts will be presented and briefly explained to demonstrate these effects in practice.
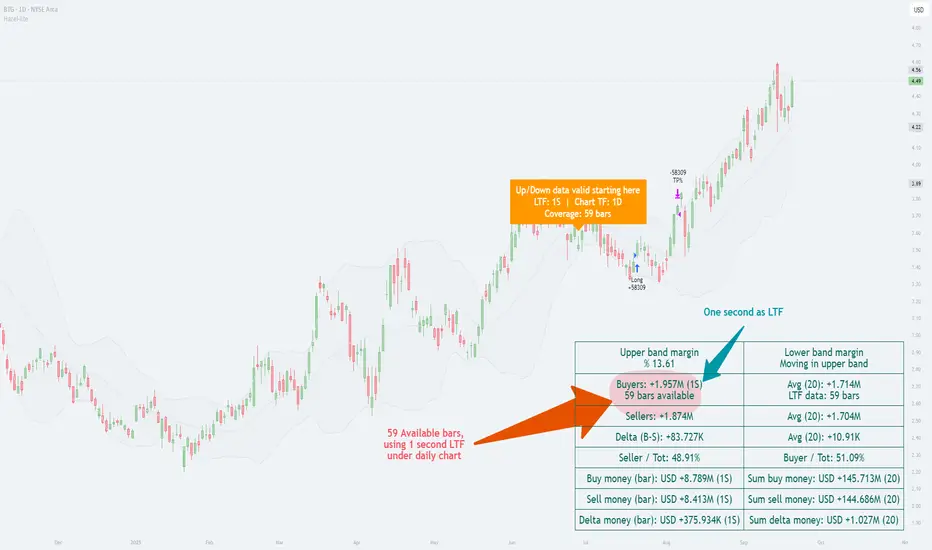
In this example, the daily chart is used as the main timeframe, while a one-second lower timeframe (LTF) has been applied to examine the internal volume distribution. The helper clearly indicates that only 59 one-second bars are available for this daily candle. This is critical, because it shows the analysis is based on a partial window of intraday data rather than a full day.
The up/down volume split reveals that buyers accounted for about 1.957 million units versus sellers with 1.874 million, producing a positive delta of roughly +83,727. In percentage terms, buyers held a slight edge (≈51%), while sellers were close behind (≈49%). This near balance demonstrates how the daily candle’s bullish appearance was built on only a modest dominance by buyers.
By presenting both the margin values (e.g., upper band margin 13.61%) and the absolute money flow, the chart connects higher-timeframe Bollinger Band context with the micro-timeframe order flow. The annotation “Up/Down data valid starting here” reinforces the importance of the helper: it alerts the user that valid LTF volume coverage begins from a specific point, preventing misinterpretation of missing data.
In short, this chart illustrates how choosing a very fine LTF (1 second) can reveal subtle buyer–seller dynamics, while at the same time highlighting the limitation of short data availability. It is a practical case of the principle described earlier—lower-timeframe insight enriches higher-timeframe context, but only within the boundary of available bars.
Analysis with One-Minute LTF
In this chart, the daily timeframe remains the base, but the lower timeframe (LTF) has been shifted to one minute. The helper indicates that data coverage extends across 353 daily bars, a much deeper historical window than in the one-second example. This means we can evaluate buyer/seller balance over nearly a full year of daily candles rather than just a short slice of history.
The up/down split shows buyers at ≈2.019M and sellers at ≈1.812M, producing a positive delta of +206,223. Here, buyers hold about 52.7%, compared to sellers at 47.3%. This stronger bias toward buyers contrasts with the previous chart, where the one-second LTF produced only a slim delta of +83,727 and ratios closer to 51%/49%.
Comparison with the One-Second LTF Chart
Data coverage: 1s gave 59 daily bars of usable history; 1m extends that to 353 bars.
Delta magnitude: 1s produced a modest delta (+83k), reflecting very fine-grained noise; 1m smooths those micro-fluctuations into a larger, clearer delta (+206k).
Interpretation: The 1s chart highlighted short-term balance, almost evenly split. The 1m chart, backed by longer history, paints a more decisive picture of buyer strength.
Key Takeaway
This comparison underscores the trade-off: the lower the LTF, the higher the detail but the shorter the history; the higher the LTF, the broader the historical coverage but at the cost of microscopic precision. The helper function bridges this gap by making the coverage explicit, ensuring traders know exactly what their analysis is built on.
Impact of TradingView Plan Levels
Another factor shaping the use of this function is the user’s access to data. TradingView accounts differ in how much intraday history they provide and which intervals are unlocked.
◉ On the free plan, the smallest available interval is one minute, with a few months of intraday history.
◉ Paid plans unlock second-based charts, but even then, history is measured in hours or days, not months.
◉ Higher tiers extend the number of bars that can be loaded per chart, which becomes relevant when pulling large volumes of lower-timeframe data into higher-timeframe studies
Conclusion
With requestUpAndDownVolume(), it becomes possible to see how each symbol behaves internally across different timeframes. The helper function makes clear where the data stops, preventing misinterpretation. By applying this setup within strategies like Hazel-nut BB Volume, one can demonstrate how changing the lower timeframe directly alters the picture seen on higher charts. In this way, the function is not just a technical option but a bridge between detail and context.
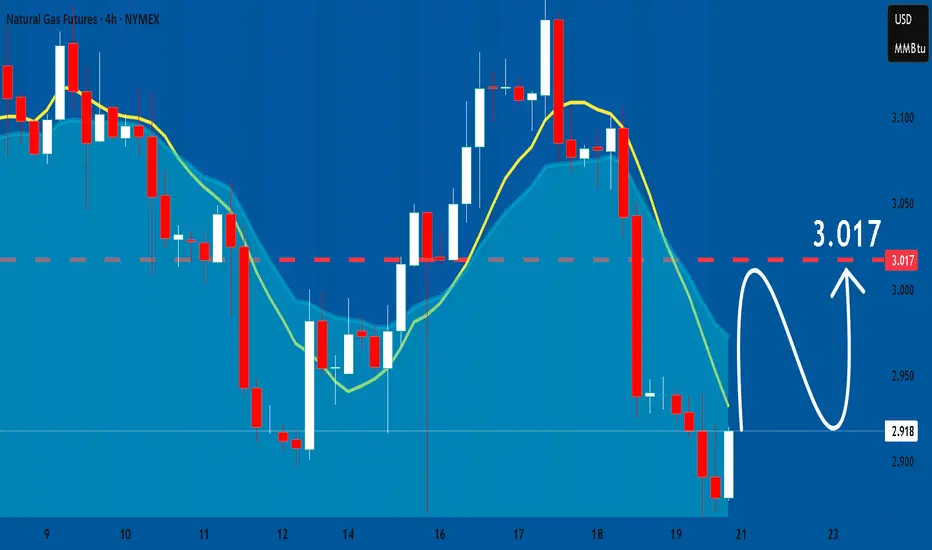
NATGAS: Growth & Bullish Forecast
Balance of buyers and sellers on the NATGAS pair, that is best felt when all the timeframes are analyzed properly is shifting in favor of the buyers, therefore is it only natural that we go long on the pair.
Disclosure: I am part of Trade Nation's Influencer program and receive a monthly fee for using their TradingView charts in my analysis.
❤️ Please, support our work with like & comment! ❤️
XAU/USD – Captain Vincent Weekly Plan🔎 Captain’s Log – Context
📈 Main Trend : Strong uptrend after BoS.
📊 Price moving sideways within the rising channel, staying below Weak High 3674 .
📌 EMA 50 > EMA 200 → bullish trend remains solid.
🎯 Captain’s Map – Trading Scenarios
1️⃣ Golden Harbor (BUY – Main Priority)
🎯 Entry:
FVG Dock: 3602 – 3593
FVG Deep: 3567 – 3560
OB Harbor: 3535 – 3540
⛔ SL: below 3520
✅ TP1: 3674 (sweep Weak High)
✅ TP2: 3720 – 3740
2️⃣ Quick Boarding (Short-term SELL – Counter-trend)
Condition: If price breaks 3674 first → watch for false break.
🎯 Entry: 3670 – 3680
✅ TP: back to 3602 – 3567
⚠️ Note : scalp only, don’t hold long.
3️⃣ Storm Breaker Alert (Bearish Scenario)
If 3535 breaks → short-term uptrend invalidated.
🎯 Bearish target: 3480 – 3500
Captain’s Note ⚓
“The golden sail still catches the wind after BoS, leading the captain and crew on the bullish tide. Golden Harbor 🏝️ (3593 – 3560 – 3535) remains the preferred docking point to load cargo and continue the voyage. Quick Boarding 🚤 at Storm Breaker 🌊 (3670 – 3680) is only a short ride when the ship sweeps liquidity at Weak High 3674 . Should 3535 break, the ship might be dragged toward 3480 – 3500, but as long as it anchors at Golden Harbor, the grand journey still heads north toward 3720+.”

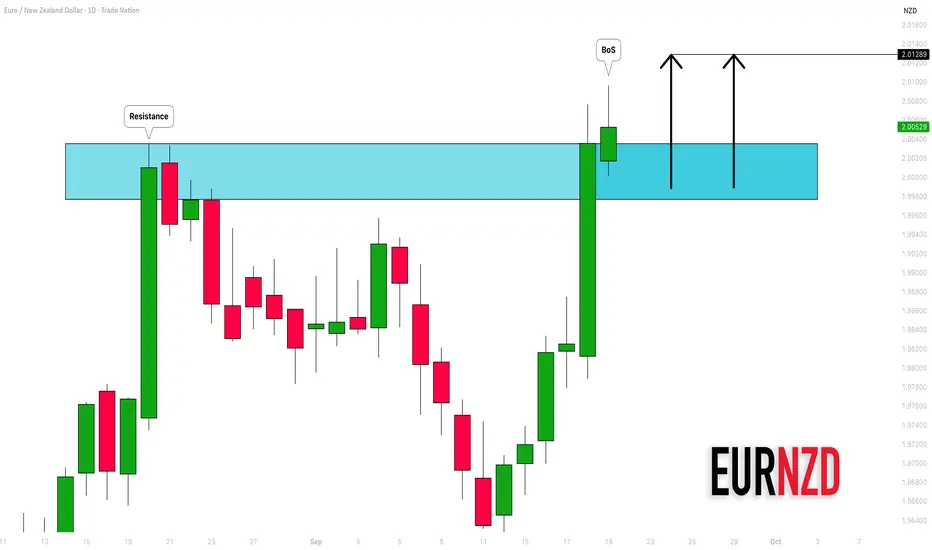
EURNZD: Confirmed Break of Structure?! 🇪🇺🇳🇿
EURNZD broke and closed above a key daily horizontal resistance,
setting a new higher high higher close with a confirmed BoS.
With a high probability, the market will grow more.
Next resistance - 2.0128
❤️Please, support my work with like, thank you!❤️
I am part of Trade Nation's Influencer program and receive a monthly fee for using their TradingView charts in my analysis.
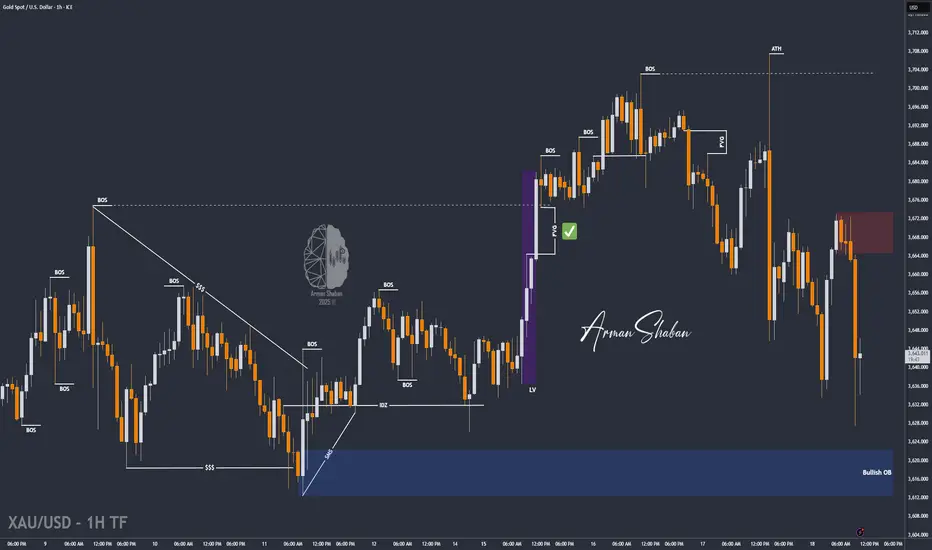
XAU/USD | GOLD ATH at $3,707, Then Heavy Dump – What Happend?By analyzing the gold chart on the 1-hour timeframe, we can see that after the Fed rate cut announcement, the price first dropped from $3,686 to $3,649, stopping out many buyers. Then, gold rallied sharply, gaining 570 pips up to $3,707 and printing a new ATH, which stopped out sellers. After that, the market turned again, with another heavy drop that stopped out fresh buyers too.
As I mentioned yesterday, this move was expected. Many asked why gold dropped despite the rate cut — the reason is that the news was already priced in last month. The market had anticipated the cut, which is why gold had already rallied earlier, and that’s why we saw this sharp drop after the announcement.
Currently, gold is trading around $3,637 after falling to $3,627. I expect this decline to continue toward the next target zone at $3,612–$3,622. Once price reaches that level, we’ll review the next scenario. The key supply zones to watch are $3,667, $3,677, $3,684, and $3,691.
I hope this analysis was helpful for you — stay tuned for more setups based on this outlook!
Please support me with your likes and comments to motivate me to share more analysis with you and share your opinion about the possible trend of this chart with me !
Best Regards , Arman Shaban
EUR/USD - Rising Wedge Breakout @ H1 CMCMARKETS:EURUSD EUR/USD - Wedge Pattern Strong breakout - @ H1 with high volume. Expecting Strong Bearish outlook today and Fundamental also play major role today.
"The Fed is still signalling more rate cuts, but at the same time still sees okay growth, which is a positive combination for share markets"
The Fed reduced rates by a quarter point on Wednesday, as expected, and indicated it will steadily lower borrowing costs for the rest of this year, initially sending the dollar plunging.
Support by Likes and Comments.
Thank you.
