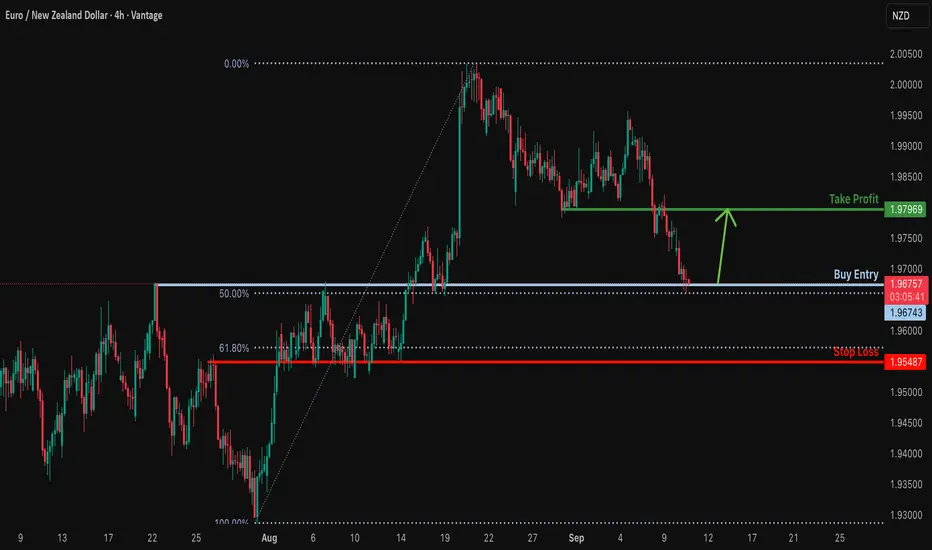
Is the market setting up for a bullish reversal?EUR/NZD is reacting off the support level, which is an overlap support that lines up with the 50% Fibonacci retracement and could bounce from this level to our take profit.
Entry: 1.9674
Why we like it:
There is an overlap support level that aligns with the 50% Fibonacci retracement.
Stop loss: 1.9548
Why we like it:
There is an overlap support that is slightly below the 61.8% Fibonacci retracement.
Take profit: 1.9796
Why we like it:
There is a pullback resistance level.
Enjoying your TradingView experience? Review us!
Please be advised that the information presented on TradingView is provided to Vantage (‘Vantage Global Limited’, ‘we’) by a third-party provider (‘Everest Fortune Group’). Please be reminded that you are solely responsible for the trading decisions on your account. There is a very high degree of risk involved in trading. Any information and/or content is intended entirely for research, educational and informational purposes only and does not constitute investment or consultation advice or investment strategy. The information is not tailored to the investment needs of any specific person and therefore does not involve a consideration of any of the investment objectives, financial situation or needs of any viewer that may receive it. Kindly also note that past performance is not a reliable indicator of future results. Actual results may differ materially from those anticipated in forward-looking or past performance statements. We assume no liability as to the accuracy or completeness of any of the information and/or content provided herein and the Company cannot be held responsible for any omission, mistake nor for any loss or damage including without limitation to any loss of profit which may arise from reliance on any information supplied by Everest Fortune Group.
Forexsignals
Breakout signals bullish rise?NZD/CHF has broken out of the resistance level, which is a pullback resistance, and could potentially rise from this level to our take profit.
Entry: 0.4729
Why we like it:
There is a pullback resistance level.
Stop loss: 0.4690
Why we like it:
There is a pullback support level.
Take profit: 0.4794
Why we like it:
There is an overlap resistance that aligns with the 78.6% Fibonacci retracement.
Enjoying your TradingView experience? Review us!
Please be advised that the information presented on TradingView is provided to Vantage (‘Vantage Global Limited’, ‘we’) by a third-party provider (‘Everest Fortune Group’). Please be reminded that you are solely responsible for the trading decisions on your account. There is a very high degree of risk involved in trading. Any information and/or content is intended entirely for research, educational and informational purposes only and does not constitute investment or consultation advice or investment strategy. The information is not tailored to the investment needs of any specific person and therefore does not involve a consideration of any of the investment objectives, financial situation or needs of any viewer that may receive it. Kindly also note that past performance is not a reliable indicator of future results. Actual results may differ materially from those anticipated in forward-looking or past performance statements. We assume no liability as to the accuracy or completeness of any of the information and/or content provided herein and the Company cannot be held responsible for any omission, mistake nor for any loss or damage including without limitation to any loss of profit which may arise from reliance on any information supplied by Everest Fortune Group.

Long EUR/NOKLong EUR/NOK
Recommend going long EUR/NOK:
Entry: 11.6
Target: 12.10
Stop: 11.49
Recent NOK strength looks exhausted as global risk appetite softens, Fed rate cut expectations appear overstretched, and seasonal/political uncertainties weigh on NOK. Rising yields linked to deficit concerns and oversold conditions in EUR/NOK strengthen the case for a rebound. The risk-reward favors a long position, though a sharp recovery in risk appetite remains the main downside risk.
Don’t forget to like and share your thoughts in the comments! ❤️

EUR/USD | Euro Rejected, Eyeing 1.168 & 1.166 (READ THE CAPTION)By analyzing the EUR/USD chart on the 4-hour timeframe, we can see that the price started to drop as expected, correcting down to 1.168. After that move, demand stepped in, and now the pair is trading around 1.1716.
If the price manages to stay below 1.174, we could see another bearish move. The possible downside targets are 1.168 and 1.166. Key supply zones are 1.174–1.178 and 1.179–1.1810.
Please support me with your likes and comments to motivate me to share more analysis with you and share your opinion about the possible trend of this chart with me !
Best Regards , Arman Shaban

Gold - Caution ahead of US PPI report | Priority on Sell setups🟡 XAU/USD – 10/09 | Captain Vincent ⚓
🔎 Captain’s Log – Market Context
US 10-year bond yields rebound, signaling the market is awaiting key inflation data.
At 07:30, US PPI report will be released – a crucial figure that could strongly influence FED rate expectations.
Investors are also eyeing US CPI in the coming days to assess the inflation outlook.
The US Supreme Court accepted Trump’s appeal, but this news has not yet had a notable impact on Gold.
⏩ Captain’s Summary: Ahead of inflation data, Gold often tends to correct lower due to cautious sentiment.
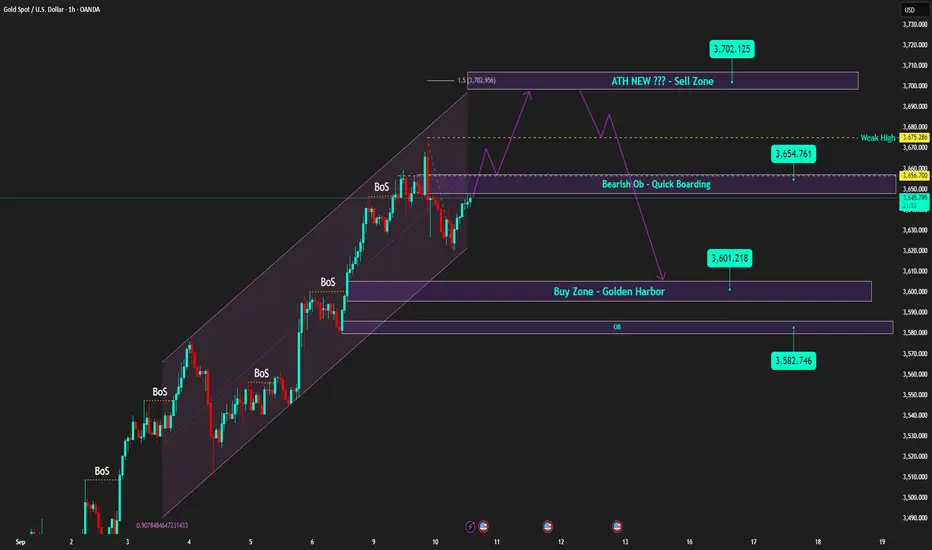
📈 Captain’s Chart – Technical Analysis
Storm Breaker (Key Resistance):
Bearish OB: 3654 – 3660 (short-term upper cap)
ATH Watchtower: 3700 – 3702 (Sell Zone – possible new ATH test)
Golden Harbor (Strong Support):
Buy Zone: 3601 – 3602
OB Dock: 3582 – 3585
Currently, price is around 3640 – 3645, after a technical rebound from support. High probability that Gold will retest nearby resistance before a downward correction.
🎯 Captain’s Map – Trade Scenarios
⚡ Quick Boarding (SELL – Daily Priority)
Entry 1: 3654 – 3660
SL: 3668
TP: 3654 → 3650 → 3618 → 3610
Entry 2 – ATH Test: 3701 – 3703
SL: 3711
TP: 3688 → 3675 → 3665 → 365x
✅ Golden Harbor (BUY – Only at deep support)
Buy Zone: 3601 – 3603
SL: 3592
TP: 3610 → 3620 → 3630
⚓ Captain’s Note
“The golden ship faces turbulent seas today as it sails near Storm Breaker 🌊 (3654 – 3660) . Before the fierce winds called US PPI , sailors should prioritize dropping anchor with short-term SELL positions at resistance. Golden Harbor 🏝️ (3601 – 3603) remains a safe haven below, but only when the ship corrects deeply should it dock. On this voyage, Quick Boarding 🚤 is for scalp maneuvers, while the main current is still steered by the stormy waves of inflation.”
EURJPY: Test of Critical Demand Zone 🇪🇺🇯🇵
EURJPY is stuck on a major daily horizontal demand zone.
A recent breakout of a resistance line of a falling parallel channel
on an hourly time frame indicates an intraday strength of the buyers.
I will expect a pullback at least to 173.0 level.
❤️Please, support my work with like, thank you!❤️
I am part of Trade Nation's Influencer program and receive a monthly fee for using their TradingView charts in my analysis.

USDCAD H4 | Bearish reversal off overlap resistanceUSD/CAD is reacting off the sell entry which is an overlap resistance that lines up with the 61.8% Fibonacci retracement and could reverse from this level to the take profit.
Sell entry is at 1.3856, which is an overlap resistance that lines up with the 61.8% Fibonacci retracement.
Stop loss is at 1.3918, which is a swing high resistance that lines up with the 100% Fibonacci projection.
Take profit is at 1.3791, which is a pullback support that aligns with the 50% Fibonacci retracement.
High Risk Investment Warning
Trading Forex/CFDs on margin carries a high level of risk and may not be suitable for all investors. Leverage can work against you.
Stratos Markets Limited (tradu.com ):
CFDs are complex instruments and come with a high risk of losing money rapidly due to leverage. 65% of retail investor accounts lose money when trading CFDs with this provider. You should consider whether you understand how CFDs work and whether you can afford to take the high risk of losing your money.
Stratos Europe Ltd (tradu.com ):
CFDs are complex instruments and come with a high risk of losing money rapidly due to leverage. 66% of retail investor accounts lose money when trading CFDs with this provider. You should consider whether you understand how CFDs work and whether you can afford to take the high risk of losing your money.
Stratos Global LLC (tradu.com ):
Losses can exceed deposits.
Please be advised that the information presented on TradingView is provided to Tradu (‘Company’, ‘we’) by a third-party provider (‘TFA Global Pte Ltd’). Please be reminded that you are solely responsible for the trading decisions on your account. There is a very high degree of risk involved in trading. Any information and/or content is intended entirely for research, educational and informational purposes only and does not constitute investment or consultation advice or investment strategy. The information is not tailored to the investment needs of any specific person and therefore does not involve a consideration of any of the investment objectives, financial situation or needs of any viewer that may receive it. Kindly also note that past performance is not a reliable indicator of future results. Actual results may differ materially from those anticipated in forward-looking or past performance statements. We assume no liability as to the accuracy or completeness of any of the information and/or content provided herein and the Company cannot be held responsible for any omission, mistake nor for any loss or damage including without limitation to any loss of profit which may arise from reliance on any information supplied by TFA Global Pte Ltd.
The speaker(s) is neither an employee, agent nor representative of Tradu and is therefore acting independently. The opinions given are their own, constitute general market commentary, and do not constitute the opinion or advice of Tradu or any form of personal or investment advice. Tradu neither endorses nor guarantees offerings of third-party speakers, nor is Tradu responsible for the content, veracity or opinions of third-party speakers, presenters or participants.

NZDUSD H4 | Bullish riseThe Kiwi (NZD/USD) has bounced off the buy entry which is a pullback support that aligns with the 23.6% Fibonacci retracement and could rise from tis level to the upside.
By entry is at 0.5926, which is a pullback support that lines up wit he 23.6% Fibonacci retracement.
Stop loss is at 0.5900, which is a pullback support that align with the 38.2% Fibonacci retracement.
Take profit is at 0.5984, which acts a a swing high resistance.
High Risk Investment Warning
Trading Forex/CFDs on margin carries a high level of risk and may not be suitable for all investors. Leverage can work against you.
Stratos Markets Limited (tradu.com ):
CFDs are complex instruments and come with a high risk of losing money rapidly due to leverage. 65% of retail investor accounts lose money when trading CFDs with this provider. You should consider whether you understand how CFDs work and whether you can afford to take the high risk of losing your money.
Stratos Europe Ltd (tradu.com ):
CFDs are complex instruments and come with a high risk of losing money rapidly due to leverage. 66% of retail investor accounts lose money when trading CFDs with this provider. You should consider whether you understand how CFDs work and whether you can afford to take the high risk of losing your money.
Stratos Global LLC (tradu.com ):
Losses can exceed deposits.
Please be advised that the information presented on TradingView is provided to Tradu (‘Company’, ‘we’) by a third-party provider (‘TFA Global Pte Ltd’). Please be reminded that you are solely responsible for the trading decisions on your account. There is a very high degree of risk involved in trading. Any information and/or content is intended entirely for research, educational and informational purposes only and does not constitute investment or consultation advice or investment strategy. The information is not tailored to the investment needs of any specific person and therefore does not involve a consideration of any of the investment objectives, financial situation or needs of any viewer that may receive it. Kindly also note that past performance is not a reliable indicator of future results. Actual results may differ materially from those anticipated in forward-looking or past performance statements. We assume no liability as to the accuracy or completeness of any of the information and/or content provided herein and the Company cannot be held responsible for any omission, mistake nor for any loss or damage including without limitation to any loss of profit which may arise from reliance on any information supplied by TFA Global Pte Ltd.
The speaker(s) is neither an employee, agent nor representative of Tradu and is therefore acting independently. The opinions given are their own, constitute general market commentary, and do not constitute the opinion or advice of Tradu or any form of personal or investment advice. Tradu neither endorses nor guarantees offerings of third-party speakers, nor is Tradu responsible for the content, veracity or opinions of third-party speakers, presenters or participants.

EURUSD – Weakness Ahead?For over a month, EURUSD has been stuck in a choppy range:
• Support: 1.1580 zone
• Resistance: just above 1.1700
As always, such tight consolidations usually precede strong moves. The question is: which way?
🔑 Factors pointing lower:
1. On the DXY, I expect a potential upside reversal – most bad news is already priced in.
2. Yesterday’s reaction to the NFP revision → USD strength, not weakness, which confirms the shift in sentiment.
3. A false break above resistance on EURUSD adds to the bearish case.
📌 Conclusion:
I expect further EURUSD weakness, with confirmation if the price breaks below 1.1650.

USDJPY H1 | Bullish bounce offUSD/JPY has bounced off the buy entry, which is a pullback support, and could rise from this level to the upside.
Buy entry is at 147.22, which is a pullbacksupport.
Stop loss is at 146.84, which is a pullback support.
Take profit is at 147.90, which is a pullback resistance.
High Risk Investment Warning
Trading Forex/CFDs on margin carries a high level of risk and may not be suitable for all investors. Leverage can work against you.
Stratos Markets Limited (tradu.com ):
CFDs are complex instruments and come with a high risk of losing money rapidly due to leverage. 65% of retail investor accounts lose money when trading CFDs with this provider. You should consider whether you understand how CFDs work and whether you can afford to take the high risk of losing your money.
Stratos Europe Ltd (tradu.com ):
CFDs are complex instruments and come with a high risk of losing money rapidly due to leverage. 66% of retail investor accounts lose money when trading CFDs with this provider. You should consider whether you understand how CFDs work and whether you can afford to take the high risk of losing your money.
Stratos Global LLC (tradu.com ):
Losses can exceed deposits.
Please be advised that the information presented on TradingView is provided to Tradu (‘Company’, ‘we’) by a third-party provider (‘TFA Global Pte Ltd’). Please be reminded that you are solely responsible for the trading decisions on your account. There is a very high degree of risk involved in trading. Any information and/or content is intended entirely for research, educational and informational purposes only and does not constitute investment or consultation advice or investment strategy. The information is not tailored to the investment needs of any specific person and therefore does not involve a consideration of any of the investment objectives, financial situation or needs of any viewer that may receive it. Kindly also note that past performance is not a reliable indicator of future results. Actual results may differ materially from those anticipated in forward-looking or past performance statements. We assume no liability as to the accuracy or completeness of any of the information and/or content provided herein and the Company cannot be held responsible for any omission, mistake nor for any loss or damage including without limitation to any loss of profit which may arise from reliance on any information supplied by TFA Global Pte Ltd.
The speaker(s) is neither an employee, agent nor representative of Tradu and is therefore acting independently. The opinions given are their own, constitute general market commentary, and do not constitute the opinion or advice of Tradu or any form of personal or investment advice. Tradu neither endorses nor guarantees offerings of third-party speakers, nor is Tradu responsible for the content, veracity or opinions of third-party speakers, presenters or participants.

USDCHF H1 | Bearish reversal off 50% Fibonacci resistanceUSD/CHF is rising towards the sell entry which is an overlap resistance that aligns with the 50% Fibonacci retracement and could reverse from this level to the take profit.
Sell entry is at 0.7994, which is an overlap resistance that aligns witht he 50% Fibonacci retracemnt.
Stop loss is at 0.8025, which is a pullback resistance.
Take profit is at 0.7945, which is a pullback support.
High Risk Investment Warning
Trading Forex/CFDs on margin carries a high level of risk and may not be suitable for all investors. Leverage can work against you.
Stratos Markets Limited (tradu.com ):
CFDs are complex instruments and come with a high risk of losing money rapidly due to leverage. 65% of retail investor accounts lose money when trading CFDs with this provider. You should consider whether you understand how CFDs work and whether you can afford to take the high risk of losing your money.
Stratos Europe Ltd (tradu.com ):
CFDs are complex instruments and come with a high risk of losing money rapidly due to leverage. 66% of retail investor accounts lose money when trading CFDs with this provider. You should consider whether you understand how CFDs work and whether you can afford to take the high risk of losing your money.
Stratos Global LLC (tradu.com ):
Losses can exceed deposits.
Please be advised that the information presented on TradingView is provided to Tradu (‘Company’, ‘we’) by a third-party provider (‘TFA Global Pte Ltd’). Please be reminded that you are solely responsible for the trading decisions on your account. There is a very high degree of risk involved in trading. Any information and/or content is intended entirely for research, educational and informational purposes only and does not constitute investment or consultation advice or investment strategy. The information is not tailored to the investment needs of any specific person and therefore does not involve a consideration of any of the investment objectives, financial situation or needs of any viewer that may receive it. Kindly also note that past performance is not a reliable indicator of future results. Actual results may differ materially from those anticipated in forward-looking or past performance statements. We assume no liability as to the accuracy or completeness of any of the information and/or content provided herein and the Company cannot be held responsible for any omission, mistake nor for any loss or damage including without limitation to any loss of profit which may arise from reliance on any information supplied by TFA Global Pte Ltd.
The speaker(s) is neither an employee, agent nor representative of Tradu and is therefore acting independently. The opinions given are their own, constitute general market commentary, and do not constitute the opinion or advice of Tradu or any form of personal or investment advice. Tradu neither endorses nor guarantees offerings of third-party speakers, nor is Tradu responsible for the content, veracity or opinions of third-party speakers, presenters or participants.

CABLE H1 | Bearish drop off?Based on the H1 chart analysis, we could see the price rise to the sell entry which is a pullback resistance that aligns with the 50% Fibonacci retracementand could drop from this leve to the donwnside.
Sell entry is at 1.3549, which is a pullback resistance that lines up with the 50% Fibonacci retracemnt.
Stop loss is at 1.3590, which is a swinghigh resistance.
Take profit is at 1.3486, which is a pullback support that is slightly below the 38.2% Fibonacci retracement.
High Risk Investment Warning
Trading Forex/CFDs on margin carries a high level of risk and may not be suitable for all investors. Leverage can work against you.
Stratos Markets Limited (tradu.com ):
CFDs are complex instruments and come with a high risk of losing money rapidly due to leverage. 65% of retail investor accounts lose money when trading CFDs with this provider. You should consider whether you understand how CFDs work and whether you can afford to take the high risk of losing your money.
Stratos Europe Ltd (tradu.com ):
CFDs are complex instruments and come with a high risk of losing money rapidly due to leverage. 66% of retail investor accounts lose money when trading CFDs with this provider. You should consider whether you understand how CFDs work and whether you can afford to take the high risk of losing your money.
Stratos Global LLC (tradu.com ):
Losses can exceed deposits.
Please be advised that the information presented on TradingView is provided to Tradu (‘Company’, ‘we’) by a third-party provider (‘TFA Global Pte Ltd’). Please be reminded that you are solely responsible for the trading decisions on your account. There is a very high degree of risk involved in trading. Any information and/or content is intended entirely for research, educational and informational purposes only and does not constitute investment or consultation advice or investment strategy. The information is not tailored to the investment needs of any specific person and therefore does not involve a consideration of any of the investment objectives, financial situation or needs of any viewer that may receive it. Kindly also note that past performance is not a reliable indicator of future results. Actual results may differ materially from those anticipated in forward-looking or past performance statements. We assume no liability as to the accuracy or completeness of any of the information and/or content provided herein and the Company cannot be held responsible for any omission, mistake nor for any loss or damage including without limitation to any loss of profit which may arise from reliance on any information supplied by TFA Global Pte Ltd.
The speaker(s) is neither an employee, agent nor representative of Tradu and is therefore acting independently. The opinions given are their own, constitute general market commentary, and do not constitute the opinion or advice of Tradu or any form of personal or investment advice. Tradu neither endorses nor guarantees offerings of third-party speakers, nor is Tradu responsible for the content, veracity or opinions of third-party speakers, presenters or participants.

CABLE H4 | Bearish drop offBased on the H1 chart analysis, we could see the price rise to the sell entry which acts as a pullback resistance that aligns with the 50% Fibonacci retracement and could drop from this level to the downside.
Sell entry is at 1.3549, which is a pullback resistance that aligns with he 50% Fibonacci retracement.
Stop loss is at 1.3590, which is a swing high resistance.
Take profit is at 1.3486, whic is a pullback support that is slightly below the 38.2% Fibonacci retracement.
High Risk Investment Warning
Trading Forex/CFDs on margin carries a high level of risk and may not be suitable for all investors. Leverage can work against you.
Stratos Markets Limited (tradu.com):
CFDs are complex instruments and come with a high risk of losing money rapidly due to leverage. 65% of retail investor accounts lose money when trading CFDs with this provider. You should consider whether you understand how CFDs work and whether you can afford to take the high risk of losing your money.
Stratos Europe Ltd (tradu.com ):
CFDs are complex instruments and come with a high risk of losing money rapidly due to leverage. 66% of retail investor accounts lose money when trading CFDs with this provider. You should consider whether you understand how CFDs work and whether you can afford to take the high risk of losing your money.
Stratos Global LLC (tradu.com ):
Losses can exceed deposits.
Please be advised that the information presented on TradingView is provided to Tradu (‘Company’, ‘we’) by a third-party provider (‘TFA Global Pte Ltd’). Please be reminded that you are solely responsible for the trading decisions on your account. There is a very high degree of risk involved in trading. Any information and/or content is intended entirely for research, educational and informational purposes only and does not constitute investment or consultation advice or investment strategy. The information is not tailored to the investment needs of any specific person and therefore does not involve a consideration of any of the investment objectives, financial situation or needs of any viewer that may receive it. Kindly also note that past performance is not a reliable indicator of future results. Actual results may differ materially from those anticipated in forward-looking or past performance statements. We assume no liability as to the accuracy or completeness of any of the information and/or content provided herein and the Company cannot be held responsible for any omission, mistake nor for any loss or damage including without limitation to any loss of profit which may arise from reliance on any information supplied by TFA Global Pte Ltd.
The speaker(s) is neither an employee, agent nor representative of Tradu and is therefore acting independently. The opinions given are their own, constitute general market commentary, and do not constitute the opinion or advice of Tradu or any form of personal or investment advice. Tradu neither endorses nor guarantees offerings of third-party speakers, nor is Tradu responsible for the content, veracity or opinions of third-party speakers, presenters or participants.

EURUSD H4 | Bearish dropEUR/USD is rising towards the sell entry, which is a pullback resistance that aligns with the 50% Fibonacci retracement and could reverse from this level to the downside.
Sell entry is at 1.1737, which is a pullback resistance that aligns with the 50% Fibonacci retracement.
Stop loss is at 1.1780, which is a multi swing high resistance.
Take profit is at 1.1615, which is a pullback support.
High Risk Investment Warning
Trading Forex/CFDs on margin carries a high level of risk and may not be suitable for all investors. Leverage can work against you.
Stratos Markets Limited (tradu.com ):
CFDs are complex instruments and come with a high risk of losing money rapidly due to leverage. 65% of retail investor accounts lose money when trading CFDs with this provider. You should consider whether you understand how CFDs work and whether you can afford to take the high risk of losing your money.
Stratos Europe Ltd (tradu.com ):
CFDs are complex instruments and come with a high risk of losing money rapidly due to leverage. 66% of retail investor accounts lose money when trading CFDs with this provider. You should consider whether you understand how CFDs work and whether you can afford to take the high risk of losing your money.
Stratos Global LLC (tradu.com ):
Losses can exceed deposits.
Please be advised that the information presented on TradingView is provided to Tradu (‘Company’, ‘we’) by a third-party provider (‘TFA Global Pte Ltd’). Please be reminded that you are solely responsible for the trading decisions on your account. There is a very high degree of risk involved in trading. Any information and/or content is intended entirely for research, educational and informational purposes only and does not constitute investment or consultation advice or investment strategy. The information is not tailored to the investment needs of any specific person and therefore does not involve a consideration of any of the investment objectives, financial situation or needs of any viewer that may receive it. Kindly also note that past performance is not a reliable indicator of future results. Actual results may differ materially from those anticipated in forward-looking or past performance statements. We assume no liability as to the accuracy or completeness of any of the information and/or content provided herein and the Company cannot be held responsible for any omission, mistake nor for any loss or damage including without limitation to any loss of profit which may arise from reliance on any information supplied by TFA Global Pte Ltd.
The speaker(s) is neither an employee, agent nor representative of Tradu and is therefore acting independently. The opinions given are their own, constitute general market commentary, and do not constitute the opinion or advice of Tradu or any form of personal or investment advice. Tradu neither endorses nor guarantees offerings of third-party speakers, nor is Tradu responsible for the content, veracity or opinions of third-party speakers, presenters or participants.

Bearish reversal?GBP/CHF is rising towards the pivot, which acts as a pullback resistance and could reverse to the 1st support.
Pivot: 1.0827
1st Support: 1.0746
1st Resistance: 1.0861
Disclaimer:
The above opinions given constitute general market commentary, and do not constitute the opinion or advice of IC Markets or any form of personal or investment advice.
Any opinions, news, research, analyses, prices, other information, or links to third-party sites contained on this website are provided on an "as-is" basis, are intended only to be informative, is not an advice nor a recommendation, nor research, or a record of our trading prices, or an offer of, or solicitation for a transaction in any financial instrument and thus should not be treated as such. The information provided does not involve any specific investment objectives, financial situation and needs of any specific person who may receive it. Please be aware, that past performance is not a reliable indicator of future performance and/or results. Past Performance or Forward-looking scenarios based upon the reasonable beliefs of the third-party provider are not a guarantee of future performance. Actual results may differ materially from those anticipated in forward-looking or past performance statements. IC Markets makes no representation or warranty and assumes no liability as to the accuracy or completeness of the information provided, nor any loss arising from any investment based on a recommendation, forecast or any information supplied by any third-party.

Bearish reversal off pullback resistance?EUR/JPY is rising towards the pivot and could reverse to the 1st support.
Pivot: 173.11
1st Support: 172.00
1st Resistance: 173.89
Disclaimer:
The above opinions given constitute general market commentary, and do not constitute the opinion or advice of IC Markets or any form of personal or investment advice.
Any opinions, news, research, analyses, prices, other information, or links to third-party sites contained on this website are provided on an "as-is" basis, are intended only to be informative, is not an advice nor a recommendation, nor research, or a record of our trading prices, or an offer of, or solicitation for a transaction in any financial instrument and thus should not be treated as such. The information provided does not involve any specific investment objectives, financial situation and needs of any specific person who may receive it. Please be aware, that past performance is not a reliable indicator of future performance and/or results. Past Performance or Forward-looking scenarios based upon the reasonable beliefs of the third-party provider are not a guarantee of future performance. Actual results may differ materially from those anticipated in forward-looking or past performance statements. IC Markets makes no representation or warranty and assumes no liability as to the accuracy or completeness of the information provided, nor any loss arising from any investment based on a recommendation, forecast or any information supplied by any third-party.

Potential bullish reversal?EUR/GBP is falling towards the pivot, which serves as a pullback support, and could bounce to the first resistance.
Pivot: 0.86388
1st Support: 0.86221
1st Resistance: 0.86665
Disclaimer:
The above opinions given constitute general market commentary, and do not constitute the opinion or advice of IC Markets or any form of personal or investment advice.
Any opinions, news, research, analyses, prices, other information, or links to third-party sites contained on this website are provided on an "as-is" basis, are intended only to be informative, is not an advice nor a recommendation, nor research, or a record of our trading prices, or an offer of, or solicitation for a transaction in any financial instrument and thus should not be treated as such. The information provided does not involve any specific investment objectives, financial situation and needs of any specific person who may receive it. Please be aware, that past performance is not a reliable indicator of future performance and/or results. Past Performance or Forward-looking scenarios based upon the reasonable beliefs of the third-party provider are not a guarantee of future performance. Actual results may differ materially from those anticipated in forward-looking or past performance statements. IC Markets makes no representation or warranty and assumes no liability as to the accuracy or completeness of the information provided, nor any loss arising from any investment based on a recommendation, forecast or any information supplied by any third-party.

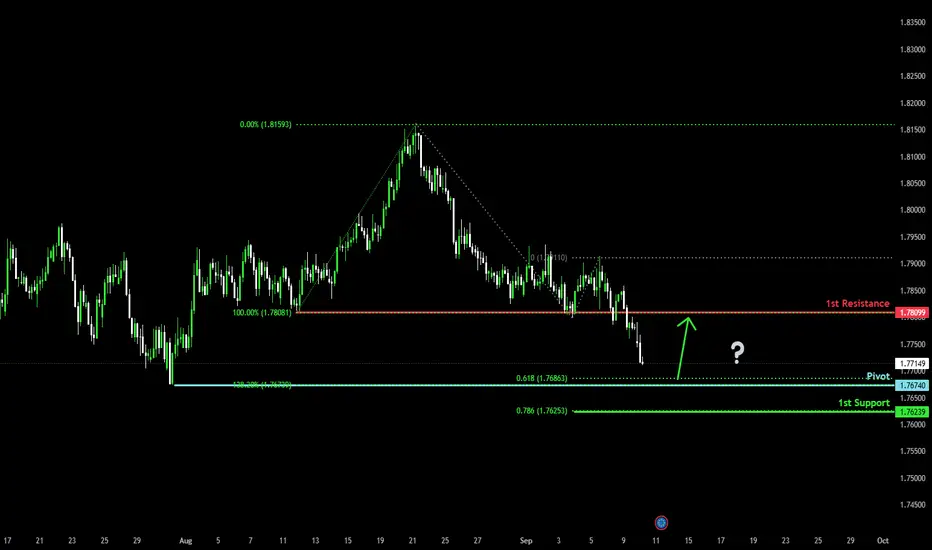
Falling towards swing low support?EUR/AUD is falling towards the pivot, which acts as a swing low support that aligns with the 138.2% Fibonacci extension and the 61.8% Fibonacci projection, and could bounce to the 1st resistance.
Pivot: 1.76740
1st Support: 1.76239
1st Resistance: 1.78099
Disclaimer:
The above opinions given constitute general market commentary, and do not constitute the opinion or advice of IC Markets or any form of personal or investment advice.
Any opinions, news, research, analyses, prices, other information, or links to third-party sites contained on this website are provided on an "as-is" basis, are intended only to be informative, is not an advice nor a recommendation, nor research, or a record of our trading prices, or an offer of, or solicitation for a transaction in any financial instrument and thus should not be treated as such. The information provided does not involve any specific investment objectives, financial situation and needs of any specific person who may receive it. Please be aware, that past performance is not a reliable indicator of future performance and/or results. Past Performance or Forward-looking scenarios based upon the reasonable beliefs of the third-party provider are not a guarantee of future performance. Actual results may differ materially from those anticipated in forward-looking or past performance statements. IC Markets makes no representation or warranty and assumes no liability as to the accuracy or completeness of the information provided, nor any loss arising from any investment based on a recommendation, forecast or any information supplied by any third-party.
XAUUSD sell expectation Gold (XAUUSD) has shown signs of exhaustion after its recent bullish run, with price reacting strongly to multiple fair value gaps (FVG) and resistance zones. The 15-minute chart highlights unmitigated bearish FVGs aligning with higher timeframe supply areas, signaling a potential shift in order flow.
My bearish expectation is that gold will likely respect these supply zones and continue to trade lower toward key support around 3616 – 3580, where liquidity rests. The sell entry is based on the rejection from the 15m FVG, confirming bearish order flow and favoring downside continuation.
Risk management is essential here: stop-loss above the recent supply/FVG zone, while targeting the liquidity pools and imbalance fills below.

Inflation warning is smoldering againIn the world market, the spot gold price decreased by 10.4 USD to around 3,624.6 USD/ounce. In the past 24 hours, the world gold price decreased by 0.06%, but if calculated in the past 30 days, the increase was up to 7.22%.
Notably, gold recorded strong fluctuations after the US announced employment adjustment data. The US Bureau of Labor Statistics (BLS) estimated that total non-agricultural employment as of March 2025 decreased by 911,000 jobs, equivalent to a decrease of 0.6%. This is the worst figure ever recorded, three times the 10-year average.
As soon as the data was announced, the spot gold price skyrocketed to 3,674.69 USD/ounce, but less than 10 minutes later, it fell sharply to 3,643 USD/ounce. The fact that a little-noticed figure is now in the spotlight shows that the market is more sensitive than ever, especially after the sharp job cuts last quarter.

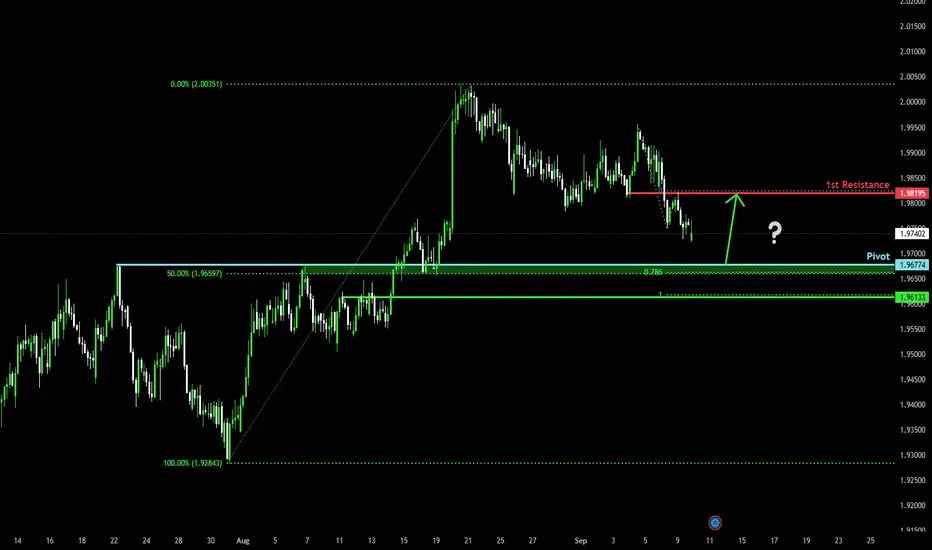
Bullish reversal off overlap support?EUR/NZD is falling towards the pivot and could bounce to the 1st resistance.
Pivot: 1.96774
1st Support: 1.96133
1st Resistance: 1.98195
Disclaimer:
The above opinions given constitute general market commentary, and do not constitute the opinion or advice of IC Markets or any form of personal or investment advice.
Any opinions, news, research, analyses, prices, other information, or links to third-party sites contained on this website are provided on an "as-is" basis, are intended only to be informative, is not an advice nor a recommendation, nor research, or a record of our trading prices, or an offer of, or solicitation for a transaction in any financial instrument and thus should not be treated as such. The information provided does not involve any specific investment objectives, financial situation and needs of any specific person who may receive it. Please be aware, that past performance is not a reliable indicator of future performance and/or results. Past Performance or Forward-looking scenarios based upon the reasonable beliefs of the third-party provider are not a guarantee of future performance. Actual results may differ materially from those anticipated in forward-looking or past performance statements. IC Markets makes no representation or warranty and assumes no liability as to the accuracy or completeness of the information provided, nor any loss arising from any investment based on a recommendation, forecast or any information supplied by any third-party.
Bullish momentum to extend?NZD/JPY is reacting off the pivot which acts as a pullback support and could rise to the 1st resistance.
Pivot: 87.24
1st Support: 86.76
1st Resistance: 88.15
Disclaimer:
The above opinions given constitute general market commentary, and do not constitute the opinion or advice of IC Markets or any form of personal or investment advice.
Any opinions, news, research, analyses, prices, other information, or links to third-party sites contained on this website are provided on an "as-is" basis, are intended only to be informative, is not an advice nor a recommendation, nor research, or a record of our trading prices, or an offer of, or solicitation for a transaction in any financial instrument and thus should not be treated as such. The information provided does not involve any specific investment objectives, financial situation and needs of any specific person who may receive it. Please be aware, that past performance is not a reliable indicator of future performance and/or results. Past Performance or Forward-looking scenarios based upon the reasonable beliefs of the third-party provider are not a guarantee of future performance. Actual results may differ materially from those anticipated in forward-looking or past performance statements. IC Markets makes no representation or warranty and assumes no liability as to the accuracy or completeness of the information provided, nor any loss arising from any investment based on a recommendation, forecast or any information supplied by any third-party.

Bullish rise?NZD/CAD is falling towards the pivot and could potentially rise to the 1st resistance, which acts as a swing high resistance.
Pivot: 0.81917
1st Support: 0.81633
1st Resistance: 0.82550
Disclaimer:
The above opinions given constitute general market commentary, and do not constitute the opinion or advice of IC Markets or any form of personal or investment advice.
Any opinions, news, research, analyses, prices, other information, or links to third-party sites contained on this website are provided on an "as-is" basis, are intended only to be informative, is not an advice nor a recommendation, nor research, or a record of our trading prices, or an offer of, or solicitation for a transaction in any financial instrument and thus should not be treated as such. The information provided does not involve any specific investment objectives, financial situation and needs of any specific person who may receive it. Please be aware, that past performance is not a reliable indicator of future performance and/or results. Past Performance or Forward-looking scenarios based upon the reasonable beliefs of the third-party provider are not a guarantee of future performance. Actual results may differ materially from those anticipated in forward-looking or past performance statements. IC Markets makes no representation or warranty and assumes no liability as to the accuracy or completeness of the information provided, nor any loss arising from any investment based on a recommendation, forecast or any information supplied by any third-party.
