Potential bearish reversal?AUD/JPY is reacting off the resistance level, which is a pullback resistance and could reverse from this level to our take profit.
Entry: 97.26
Why we like it:
There is a pullback resistance level.
Stop loss: 97.90
Why we like it:
There is a resistance level which aligns with the 161.8% Fibonacci extension.
Take profit: 96.18
Why we like it:
There is a pullback support that aligns with the 38.2% Fibonacci retracement.
Enjoying your TradingView experience? Review us!
Please be advised that the information presented on TradingView is provided to Vantage (‘Vantage Global Limited’, ‘we’) by a third-party provider (‘Everest Fortune Group’). Please be reminded that you are solely responsible for the trading decisions on your account. There is a very high degree of risk involved in trading. Any information and/or content is intended entirely for research, educational and informational purposes only and does not constitute investment or consultation advice or investment strategy. The information is not tailored to the investment needs of any specific person and therefore does not involve a consideration of any of the investment objectives, financial situation or needs of any viewer that may receive it. Kindly also note that past performance is not a reliable indicator of future results. Actual results may differ materially from those anticipated in forward-looking or past performance statements. We assume no liability as to the accuracy or completeness of any of the information and/or content provided herein and the Company cannot be held responsible for any omission, mistake nor for any loss or damage including without limitation to any loss of profit which may arise from reliance on any information supplied by Everest Fortune Group.
Forexsignals

Bearish reversal off major resistance?NZD/JPY has rejected off the resistance level, which his an overlap resistance that aligns with the 61.8% Fibonacci projection and could drop from this level to our take profit.
Entry: 87.65
Why we like it:
There is an overlap resistance that aligns with the 61.8% Fibonacci projection.
Stop loss: 86.18
Why we like it:
There is a swing high resistance level.
Take profit: 87.07
Why we like it:
There is a pullback support that aligns with the 61.8% Fibonacci retracement.
Enjoying your TradingView experience? Review us!
Please be advised that the information presented on TradingView is provided to Vantage (‘Vantage Global Limited’, ‘we’) by a third-party provider (‘Everest Fortune Group’). Please be reminded that you are solely responsible for the trading decisions on your account. There is a very high degree of risk involved in trading. Any information and/or content is intended entirely for research, educational and informational purposes only and does not constitute investment or consultation advice or investment strategy. The information is not tailored to the investment needs of any specific person and therefore does not involve a consideration of any of the investment objectives, financial situation or needs of any viewer that may receive it. Kindly also note that past performance is not a reliable indicator of future results. Actual results may differ materially from those anticipated in forward-looking or past performance statements. We assume no liability as to the accuracy or completeness of any of the information and/or content provided herein and the Company cannot be held responsible for any omission, mistake nor for any loss or damage including without limitation to any loss of profit which may arise from reliance on any information supplied by Everest Fortune Group.

World gold price todayGold prices rose steadily in the first trading session of the week in the US, hitting a new contract/historic peak, extending the growth cycle as expectations grew that the US Federal Reserve (Fed) will make three 0.25 percentage point interest rate cuts before the end of 2025.
Friday's jobs report showed the US labor market continued to "cool" in August, with non-farm payrolls increasing by just 22,000 jobs, much lower than the forecast of 75,000 jobs and down sharply from the revised 79,000 jobs in July. The US unemployment rate inched up to 4.3%, the highest since 2021, indicating a slowdown in hiring momentum. The market interpreted the data as meaning the Fed will cut interest rates by at least 0.75% for the rest of the year. Low interest rates are typically supportive of commodity markets, thereby boosting demand.

Bearish setup in play?The Loonie (USD/CAD) has rejected off the pivot and could drop to the 1st support, which acts as a multi-swing low support.
Pivot: 1.3828
1st Support: 1.3729
1st Resistance: 1.3920
Disclaimer:
The above opinions given constitute general market commentary, and do not constitute the opinion or advice of IC Markets or any form of personal or investment advice.
Any opinions, news, research, analyses, prices, other information, or links to third-party sites contained on this website are provided on an "as-is" basis, are intended only to be informative, is not an advice nor a recommendation, nor research, or a record of our trading prices, or an offer of, or solicitation for a transaction in any financial instrument and thus should not be treated as such. The information provided does not involve any specific investment objectives, financial situation and needs of any specific person who may receive it. Please be aware, that past performance is not a reliable indicator of future performance and/or results. Past Performance or Forward-looking scenarios based upon the reasonable beliefs of the third-party provider are not a guarantee of future performance. Actual results may differ materially from those anticipated in forward-looking or past performance statements. IC Markets makes no representation or warranty and assumes no liability as to the accuracy or completeness of the information provided, nor any loss arising from any investment based on a recommendation, forecast or any information supplied by any third-party.

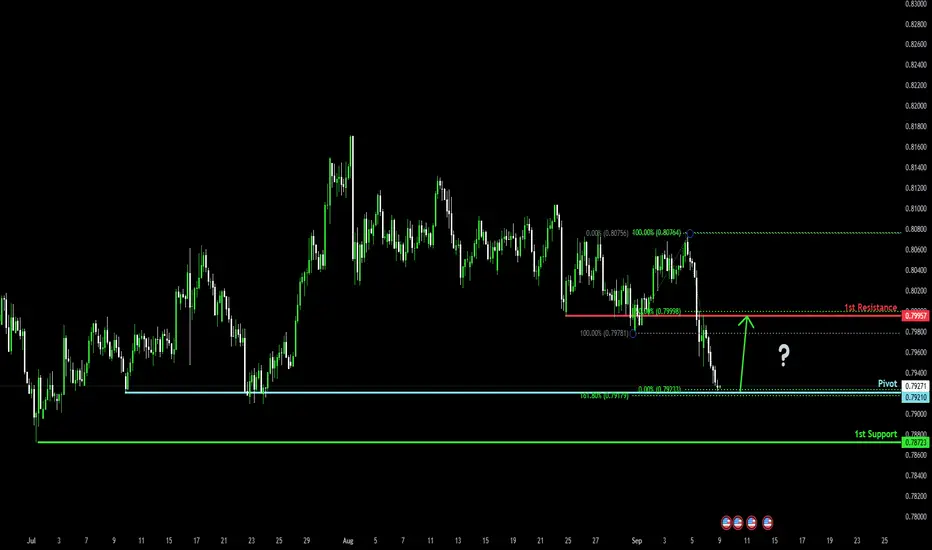
Bullish reversal from key support?The Swissie (USD/CHF) is falling towards the pivot and could bounce to the 1st resistance, which aligns with the 50% Fibonacci retracement.
Pivot: 0.7921
1st support: 0.7872
1st Resistance: 0.7995
Disclaimer:
The above opinions given constitute general market commentary, and do not constitute the opinion or advice of IC Markets or any form of personal or investment advice.
Any opinions, news, research, analyses, prices, other information, or links to third-party sites contained on this website are provided on an "as-is" basis, are intended only to be informative, is not an advice nor a recommendation, nor research, or a record of our trading prices, or an offer of, or solicitation for a transaction in any financial instrument and thus should not be treated as such. The information provided does not involve any specific investment objectives, financial situation and needs of any specific person who may receive it. Please be aware, that past performance is not a reliable indicator of future performance and/or results. Past Performance or Forward-looking scenarios based upon the reasonable beliefs of the third-party provider are not a guarantee of future performance. Actual results may differ materially from those anticipated in forward-looking or past performance statements. IC Markets makes no representation or warranty and assumes no liability as to the accuracy or completeness of the information provided, nor any loss arising from any investment based on a recommendation, forecast or any information supplied by any third-party.
Bullish bounce at key support?The Kiwi (NZD/USD) is falling towards the pivot and could bounce to the swing high resistance.
Pivot: 0.5913
1st Support: 0.5882
1st Resistance: 0.5984
Disclaimer:
The above opinions given constitute general market commentary, and do not constitute the opinion or advice of IC Markets or any form of personal or investment advice.
Any opinions, news, research, analyses, prices, other information, or links to third-party sites contained on this website are provided on an "as-is" basis, are intended only to be informative, is not an advice nor a recommendation, nor research, or a record of our trading prices, or an offer of, or solicitation for a transaction in any financial instrument and thus should not be treated as such. The information provided does not involve any specific investment objectives, financial situation and needs of any specific person who may receive it. Please be aware, that past performance is not a reliable indicator of future performance and/or results. Past Performance or Forward-looking scenarios based upon the reasonable beliefs of the third-party provider are not a guarantee of future performance. Actual results may differ materially from those anticipated in forward-looking or past performance statements. IC Markets makes no representation or warranty and assumes no liability as to the accuracy or completeness of the information provided, nor any loss arising from any investment based on a recommendation, forecast or any information supplied by any third-party.

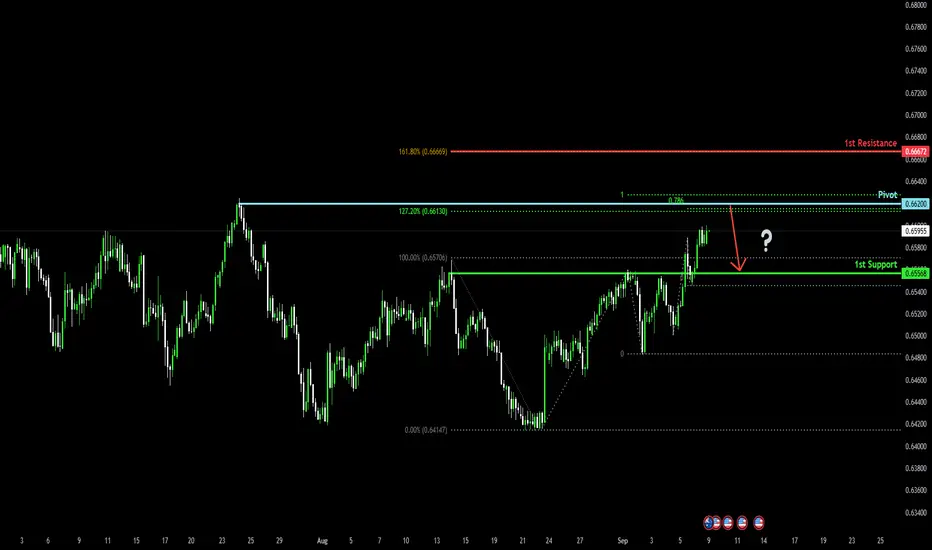
Approaching Fibonacci confluence level?The Aussie (AUD/USD) is rising towards the pivot, which acts as a swing high resistance and could reverse to the overlap support.
Pivot: 0.6620
1st Support: 0.6556
1st Resistance: 0.6667
Disclaimer:
The above opinions given constitute general market commentary and do not constitute the opinion or advice of IC Markets or any form of personal or investment advice.
Any opinions, news, research, analyses, prices, other information, or links to third-party sites contained on this website are provided on an "as-is" basis, are intended only to be informative, is not an advice nor a recommendation, nor research, or a record of our trading prices, or an offer of, or solicitation for a transaction in any financial instrument and thus should not be treated as such. The information provided does not involve any specific investment objectives, financial situation and needs of any specific person who may receive it. Please be aware, that past performance is not a reliable indicator of future performance and/or results. Past Performance or Forward-looking scenarios based upon the reasonable beliefs of the third-party provider are not a guarantee of future performance. Actual results may differ materially from those anticipated in forward-looking or past performance statements. IC Markets makes no representation or warranty and assumes no liability as to the accuracy or completeness of the information provided, nor any loss arising from any investment based on a recommendation, forecast or any information supplied by any third-party.
Heading Into major resistance?The Cable (GBP/USD) is rising towards the pivot which is an overlap resistance and could reverse to the 1st support.
Pivot: 1.3579
1st Support: 1.3461
1st Resistance: 1.3675
Disclaimer:
The above opinions given constitute general market commentary, and do not constitute the opinion or advice of IC Markets or any form of personal or investment advice.
Any opinions, news, research, analyses, prices, other information, or links to third-party sites contained on this website are provided on an "as-is" basis, are intended only to be informative, is not an advice nor a recommendation, nor research, or a record of our trading prices, or an offer of, or solicitation for a transaction in any financial instrument and thus should not be treated as such. The information provided does not involve any specific investment objectives, financial situation and needs of any specific person who may receive it. Please be aware, that past performance is not a reliable indicator of future performance and/or results. Past Performance or Forward-looking scenarios based upon the reasonable beliefs of the third-party provider are not a guarantee of future performance. Actual results may differ materially from those anticipated in forward-looking or past performance statements. IC Markets makes no representation or warranty and assumes no liability as to the accuracy or completeness of the information provided, nor any loss arising from any investment based on a recommendation, forecast or any information supplied by any third-party.

Potential bullish rise on EUR/USD?The price has bounced off the pivot, which has been identified as a pullback support and could rise to the 1st resistance, which acts as a swing high resistance.
Pivot: 1.1752
1st Support: 1.1676
1st Resistance: 1.1808
Disclaimer:
The above opinions given constitute general market commentary, and do not constitute the opinion or advice of IC Markets or any form of personal or investment advice.
Any opinions, news, research, analyses, prices, other information, or links to third-party sites contained on this website are provided on an "as-is" basis, are intended only to be informative, is not an advice nor a recommendation, nor research, or a record of our trading prices, or an offer of, or solicitation for a transaction in any financial instrument and thus should not be treated as such. The information provided does not involve any specific investment objectives, financial situation and needs of any specific person who may receive it. Please be aware, that past performance is not a reliable indicator of future performance and/or results. Past Performance or Forward-looking scenarios based upon the reasonable beliefs of the third-party provider are not a guarantee of future performance. Actual results may differ materially from those anticipated in forward-looking or past performance statements. IC Markets makes no representation or warranty and assumes no liability as to the accuracy or completeness of the information provided, nor any loss arising from any investment based on a recommendation, forecast or any information supplied by any third-party.

Fibonacci confluence signals bullish reversalUS Dollar Index (DXY) is falling towards the pivot and could bounce to the 1st resistance.
Pivot: 97.17
1st Support: 96.75
1st Resistance: 97.86
Disclaimer:
The above opinions given constitute general market commentary, and do not constitute the opinion or advice of IC Markets or any form of personal or investment advice.
Any opinions, news, research, analyses, prices, other information, or links to third-party sites contained on this website are provided on an "as-is" basis, are intended only to be informative, is not an advice nor a recommendation, nor research, or a record of our trading prices, or an offer of, or solicitation for a transaction in any financial instrument and thus should not be treated as such. The information provided does not involve any specific investment objectives, financial situation and needs of any specific person who may receive it. Please be aware, that past performance is not a reliable indicator of future performance and/or results. Past Performance or Forward-looking scenarios based upon the reasonable beliefs of the third-party provider are not a guarantee of future performance. Actual results may differ materially from those anticipated in forward-looking or past performance statements. IC Markets makes no representation or warranty and assumes no liability as to the accuracy or completeness of the information provided, nor any loss arising from any investment based on a recommendation, forecast or any information supplied by any third-party.

EURUSD possible bullish for 1.1785 & 1.18254th time frame price broke the structure to the upside. Due to strong weakness in dollar index prefer long eurusd, but better to wait for correction, 1.1650-30 first demand zone for long. may split risk into two demand zones equally. either may place stop loss below first demand zone and if hit then may take risk for long from 2nd zone as well. first entry for long 1.1650, 2nd entry 1.1560, sl 1.150, target: 1.1785

GBPJPYHello friends
Given the upward trend we are having, you can see that the price is stuck in this resistance area and every time it hits it, the price corrects itself. Now that the price has risen from the strong bottom, we need to see if it can finally break the resistance or not?
In case of a valid resistance break, the price can move to the specified targets.
But if this time the price fails to break the resistance and corrects, we will have to see how the indicated support will work.
*Trade safely with us*

Gold prices are being pushed up after negative newsTechnical, fundamental and data factors have all supported gold’s strongest weekly performance in recent years, as the precious metal broke through a series of resistance levels to set a new all-time high.
The weekly Kitco News gold survey shows that Street sentiment is overwhelmingly bullish after a string of all-time highs, while Main Street is also reinforcing its bullish stance.
Kitco's survey of 18 Wall Street professionals found that 78% expect gold prices to rise this week, 17% predict a decline and 5% see it moving sideways. Meanwhile, 73% of 219 retail investors who participated in the online survey also forecast gold prices to continue rising.
This week, the gold market awaits important information, focusing on the US producer price index (PPI) released on Wednesday, the European Central Bank (ECB) policy meeting on Thursday, followed by the US consumer price index (CPI), weekly and weekend jobless claims, the University of Michigan consumer sentiment survey... will add more signals on inflation.

Fundamental & Technical Analysis: EUR Weakness vs Strong JPY!Today, I want to review the EURJPY ( OANDA:EURJPY ) short position from a fundamental and technical perspective and see if we can profit from this analysis.
Fundamental Analysis:
1. Economic Weakness in the Eurozone
Recent economic data indicate weakness in the Eurozone economy. For instance, retail sales in the Eurozone increased by only 2.2% in July, falling short of expectations. Additionally, inflation rates in the Eurozone are declining, suggesting weak demand in the economy.
Mitrade
2. European Central Bank's Monetary Policies
The European Central Bank is considering interest rate cuts to support the economy. Such policies could lead to a depreciation of the euro, presenting opportunities for short positions.
3. Economic Strength in Japan
In contrast, Japan's economy is showing signs of improvement. Positive economic data, including increased industrial production and exports, indicate economic growth in Japan. This could lead to a strengthening of the Japanese yen and a decline in the EURJPY pair.
4. Bank of Japan's Monetary Policies
The Bank of Japan continues its accommodative monetary policies, including negative interest rates and extensive asset purchase programs. These measures help mitigate downward pressure on the yen, supporting its strength.
Conclusion
Considering the economic weakness in the Eurozone and the economic strength in Japan, the EURJPY pair is likely to experience a downward trend in the short term. This fundamental analysis supports a short position on EUR/JPY.
----------------------------------------------------------------------
Now, let's examine the EURJPY chart on the 4-hour time frame with technical analysis tools .
EURJPY is currently moving in the Resistance zone(173.420 JPY-172.660 JPY) and near the Monthly Resistance(1) .
From the Elliott wave theory perspective , it seems that EURJPY has managed to complete the microwave C of the main wave y of the Double Three Correction(WXY) .
I expect EURJPY to continue its downward trend in the coming hours and at least decline to the Support lines(First Target) .
Second Target: 171.760 JPY
Third Target: Lower lines of the Ascending Channel
Stop Loss(SL): 173.640 JPY
Please respect each other's ideas and express them politely if you agree or disagree.
Euro/Japanese Yen Analysis (EURJPY), 4-hour Time Frame.
Be sure to follow the updated ideas.
Do not forget to put a Stop loss for your positions (For every position you want to open).
Please follow your strategy and updates; this is just my Idea, and I will gladly see your ideas in this post.
Please do not forget the ✅' like '✅ button 🙏😊 & Share it with your friends; thanks, and Trade safe.

NZD/USD Heading Lower? Key Resistance is being RejectedLooking at the NZD/USD chart, I find it quite interesting right now.
Take a look at this: price has been trapped inside a clean descending channel, making lower highs and lower lows, respecting both boundaries like clockwork.
Right now, price has pushed back into the upper edge of the channel, and this is where things get exciting. Sellers have stepped in here multiple times before, and the structure suggests another rejection could be on the way.
If that rejection plays out, the short setup is crystal clear: ride it back down toward the lower boundary of the channel, with a potential target around 0.577.
Remember, in a channel like this, trading with the trend is always higher probability than fighting it. Until the channel is broken, sellers have the upper hand.
Do you agree? Drop a comment below. Engaging with the TradingView community is always helpful to improve and grow as traders.
Not financial advice, just sharing my thoughts on the charts. Trade safely 😊

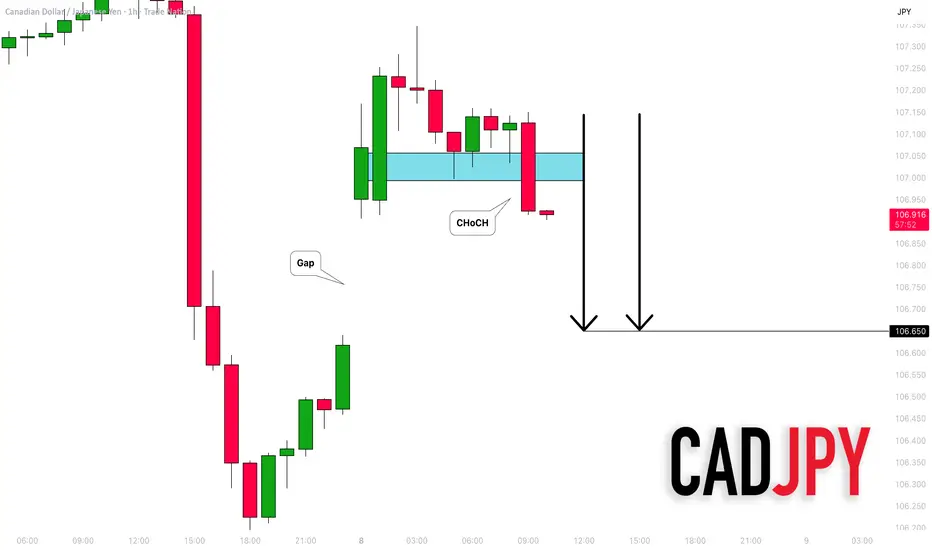
CADJPY: Another Gap 🇨🇦🇯🇵
One more peculiar gap that I see is on CADJPY.
A confirmed bearish Change of Character CHoCH
on an hourly, confirms a local strength of the sellers.
With a high probability, the price will drop to gap
opening level.
Goal - 106.65
❤️Please, support my work with like, thank you!❤️
I am part of Trade Nation's Influencer program and receive a monthly fee for using their TradingView charts in my analysis.
USDJPY: Gap Will Be Filled 🇺🇸🇯🇵
There is a high chance that USDJPY will fill a gap up opening.
As a confirmation, I see a strong bearish imbalance on an hourly time frame.
Goal - 147.52
❤️Please, support my work with like, thank you!❤️
I am part of Trade Nation's Influencer program and receive a monthly fee for using their TradingView charts in my analysis.

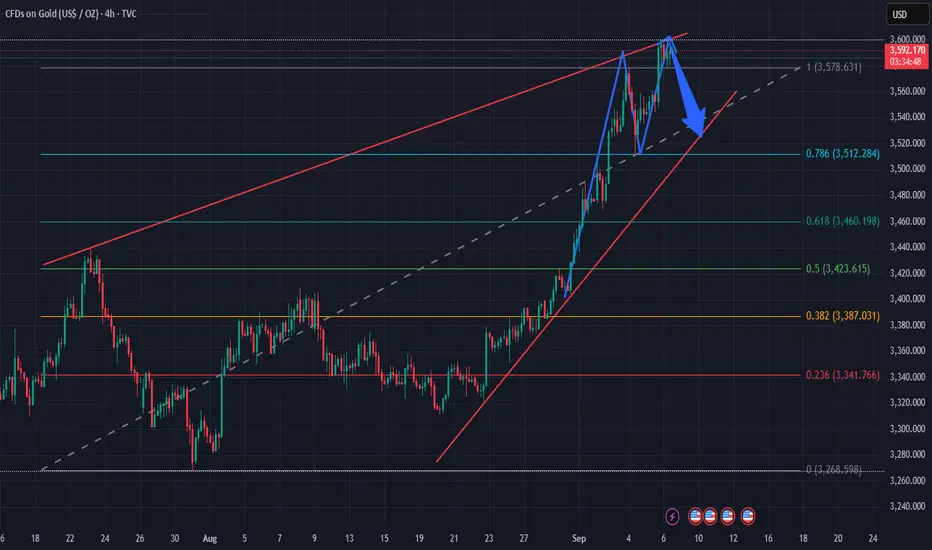
Expect price from 3,590 to correct down to around 3,5201. Price Structure
Previous trend: Gold has been in a strong uptrend since late August, consistently forming higher highs and higher lows.
Currently, price has reached the upper channel resistance (red trendline) and is showing a small double-top pattern, signaling potential weakness.
2. Fibonacci & Support Levels
Fibonacci retracement drawn from 3,268 → 3,590.
Key levels:
0.786 = 3,510 (aligned with lower trendline → strong support).
0.618 = 3,460 → medium-term support.
0.382 = 3,380 → if broken, short-term bullish structure weakens.
3. Patterns & Technical Signals
The chart indicates a blue arrow: expectation of a pullback from 3,590 toward around 3,520 (grey trendline + 0.786 Fibo).
If price holds above 3,510 → potential rebound to continue the uptrend.
If 3,510 breaks → deeper correction likely toward 3,460 – 3,420.
4. Trading Scenarios
Scenario 1 (preferred):
Short-term sell from 3,590 → 3,520.
TP: 3,520 – 3,510, SL above 3,600.
Scenario 2:
If 3,510 – 3,520 holds strong → consider long entries in line with the main trend.
TP: 3,590 → 3,620, SL below 3,490.
👉 Summary: Gold is showing short-term weakness after a sharp rally, likely to correct toward 3,510 – 3,520 before the next move becomes clearer.
Fed rate cut forecasts soarEarlier, a key US jobs report showed hiring slowed while unemployment rose to its highest level since 2021. This development has increased market expectations of an interest rate cut. Lower borrowing costs tend to increase the appeal of gold, which does not pay interest.
The precious metal also received support from strong safe-haven demand amid concerns about the future of the US central bank.
President Donald Trump's increasing criticism of the Fed has raised concerns about the agency's independence. Trump has vowed to win a majority at the central bank soon and lower interest rates. Investors are awaiting a key ruling on whether Trump has the legal basis to remove Fed Governor Lisa Cook.

If price breaks out strongly above 3600, gold may rally towards Central Banks Slow Gold Buying but Remain Net Buyers
Despite the strong rally in gold prices, central banks (including the Reserve Bank of India) have shown signs of slowing their gold purchases. However, purchases continued at 10 tonnes in July — reflecting the long-term trend of diversifying reserves away from the USD
1. Resistance Zone
Current price around 3587 is testing the strong resistance area 3590 – 3600 (highlighted in pink).
This also coincides with the upward trendline (red line), which adds selling pressure.
📌 Conclusion: 3590–3600 is a key barrier that’s hard to break in the short term.
2. Support Zones (Fibonacci Levels)
Support levels based on Fibonacci Retracement:
0.786 → 3529
0.618 → 3473
0.5 → 3434 (aligns with the blue support zone).
Lower supports: 0.382 → 3395, 0.236 → 3347.
📌 The 3430–3470 range is seen as strong support for the medium term.
3. Trends & Scenarios
Price has surged strongly since late August.
Now it is facing heavy resistance around 3590–3600, with high probability of a pullback.
Scenario 1 (Short-term correction 🔻)
Price tests 3590–3600 but fails to break.
Possible pullback towards 3529 – 3473 (0.786 & 0.618 levels).
If broken further, the next target is 3430–3440.
Scenario 2 (Bullish continuation 🔺)
If price breaks out strongly above 3600, gold may rally towards 3640–3660.
This requires supportive news (e.g., Fed dovish stance, weak USD, poor US data).
4. Summary
Main resistance: 3590–3600
Key supports: 3529 – 3473 – 3430
Bias: Price is hitting resistance → short-term correction is more likely.
👉 Traders may consider short around 3590–3600, SL above 3610, TP around 3530–3470.
👉 If price breaks and holds above 3600, the bullish trend may extend further.

NZDUSD H1 | Strong buy level confirming bullish riseKiwi (NZD/USD) has bounced off the buy entry, which is a pullback support that aligns with the 38.2% Fibonacci retracement and could potentially rise from this level to the upside.
Buy entry is 0.5882, which is a pullback support that aligns with the 38.2% Fibonacci retracement.
Stop loss is at 0.5867, which is a pullback support that is slightly above the 61.8% Fibonacci retracement.
Take profit is at 0.5914, which acts a a multi swing high resistance.
High Risk Investment Warning
Trading Forex/CFDs on margin carries a high level of risk and may not be suitable for all investors. Leverage can work against you.
Stratos Markets Limited (tradu.com ):
CFDs are complex instruments and come with a high risk of losing money rapidly due to leverage. 65% of retail investor accounts lose money when trading CFDs with this provider. You should consider whether you understand how CFDs work and whether you can afford to take the high risk of losing your money.
Stratos Europe Ltd (tradu.com ):
CFDs are complex instruments and come with a high risk of losing money rapidly due to leverage. 66% of retail investor accounts lose money when trading CFDs with this provider. You should consider whether you understand how CFDs work and whether you can afford to take the high risk of losing your money.
Stratos Global LLC (tradu.com ):
Losses can exceed deposits.
Please be advised that the information presented on TradingView is provided to Tradu (‘Company’, ‘we’) by a third-party provider (‘TFA Global Pte Ltd’). Please be reminded that you are solely responsible for the trading decisions on your account. There is a very high degree of risk involved in trading. Any information and/or content is intended entirely for research, educational and informational purposes only and does not constitute investment or consultation advice or investment strategy. The information is not tailored to the investment needs of any specific person and therefore does not involve a consideration of any of the investment objectives, financial situation or needs of any viewer that may receive it. Kindly also note that past performance is not a reliable indicator of future results. Actual results may differ materially from those anticipated in forward-looking or past performance statements. We assume no liability as to the accuracy or completeness of any of the information and/or content provided herein and the Company cannot be held responsible for any omission, mistake nor for any loss or damage including without limitation to any loss of profit which may arise from reliance on any information supplied by TFA Global Pte Ltd.
The speaker(s) is neither an employee, agent nor representative of Tradu and is therefore acting independently. The opinions given are their own, constitute general market commentary, and do not constitute the opinion or advice of Tradu or any form of personal or investment advice. Tradu neither endorses nor guarantees offerings of third-party speakers, nor is Tradu responsible for the content, veracity or opinions of third-party speakers, presenters or participants.

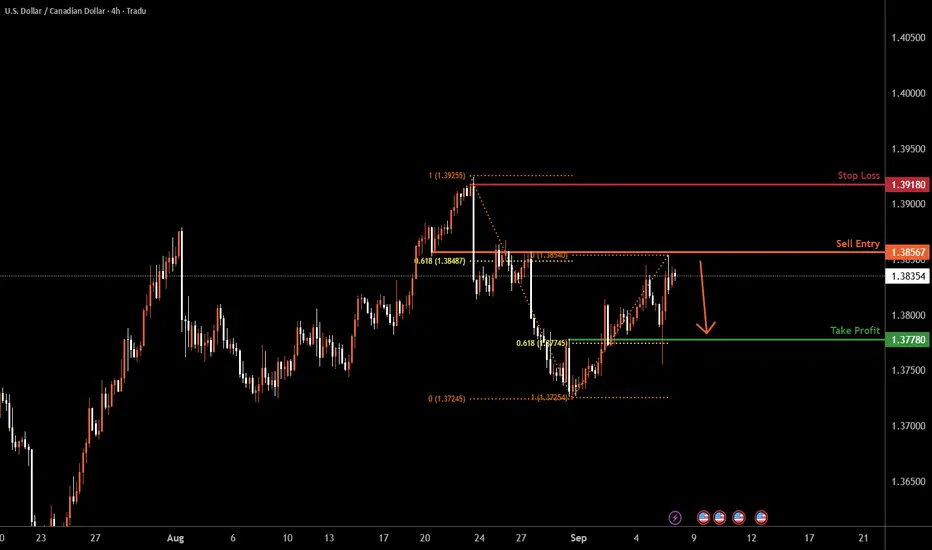
USDCAD H4 | Bearish reversal at key resistanceLoonie (USD/CAD is reacting off the sell entry, which is an overlap resistance that lines up with the 61.8% Fibonacci retracement and could reverse from this level to the downside.
Sell entry is at 1.3828, which is an overlap resistance that aligns with the 61.8% Fibonacci retracement.
Stop loss is at 1.3918, a swing high resistance.
Take profit is at 1.3778, which is an overlap support that aligns with the 61.8% Fibonacci retracement.
High Risk Investment Warning
Trading Forex/CFDs on margin carries a high level of risk and may not be suitable for all investors. Leverage can work against you.
Stratos Markets Limited (tradu.com ):
CFDs are complex instruments and come with a high risk of losing money rapidly due to leverage. 65% of retail investor accounts lose money when trading CFDs with this provider. You should consider whether you understand how CFDs work and whether you can afford to take the high risk of losing your money.
Stratos Europe Ltd (tradu.com ):
CFDs are complex instruments and come with a high risk of losing money rapidly due to leverage. 66% of retail investor accounts lose money when trading CFDs with this provider. You should consider whether you understand how CFDs work and whether you can afford to take the high risk of losing your money.
Stratos Global LLC (tradu.com ):
Losses can exceed deposits.
Please be advised that the information presented on TradingView is provided to Tradu (‘Company’, ‘we’) by a third-party provider (‘TFA Global Pte Ltd’). Please be reminded that you are solely responsible for the trading decisions on your account. There is a very high degree of risk involved in trading. Any information and/or content is intended entirely for research, educational and informational purposes only and does not constitute investment or consultation advice or investment strategy. The information is not tailored to the investment needs of any specific person and therefore does not involve a consideration of any of the investment objectives, financial situation or needs of any viewer that may receive it. Kindly also note that past performance is not a reliable indicator of future results. Actual results may differ materially from those anticipated in forward-looking or past performance statements. We assume no liability as to the accuracy or completeness of any of the information and/or content provided herein and the Company cannot be held responsible for any omission, mistake nor for any loss or damage including without limitation to any loss of profit which may arise from reliance on any information supplied by TFA Global Pte Ltd.
The speaker(s) is neither an employee, agent nor representative of Tradu and is therefore acting independently. The opinions given are their own, constitute general market commentary, and do not constitute the opinion or advice of Tradu or any form of personal or investment advice. Tradu neither endorses nor guarantees offerings of third-party speakers, nor is Tradu responsible for the content, veracity or opinions of third-party speakers, presenters or participants.
Bearish reversal off major resistance?The Kiwi (NZD/USD) is rising towards the pivot and could reverse to the 1st support which acts as a pullback support.
Pivot: 0.5941
1st Support: 0.5789
1st Resistance: 0.6095
Disclaimer:
The above opinions given constitute general market commentary, and do not constitute the opinion or advice of IC Markets or any form of personal or investment advice.
Any opinions, news, research, analyses, prices, other information, or links to third-party sites contained on this website are provided on an "as-is" basis, are intended only to be informative, is not an advice nor a recommendation, nor research, or a record of our trading prices, or an offer of, or solicitation for a transaction in any financial instrument and thus should not be treated as such. The information provided does not involve any specific investment objectives, financial situation and needs of any specific person who may receive it. Please be aware, that past performance is not a reliable indicator of future performance and/or results. Past Performance or Forward-looking scenarios based upon the reasonable beliefs of the third-party provider are not a guarantee of future performance. Actual results may differ materially from those anticipated in forward-looking or past performance statements. IC Markets makes no representation or warranty and assumes no liability as to the accuracy or completeness of the information provided, nor any loss arising from any investment based on a recommendation, forecast or any information supplied by any third-party.
