Gold Targets $3,600 After Strong BreakoutAnalysis:
Gold (XAU/USD) continues its bullish rally after breaking above the buy zone near $3,440 and holding strong momentum. The market has recently made higher highs, with price consolidating slightly below the resistance zone.
Currently, gold is trading at $3,548, with the short-term target identified at $3,600. The chart suggests potential consolidation in the highlighted area before another upward push. The SMA (9) at $3,552 is acting as dynamic support, keeping the bullish bias intact.
If buyers maintain control, a clear breakout above $3,552 – $3,560 could confirm a move toward $3,600 – $3,604. However, if momentum weakens, support lies at $3,511 and $3,499, with a deeper pullback possible toward the $3,440 buy zone.
Overall, the sentiment remains bullish, and gold looks positioned to test the $3,600 psychological resistance in the near term.
Forexsignals

GBPUSD: Overbought Market & Pullback 🇬🇧🇺🇸
GBPUSD is going to retrace more, following a strong
bearish reaction to an intraday/daily horizontal resistance.
Goal - 1.3487
❤️Please, support my work with like, thank you!❤️
I am part of Trade Nation's Influencer program and receive a monthly fee for using their TradingView charts in my analysis.

GBPUSD: Bearish Continuation is Highly Probable! Here is Why:
The recent price action on the GBPUSD pair was keeping me on the fence, however, my bias is slowly but surely changing into the bearish one and I think we will see the price go down.
Disclosure: I am part of Trade Nation's Influencer program and receive a monthly fee for using their TradingView charts in my analysis.
❤️ Please, support our work with like & comment! ❤️

XAUUSDHello Traders! 👋
What are your thoughts on XAUUSD?
Gold has been moving within a medium-term ascending channel and recently managed to break above a major resistance area that had previously rejected price multiple times.
Currently, the price is facing a psychological and technical barrier at the $3500 level, acting as the next resistance.
Price is expected to consolidate slightly below $3500 before attempting another push higher.
As long as price holds above the broken resistance and stays within the ascending channel, the bullish outlook remains valid.
A successful breakout above $3500 could open the path toward targets at $3600 – $3700-$3900 in the medium term.
Don’t forget to like and share your thoughts in the comments! ❤️

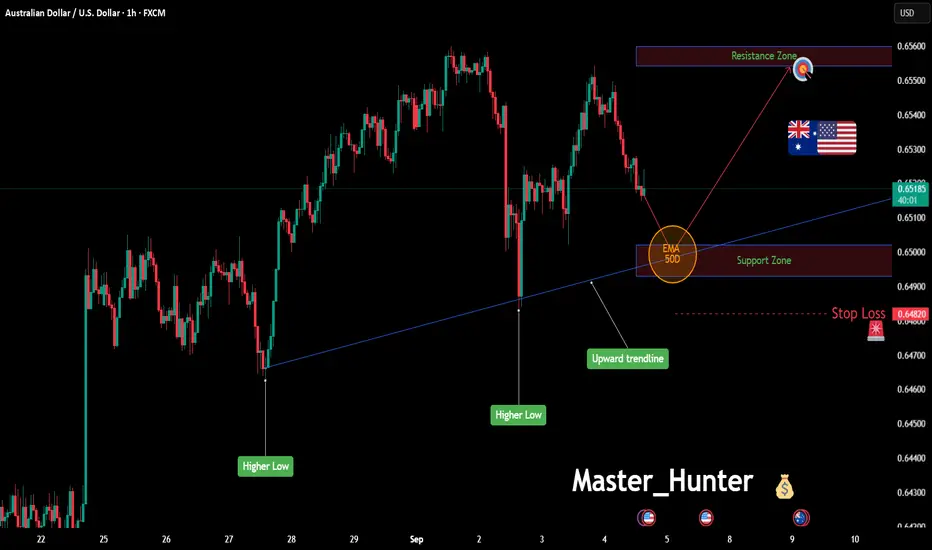
AUD/USD: Bullish Push to 0.65543?As the previous analysis worked exactly as predicted, FX:AUDUSD is setting up for a bullish move on the 1-hour chart , with an entry zone between 0.64930-0.65020 near a key support level.
The target at 0.65543 aligns with the next resistance, offering a solid upside play. Set a stop loss on a close below 0.6482 to manage risk effectively. 🌟
Watch economic data! 💡
📝 Trade Plan:
✅ Entry Zone: 0.64930 – 0.65020 (support area)
❌ Stop Loss: Daily close below 0.6482 to manage risk
🎯 Target: 0.65543 (next resistance)
Ready for this move? Drop your take below! 👇
XAU/USD – FED, Tariffs & NFP Tonight | Captain Vincent 🔎 Captain’s Log – Context & News
The probability of the FED cutting rates in September has risen to 99.4% (from 96.6%) → almost a certainty.
FED’s Cook is under fraud investigation, combined with previously weak economic data → further strengthens momentum for Gold.
US–Japan deal: US reduces chip import tariffs to 15% , in return Japan invests $550B + purchases $8B worth of agricultural products. Positive, but not game-changing since markets remain focused on interest rates & inflation.
Trump: Threatens to impose tariffs on all chip/semis companies not entering the US → raises geopolitical concerns.
NFP & Unemployment Rate at 07:30 Us → key event, potential for very strong volatility.
⏩ Captain’s Summary:
Flows remain tilted toward BUY Gold thanks to FED rate cut expectations, but short-term whipsaws may occur before/after the news.
📈 Captain’s Chart – Technical Analysis
M30 BOS : Gold just created a Break of Structure, overall trend remains bullish.
Captain’s Shield (Support) : 3484 – 3486 (Main Buy Zone).
Storm Breaker (Resistance) : 3575 – 3593 (aligns with Fibo 0.5 – 0.618).
If Gold breaks above 3591 – 3593 → opens the path toward new ATH at 3608 – 3610 or higher.
If rejected at Storm Breaker → price may retest Golden Harbor (3484) before bouncing back upward.
🎯 Captain’s Map – Trade Scenarios
✅ Golden Harbor (BUY – Priority)
Entry: 3484 – 3486
SL: 3478
TP: 3490 → 3493 → 3497 → 3505 → 35xx
⚡ Quick Boarding (SELL Scalp – Short-term)
Entry: 3575 – 3577
SL: 3585
TP: 3570 → 3565 → 3560 → 3555 → 35xx
🌊 Storm Breaker (SELL Zone – Resistance)
Entry: 3591 – 3593
SL: 3600
TP: 3588 → 3585 → 3580 → 3575 → 35xx
⚓ Captain’s Note
“The Golden ship sails smoothly as the FED is almost certain to cut rates in September. Golden Harbor 🏝️ (3484) is the safe haven to continue riding the bullish wave. Storm Breaker 🌊 (3575–3593) may spark big waves for short Quick Boarding 🚤 , but the main current still carries us northward.”

GPBUSD: SUPPLY AND DEMAND ANALYSISOn the 4H timeframe, GBPUSD is currently reacting around a key supply zone.
🔴 Supply Zone (1.3530 – 1.3547):
Price rejected this area previously with strong selling pressure.
Price is now retesting this zone, where sellers are likely to defend again.
🔵 Demand Zone (1.3335):
This is the next major support where buyers previously stepped in.
It remains the logical take profit target for shorts.

GBPUSDHello Traders! 👋
What are your thoughts on GBPUSD?
After rejecting a resistance area, GBP/USD has entered a corrective phase and is now approaching a high-confluence support zone, where multiple technical elements align
Price is expected to show bullish reaction within the support zone after some short-term consolidation.
Holding above this area could trigger a new impulsive wave toward previous resistance levels
As long as price stays above the support, the bullish bias remains valid.
A break and close below 1.31300 would invalidate the bullish setup, potentially opening the door for a deeper correction.
Don’t forget to like and share your thoughts in the comments! ❤️

XAUUSD on DROP on NFP??We have two patterns at moment head & Shoulder on H1 and Rising wedge pattern on H4. Today's NFP is comming and Expectations for this NFP aren’t high. A decent result could lift dxy and push gold lower.
What possible scenario we have?
• XAUUSD on undisputed bullish rising wedge channel,I'm expecting market will fall from 3556-3563 range and my Targets will be 3510 them 3490.
• secondly if any H1-H4 candle closes above 3580 then our analysis will be invalid
All the entires should be taken once all the rules are applied

EUR/CAD: Launching Long! Layered Entry Strategy For Gains💸 EUR/CAD "Euro vs Loonie" Bank Plan (Swing / Scalping) 📊
🎯 Trading Plan (Thief Layering Strategy)
Asset: EUR/CAD
Setup: Bullish Hull Moving Average breakout + retest 🟢
Entry (Layering Style): Multiple buy limit orders at
1.60800
1.60900
1.61000
1.61200
(You can expand layers based on your own risk preference)
Stop Loss (SL): Thief SL @ 1.60600 (adjust to your own risk strategy) 🛡️
Target (TP): Resistance "police barricade" around 1.62200 🏁
⚠️ Note: This is not financial advice — manage your own TP and risk as per your trading plan.
🔍 Why This Plan? (Fundamental + Macro + Sentiment + Thief Blend)
📈 Real-Time Snapshot (Sept 5, 2025)
EUR/CAD Spot Rate: 1.6025
Daily Change: +0.12%
52-Week Range: 1.4650 – 1.6350
👥 Trader Sentiment
Retail Traders: 42% Long 🐂 | 58% Short 🐻
Institutions: 55% Long 🐂 | 45% Short 🐻
😱 Investor Mood (Fear & Greed)
Index: 48/100 → Neutral ⚖️ (leaning fear due to global trade + US jobs data)
📋 Fundamentals
Score: 62/100 🟢
Drivers:
Eurozone growth resilient, ECB steady at 2% 🏦
Canada facing weak jobs data, BoC at 2.75% 🛢️
Oil prices steady, modest CAD support ⚡
🌍 Macro Score
Score: 58/100 🟡
Factors:
Global trade tensions weigh on CAD 🛡️
Eurozone recovery boosts EUR 💪
US policy uncertainty adds volatility 🌪️
🧭 Overall Market Outlook
Bias: Neutral → Slightly Bullish Tilt 📈
Why: ECB support + Eurozone recovery outweigh CAD’s oil-linked strength. Range likely 1.60 – 1.63 short-term.
🚦 Related Pairs to Watch
FX:EURUSD , OANDA:USDCAD , OANDA:GBPCAD , OANDA:EURGBP
Keep an eye on BLACKBULL:WTI (Oil) for CAD correlation.
✨ “If you find value in my analysis, a 👍 and 🚀 boost is much appreciated — it helps me share more setups with the community!”
#EURCAD #Forex #TradingPlan #SwingTrading #Scalping #ThiefStrategy #HullMovingAverage #Fundamentals #MacroAnalysis #Sentiment #FXCommunity

Xauusd( NFP )Analysis Is ReadyThis analysis shows Gold (XAU/USD) holding support around 3541, with bullish momentum expected after NFP news. Price is projected to rise toward 3578 and potentially test a new high near 3610.

EUR/JPY Bank Heist Is LIVE! Bullish Breakout Plan >>>🚀 EUR/JPY "The Yuppy" Bank Heist Plan (Swing/Scalping Trade) 🚀
Professional Thief Strategy for High-Probability Breakout Trading
🎯 Executive Thief Summary
Asset: EUR/JPY "The Yuppy" (The Euro-Yen Cross)
Strategy: Bullish Hull MA Breakout & Retest with Layered Entry Approach
Timeframe: Swing/Scalping (1H-4H Charts)
Current Price: ¥173.15 | Daily Change: +0.10% (+0.17)
Trade Bias: Mildly Bullish (65% Bullish Score) ✅
Thief Note: This plan combines technical breakout dynamics with fundamental macro drivers for a high-probability heist operation!
📊 Technical Heist Plan
🎮 Entry Strategy (Layered Limit Orders)
The Thief's Multi-Layer Entry Approach for Optimal Positioning:
Layer 1: ¥172.60 (Initial breakout retest zone) ⚡
Layer 2: ¥172.70 (Volume-weighted support area) ⚡
Layer 3: ¥172.80 (Hull MA confluence zone) ⚡
Layer 4: ¥173.00 (Dynamic support & momentum acceleration) ⚡
Thief Tip: You can add additional layers based on your risk appetite and capital allocation strategy!
🛡️ Risk Management
Stop Loss: ¥172.20 (Below 100-day EMA & key support) ❌
Position Sizing: Risk no more than 1-2% per trade layer
Adjustment Note: Dear Thief OG's - Modify your SL based on your individual risk tolerance and strategy parameters
🎯 Profit Targets
Primary Target: ¥174.30 (High-voltage resistance zone) ✅
Context: RSI showing overbought conditions likely at this level - escape with stolen money before potential reversal!
🌍 Fundamental & Macro Context
🇪🇺 Eurozone Factors (EUR Strengths)
ECB Rate Policy: Hold at 2.15% (Hawkish Stance) 🦅
Inflation (HICP): 2.1% (Above ECB's 2% target - supportive for EUR)
Market Impact: Rate differentials favor EUR strength
🇯🇵 Japan Factors (JPY Weaknesses)
BoJ Policy: Dovish (Uncertain Timing for Hikes) 🕊️
Real Wages: Turned Positive (First Time in 7 Months - but gradual impact) ✅
Trade Deal: US-Japan Auto Tariff Reduction (JPY Positive but limited impact)
📅 Economic Calendar Watch
Eurozone GDP Data Today (09:00 GMT) - Potential short-term volatility driver
Risk: GDP miss could cause EUR pullback - monitor news flow
📊 Market Sentiment & Positioning
😰 Fear & Greed Index
Stock Market Sentiment: Greed (Score: 57/100) 📈
Crypto Sentiment: Neutral (Score: 50/100)
Key Drivers:
S&P 500 above 125-day moving average → Greed
Low put/call ratio → Optimism
Stable volatility (VIX) → Confidence
👥 Trader Sentiment
Retail Traders: Bullish (60% Long) 🟢 vs. Bearish (40% Short) 🔴
Institutional Traders: Bullish (55% Long) 🟢 vs. Bearish (45% Short) 🔴
Primary Reason: Carry trade appeal due to rate differentials
⚠️ Risk Factors & Considerations
🚨 Key Risks
Eurozone GDP Miss → EUR Pullback (Monitor 09:00 GMT release)
BoJ Surprise Hike → JPY Rally (Low probability but high impact)
Geopolitical Tensions → Safe-Haven JPY Demand (Always monitor global headlines)
📋 Trade Management Tips
Scale In: Use the layered entry approach to improve average entry price
Scale Out: Consider partial profits at ¥173.40 and ¥174.00 if momentum slows
News Awareness: Monitor ECB and BoJ speaker comments for unexpected guidance changes
📊 Related Pairs to Watch
EUR
Correlations:
EUR/USD - Direct EUR exposure
EUR/CHF - European cross rate
EUR/GBP - European monetary policy differentials
JPY
Correlations:
USD/JPY - Dollar-Yen dynamics
GBP/JPY - Risk-sensitive yen cross
AUD/JPY - Commodity-yen relationship
Thief Insight: Monitor these pairs for confirmation of broader EUR/JPY moves!
✨ Final Thief Notes
Why This Plan Works Now:
Technical breakout confirms bullish bias
Fundamental rate differentials favor EUR strength
Market sentiment supports risk-on environment
Layered entry approach provides optimal risk-reward
Trade Duration Expectation:
Swing Trade: 3-7 days for full target
Scalping Opportunities: 1-4 hour moves within the trend
✨ "If you find value in my analysis, a 👍 and 🚀 boost is much appreciated — it helps me share more setups with the community!"
📌 Hashtags
#EURJPY #ForexTrading #TechnicalAnalysis #SwingTrading #Scalping #BreakoutStrategy #HullMA #TradingSetup #ForexSignals #TradingView #BankHeistPlan #ThiefStrategy #RiskManagement

USDJPY Near 148.500 as Markets Await Key NFP PrintHey Traders, in today's trading session we are monitoring USDJPY for a potential selling opportunity around the 148.500 zone. The pair recently broke its uptrend structure and is now in a correction phase, approaching this important support/resistance level.
Structure: USDJPY shifted from an uptrend into a corrective move, with 148.500 acting as a retracement area of interest.
Key level in focus: 148.500 — a zone where sellers could regain control if bearish momentum builds.
Event risk – NFP scenarios:
Below 60k: Would likely trigger immediate USD weakness, keeping pressure on USDJPY and favoring further downside.
Between 80k–95k: Could produce an initial USD bounce, but the move may fade as markets recognize it’s still a soft jobs number.
Above 100k: Would complicate the bearish USD narrative, as stronger data may support the greenback.
Context: Overall, the bias leans toward USD weakness unless a clear upside surprise emerges from NFP. Watching how USDJPY reacts around 148.500 will be key into the weekly close.
Trade safe,
Joe.

Sell on breakdown below 3,510, targeting 3,460 – 3,423.GOLD Chart Analysis (H4 timeframe)
Price is in a strong uptrend, forming higher highs and higher lows. Currently, it has reached the resistance zone around 3,575 – 3,580 and is showing signs of correction. The chart shows an ascending channel (two red trendlines). Price is forming a Rising Wedge, which often signals a potential reversal. The blue arrows indicate a possible pullback scenario: price may retest the lower trendline. Fibonacci levels are drawn from the recent low to the 3,578 high: 0.786 ~ 3,512 (price is testing this level now), 0.618 ~ 3,460 (strong support if price breaks lower), 0.5 ~ 3,423 (key balance zone), and 0.382 ~ 3,387 (lower support). If the price breaks below the current trendline support (around 3,510 – 3,520), it may correct deeper toward 3,460 or even 3,423.
Scenario 1 (Bullish continuation): If price holds above 3,510 – 3,520 trendline → bounce back toward 3,575 – 3,580, possibly breaking higher. Scenario 2 (Deeper correction): If price falls below 3,510 → potential drop toward 3,460 and then 3,423 (Fibo 0.5).
The Rising Wedge pattern typically favors a downside breakout, so risk management is important. The 3,575 – 3,580 zone is a strong short-term resistance. Possible setups: Short-term Buy around 3,510 – 3,520 with stop-loss below 3,500, or Sell on breakdown below 3,510, targeting 3,460 – 3,423.
👉 Summary: Gold is at the end of a strong bullish leg and stalling near heavy resistance. Watch the 3,510 – 3,520 support closely. A breakdown could trigger a correction toward 3,460 – 3,423.

XAGUSD H1 | Bearish reversal off pullback resistanceSilver (XAG/USD) is reacting off the sell entry, which is a pullback resistance that is slightly below the 61.8% Fibonacci retracement and could drop from this level to the take profit.
Sell entry is at 40.96, which is a pullback resistance that is slightly below the 61.8% Fibonacci retracement.
Stop loss is at 41.37, which is a swing high resistance that lines up with the 161.8% Fibonacci extension.
Take profit is at 40.22, which is a pullback support.
High Risk Investment Warning
Trading Forex/CFDs on margin carries a high level of risk and may not be suitable for all investors. Leverage can work against you.
Stratos Markets Limited (tradu.com ):
CFDs are complex instruments and come with a high risk of losing money rapidly due to leverage. 65% of retail investor accounts lose money when trading CFDs with this provider. You should consider whether you understand how CFDs work and whether you can afford to take the high risk of losing your money.
Stratos Europe Ltd (tradu.com ):
CFDs are complex instruments and come with a high risk of losing money rapidly due to leverage. 66% of retail investor accounts lose money when trading CFDs with this provider. You should consider whether you understand how CFDs work and whether you can afford to take the high risk of losing your money.
Stratos Global LLC (tradu.com ):
Losses can exceed deposits.
Please be advised that the information presented on TradingView is provided to Tradu (‘Company’, ‘we’) by a third-party provider (‘TFA Global Pte Ltd’). Please be reminded that you are solely responsible for the trading decisions on your account. There is a very high degree of risk involved in trading. Any information and/or content is intended entirely for research, educational and informational purposes only and does not constitute investment or consultation advice or investment strategy. The information is not tailored to the investment needs of any specific person and therefore does not involve a consideration of any of the investment objectives, financial situation or needs of any viewer that may receive it. Kindly also note that past performance is not a reliable indicator of future results. Actual results may differ materially from those anticipated in forward-looking or past performance statements. We assume no liability as to the accuracy or completeness of any of the information and/or content provided herein and the Company cannot be held responsible for any omission, mistake nor for any loss or damage including without limitation to any loss of profit which may arise from reliance on any information supplied by TFA Global Pte Ltd.
The speaker(s) is neither an employee, agent nor representative of Tradu and is therefore acting independently. The opinions given are their own, constitute general market commentary, and do not constitute the opinion or advice of Tradu or any form of personal or investment advice. Tradu neither endorses nor guarantees offerings of third-party speakers, nor is Tradu responsible for the content, veracity or opinions of third-party speakers, presenters or participants.

USDCAD H1 | Potential bearish dropThe Loonie (USD/CAD) has reacted off the sell entry and could drop from this level to the take profit.
Sell entry is at 1.3808, which is a pullback resistance.
Stop loss is at 1.3842, which is a pullback resistance.
Take profit is at 1.3770, which is an overlap support that aligns with the 61.8% Fibonacci retracement.
High Risk Investment Warning
Trading Forex/CFDs on margin carries a high level of risk and may not be suitable for all investors. Leverage can work against you.
Stratos Markets Limited (tradu.com ):
CFDs are complex instruments and come with a high risk of losing money rapidly due to leverage. 65% of retail investor accounts lose money when trading CFDs with this provider. You should consider whether you understand how CFDs work and whether you can afford to take the high risk of losing your money.
Stratos Europe Ltd (tradu.com ):
CFDs are complex instruments and come with a high risk of losing money rapidly due to leverage. 66% of retail investor accounts lose money when trading CFDs with this provider. You should consider whether you understand how CFDs work and whether you can afford to take the high risk of losing your money.
Stratos Global LLC (tradu.com ):
Losses can exceed deposits.
Please be advised that the information presented on TradingView is provided to Tradu (‘Company’, ‘we’) by a third-party provider (‘TFA Global Pte Ltd’). Please be reminded that you are solely responsible for the trading decisions on your account. There is a very high degree of risk involved in trading. Any information and/or content is intended entirely for research, educational and informational purposes only and does not constitute investment or consultation advice or investment strategy. The information is not tailored to the investment needs of any specific person and therefore does not involve a consideration of any of the investment objectives, financial situation or needs of any viewer that may receive it. Kindly also note that past performance is not a reliable indicator of future results. Actual results may differ materially from those anticipated in forward-looking or past performance statements. We assume no liability as to the accuracy or completeness of any of the information and/or content provided herein and the Company cannot be held responsible for any omission, mistake nor for any loss or damage including without limitation to any loss of profit which may arise from reliance on any information supplied by TFA Global Pte Ltd.
The speaker(s) is neither an employee, agent nor representative of Tradu and is therefore acting independently. The opinions given are their own, constitute general market commentary, and do not constitute the opinion or advice of Tradu or any form of personal or investment advice. Tradu neither endorses nor guarantees offerings of third-party speakers, nor is Tradu responsible for the content, veracity or opinions of third-party speakers, presenters or participants.

EURGBP: Bullish Movement Confirmed 🇪🇺🇬🇧
I think that EURGBP has finally completed a correctional
movement in a strong uptrend.
A bullish violation of a resistance line of a falling channel
after a test of a key support provides a strong confirmation.
I expect a move up at least to 0.8688
❤️Please, support my work with like, thank you!❤️
I am part of Trade Nation's Influencer program and receive a monthly fee for using their TradingView charts in my analysis.

NZDUSD H1 | Could the Kiwi reverse from here?Based on the H1 chart analysis, we could see the price rise to the sell entry, which is a pullback resistance and could reverse to the downside.
Sell entry is at 0.5879, which is a pullback resistance.
Stop loss is at 0.5896, which is a pullback resistance.
Take profit is at 0.5852, which is a pullback support.
High Risk Investment Warning
Trading Forex/CFDs on margin carries a high level of risk and may not be suitable for all investors. Leverage can work against you.
Stratos Markets Limited (tradu.com ):
CFDs are complex instruments and come with a high risk of losing money rapidly due to leverage. 65% of retail investor accounts lose money when trading CFDs with this provider. You should consider whether you understand how CFDs work and whether you can afford to take the high risk of losing your money.
Stratos Europe Ltd (tradu.com ):
CFDs are complex instruments and come with a high risk of losing money rapidly due to leverage. 66% of retail investor accounts lose money when trading CFDs with this provider. You should consider whether you understand how CFDs work and whether you can afford to take the high risk of losing your money.
Stratos Global LLC (tradu.com ):
Losses can exceed deposits.
Please be advised that the information presented on TradingView is provided to Tradu (‘Company’, ‘we’) by a third-party provider (‘TFA Global Pte Ltd’). Please be reminded that you are solely responsible for the trading decisions on your account. There is a very high degree of risk involved in trading. Any information and/or content is intended entirely for research, educational and informational purposes only and does not constitute investment or consultation advice or investment strategy. The information is not tailored to the investment needs of any specific person and therefore does not involve a consideration of any of the investment objectives, financial situation or needs of any viewer that may receive it. Kindly also note that past performance is not a reliable indicator of future results. Actual results may differ materially from those anticipated in forward-looking or past performance statements. We assume no liability as to the accuracy or completeness of any of the information and/or content provided herein and the Company cannot be held responsible for any omission, mistake nor for any loss or damage including without limitation to any loss of profit which may arise from reliance on any information supplied by TFA Global Pte Ltd.
The speaker(s) is neither an employee, agent nor representative of Tradu and is therefore acting independently. The opinions given are their own, constitute general market commentary, and do not constitute the opinion or advice of Tradu or any form of personal or investment advice. Tradu neither endorses nor guarantees offerings of third-party speakers, nor is Tradu responsible for the content, veracity or opinions of third-party speakers, presenters or participants.

USDJPY H1 | Bullish bounceUSD/JPY is falling towards the buy entry, which acts as a pulback support and could bounce from this level to tour takeprofit.
Buy entry is at 147.92, which is a pullback support.
Stop loss is at 147.47, which is a pullback support that lines up with the 138.2% Fibonacci extension.
Take profit is at 148.75, which is a pullback resistance.
High Risk Investment Warning
Trading Forex/CFDs on margin carries a high level of risk and may not be suitable for all investors. Leverage can work against you.
Stratos Markets Limited (tradu.com ):
CFDs are complex instruments and come with a high risk of losing money rapidly due to leverage. 65% of retail investor accounts lose money when trading CFDs with this provider. You should consider whether you understand how CFDs work and whether you can afford to take the high risk of losing your money.
Stratos Europe Ltd (tradu.com ):
CFDs are complex instruments and come with a high risk of losing money rapidly due to leverage. 66% of retail investor accounts lose money when trading CFDs with this provider. You should consider whether you understand how CFDs work and whether you can afford to take the high risk of losing your money.
Stratos Global LLC (tradu.com ):
Losses can exceed deposits.
Please be advised that the information presented on TradingView is provided to Tradu (‘Company’, ‘we’) by a third-party provider (‘TFA Global Pte Ltd’). Please be reminded that you are solely responsible for the trading decisions on your account. There is a very high degree of risk involved in trading. Any information and/or content is intended entirely for research, educational and informational purposes only and does not constitute investment or consultation advice or investment strategy. The information is not tailored to the investment needs of any specific person and therefore does not involve a consideration of any of the investment objectives, financial situation or needs of any viewer that may receive it. Kindly also note that past performance is not a reliable indicator of future results. Actual results may differ materially from those anticipated in forward-looking or past performance statements. We assume no liability as to the accuracy or completeness of any of the information and/or content provided herein and the Company cannot be held responsible for any omission, mistake nor for any loss or damage including without limitation to any loss of profit which may arise from reliance on any information supplied by TFA Global Pte Ltd.
The speaker(s) is neither an employee, agent nor representative of Tradu and is therefore acting independently. The opinions given are their own, constitute general market commentary, and do not constitute the opinion or advice of Tradu or any form of personal or investment advice. Tradu neither endorses nor guarantees offerings of third-party speakers, nor is Tradu responsible for the content, veracity or opinions of third-party speakers, presenters or participants.

USDCHF H1 | Falling towards major supportUSD/CHF is falling towards the buy entry which acts as an overlap support that aligns with the 50% Fibonacci retracement and could bounce from this level to the upside.
Buy entry is at 0.8027, which is an overlap support that aligns with the 50% Fibonacci retracement.
Stop loss is at 0.8008, which is a pullback support that is slightly above the 78.6% Fibonacci retracement.
Take profit is at 0.8067, which is a pullback resistance.
High Risk Investment Warning
Trading Forex/CFDs on margin carries a high level of risk and may not be suitable for all investors. Leverage can work against you.
Stratos Markets Limited (tradu.com ):
CFDs are complex instruments and come with a high risk of losing money rapidly due to leverage. 65% of retail investor accounts lose money when trading CFDs with this provider. You should consider whether you understand how CFDs work and whether you can afford to take the high risk of losing your money.
Stratos Europe Ltd (tradu.com ):
CFDs are complex instruments and come with a high risk of losing money rapidly due to leverage. 66% of retail investor accounts lose money when trading CFDs with this provider. You should consider whether you understand how CFDs work and whether you can afford to take the high risk of losing your money.
Stratos Global LLC (tradu.com ):
Losses can exceed deposits.
Please be advised that the information presented on TradingView is provided to Tradu (‘Company’, ‘we’) by a third-party provider (‘TFA Global Pte Ltd’). Please be reminded that you are solely responsible for the trading decisions on your account. There is a very high degree of risk involved in trading. Any information and/or content is intended entirely for research, educational and informational purposes only and does not constitute investment or consultation advice or investment strategy. The information is not tailored to the investment needs of any specific person and therefore does not involve a consideration of any of the investment objectives, financial situation or needs of any viewer that may receive it. Kindly also note that past performance is not a reliable indicator of future results. Actual results may differ materially from those anticipated in forward-looking or past performance statements. We assume no liability as to the accuracy or completeness of any of the information and/or content provided herein and the Company cannot be held responsible for any omission, mistake nor for any loss or damage including without limitation to any loss of profit which may arise from reliance on any information supplied by TFA Global Pte Ltd.
The speaker(s) is neither an employee, agent nor representative of Tradu and is therefore acting independently. The opinions given are their own, constitute general market commentary, and do not constitute the opinion or advice of Tradu or any form of personal or investment advice. Tradu neither endorses nor guarantees offerings of third-party speakers, nor is Tradu responsible for the content, veracity or opinions of third-party speakers, presenters or participants.

GBPUSD H4 | bearish reversalGBP/USD is reacting off the sell entry which is a pullback resistance that lines up with the 61.8% FIbonacci retracement and could reverse from this level to our take profit.
Sell entry is at 1.3457, which is a pullback resistance.
Stop loss is at 1.3544, which is a multi swing high resistance.
Take profit is at 1.3352, which is a pullback support.
High Risk Investment Warning
Trading Forex/CFDs on margin carries a high level of risk and may not be suitable for all investors. Leverage can work against you.
Stratos Markets Limited (tradu.com ):
CFDs are complex instruments and come with a high risk of losing money rapidly due to leverage. 65% of retail investor accounts lose money when trading CFDs with this provider. You should consider whether you understand how CFDs work and whether you can afford to take the high risk of losing your money.
Stratos Europe Ltd (tradu.com ):
CFDs are complex instruments and come with a high risk of losing money rapidly due to leverage. 66% of retail investor accounts lose money when trading CFDs with this provider. You should consider whether you understand how CFDs work and whether you can afford to take the high risk of losing your money.
Stratos Global LLC (tradu.com ):
Losses can exceed deposits.
Please be advised that the information presented on TradingView is provided to Tradu (‘Company’, ‘we’) by a third-party provider (‘TFA Global Pte Ltd’). Please be reminded that you are solely responsible for the trading decisions on your account. There is a very high degree of risk involved in trading. Any information and/or content is intended entirely for research, educational and informational purposes only and does not constitute investment or consultation advice or investment strategy. The information is not tailored to the investment needs of any specific person and therefore does not involve a consideration of any of the investment objectives, financial situation or needs of any viewer that may receive it. Kindly also note that past performance is not a reliable indicator of future results. Actual results may differ materially from those anticipated in forward-looking or past performance statements. We assume no liability as to the accuracy or completeness of any of the information and/or content provided herein and the Company cannot be held responsible for any omission, mistake nor for any loss or damage including without limitation to any loss of profit which may arise from reliance on any information supplied by TFA Global Pte Ltd.
The speaker(s) is neither an employee, agent nor representative of Tradu and is therefore acting independently. The opinions given are their own, constitute general market commentary, and do not constitute the opinion or advice of Tradu or any form of personal or investment advice. Tradu neither endorses nor guarantees offerings of third-party speakers, nor is Tradu responsible for the content, veracity or opinions of third-party speakers, presenters or participants.

Bearish drop off?The Loonie (USD/CAD) has rejected off the pivot, which acts as a pullback resistance and could drop to the 1st support that aligns with the 61.8% Fibonacci retracement.
Pivot: 1.3823
1st Support: 1.3770
1st Resistance: 1.3858
Disclaimer:
The above opinions given constitute general market commentary, and do not constitute the opinion or advice of IC Markets or any form of personal or investment advice.
Any opinions, news, research, analyses, prices, other information, or links to third-party sites contained on this website are provided on an "as-is" basis, are intended only to be informative, is not an advice nor a recommendation, nor research, or a record of our trading prices, or an offer of, or solicitation for a transaction in any financial instrument and thus should not be treated as such. The information provided does not involve any specific investment objectives, financial situation and needs of any specific person who may receive it. Please be aware, that past performance is not a reliable indicator of future performance and/or results. Past Performance or Forward-looking scenarios based upon the reasonable beliefs of the third-party provider are not a guarantee of future performance. Actual results may differ materially from those anticipated in forward-looking or past performance statements. IC Markets makes no representation or warranty and assumes no liability as to the accuracy or completeness of the information provided, nor any loss arising from any investment based on a recommendation, forecast or any information supplied by any third-party.

Potential bearish continuation?EUR/AUD is rising towards the pivot which acts as an overlap resistance that lines up with the 38.2% Fibonacci retracement and could reverse to the 1st support.
Pivot: 1.79259
1st Support: 1.77764
1st Resistance: 1.79745
Disclaimer:
The above opinions given constitute general market commentary, and do not constitute the opinion or advice of IC Markets or any form of personal or investment advice.
Any opinions, news, research, analyses, prices, other information, or links to third-party sites contained on this website are provided on an "as-is" basis, are intended only to be informative, is not an advice nor a recommendation, nor research, or a record of our trading prices, or an offer of, or solicitation for a transaction in any financial instrument and thus should not be treated as such. The information provided does not involve any specific investment objectives, financial situation and needs of any specific person who may receive it. Please be aware, that past performance is not a reliable indicator of future performance and/or results. Past Performance or Forward-looking scenarios based upon the reasonable beliefs of the third-party provider are not a guarantee of future performance. Actual results may differ materially from those anticipated in forward-looking or past performance statements. IC Markets makes no representation or warranty and assumes no liability as to the accuracy or completeness of the information provided, nor any loss arising from any investment based on a recommendation, forecast or any information supplied by any third-party.
