Bullish bounce off 61.8% Fibonacci support?USD/ZAR is falling towards the pivot which acts as a pullback support that aligns with the 61.8% Fibonacci retracement and could bounce to the 1st resistance.
Pivot: 17.14336
1st Support: 17.06139
1st Resistance: 17.28160
Disclaimer:
The opinions given above constitute general market commentary and do not constitute the opinion or advice of IC Markets or any form of personal or investment advice.
Any opinions, news, research, analyses, prices, other information, or links to third-party sites contained on this website are provided on an "as-is" basis, are intended to be informative only, and are not advice, a recommendation, research, a record of our trading prices, an offer of, or solicitation for, a transaction in any financial instrument and thus should not be treated as such. The information provided does not involve any specific investment objectives, financial situation, or needs of any specific person who may receive it. Please be aware that past performance is not a reliable indicator of future performance and/or results. Past performance or forward-looking scenarios based upon the reasonable beliefs of the third-party provider are not a guarantee of future performance. Actual results may differ materially from those anticipated in forward-looking or past performance statements. IC Markets makes no representation or warranty and assumes no liability as to the accuracy or completeness of the information provided, nor any loss arising from any investment based on a recommendation, forecast, or any information supplied by any third party.
Forexsignals

Bullish breakout confirmed?GBP/CAD could fall towards the support level which is a pullback support and could bounce from this level to our take profit.
Entry: 1.8540
Why we like it:
There is a pullback support level.
Stop loss: 1.8436
Why we like it:
There is a pullback support level.
Take profit: 1.8710
Why we like it:
There is a pullback resistance level.
Enjoying your TradingView experience? Review us!
Please be advised that the information presented on TradingView is provided to Vantage (‘Vantage Global Limited’, ‘we’) by a third-party provider (‘Everest Fortune Group’). Please be reminded that you are solely responsible for the trading decisions on your account. There is a very high degree of risk involved in trading. Any information and/or content is intended entirely for research, educational and informational purposes only and does not constitute investment or consultation advice or investment strategy. The information is not tailored to the investment needs of any specific person and therefore does not involve a consideration of any of the investment objectives, financial situation or needs of any viewer that may receive it. Kindly also note that past performance is not a reliable indicator of future results. Actual results may differ materially from those anticipated in forward-looking or past performance statements. We assume no liability as to the accuracy or completeness of any of the information and/or content provided herein and the Company cannot be held responsible for any omission, mistake nor for any loss or damage including without limitation to any loss of profit which may arise from reliance on any information supplied by Everest Fortune Group.

Could we see a bearish reversal from here?EUR/JPY is rising towards the resistance level which is a pullback resistance and could reverse from this level to our take profit.
Entry: 181.17
Why we like it:
There is a pullback resistance level.
Stop loss: 182.03
Why we like it:
There is a swing high resistance level
Take profit: 178.84
Why we like it:
There is a pullback support level that aligns with the 50% Fibonacci retracement.
Enjoying your TradingView experience? Review us!
Please be advised that the information presented on TradingView is provided to Vantage (‘Vantage Global Limited’, ‘we’) by a third-party provider (‘Everest Fortune Group’). Please be reminded that you are solely responsible for the trading decisions on your account. There is a very high degree of risk involved in trading. Any information and/or content is intended entirely for research, educational and informational purposes only and does not constitute investment or consultation advice or investment strategy. The information is not tailored to the investment needs of any specific person and therefore does not involve a consideration of any of the investment objectives, financial situation or needs of any viewer that may receive it. Kindly also note that past performance is not a reliable indicator of future results. Actual results may differ materially from those anticipated in forward-looking or past performance statements. We assume no liability as to the accuracy or completeness of any of the information and/or content provided herein and the Company cannot be held responsible for any omission, mistake nor for any loss or damage including without limitation to any loss of profit which may arise from reliance on any information supplied by Everest Fortune Group.

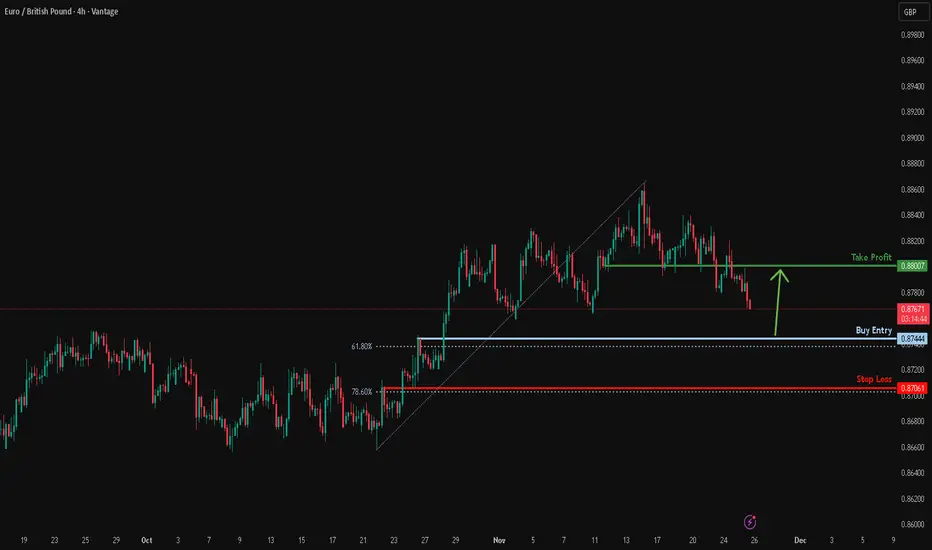
Falling towards pullback support?EUR/GBP is falling towards the support level which is a pullback support that is slightly above the 61.8% Fibonacci retracement and could bounce from this level to our take profit.
Entry: 0.8744
Why we like it:
There is a pullback support that is slightly above the 61.8% Fibonacci retracement.
Stop loss: 0.8706
Why we like it:
There is a pullback support that aligns with the 78.6% Fibonacci retracement.
Take profit: 0.8800
Why we like it:
There is an overlap resistance level.
Enjoying your TradingView experience? Review us!
Please be advised that the information presented on TradingView is provided to Vantage (‘Vantage Global Limited’, ‘we’) by a third-party provider (‘Everest Fortune Group’). Please be reminded that you are solely responsible for the trading decisions on your account. There is a very high degree of risk involved in trading. Any information and/or content is intended entirely for research, educational and informational purposes only and does not constitute investment or consultation advice or investment strategy. The information is not tailored to the investment needs of any specific person and therefore does not involve a consideration of any of the investment objectives, financial situation or needs of any viewer that may receive it. Kindly also note that past performance is not a reliable indicator of future results. Actual results may differ materially from those anticipated in forward-looking or past performance statements. We assume no liability as to the accuracy or completeness of any of the information and/or content provided herein and the Company cannot be held responsible for any omission, mistake nor for any loss or damage including without limitation to any loss of profit which may arise from reliance on any information supplied by Everest Fortune Group.
XAUUSD:LIVE TRADEHello friends
Well, we had a decline that we found support for with Fibonacci, and you can see that there was good support from buyers at this point.
We also have a head and shoulders pattern, which is again a positive.
The downtrend line has also been broken, which is also a positive point.
Now, given the arrival of buyers, we can enter the trade and move with it to the specified targets.
Note that the first principle of trading is capital and risk management, so be sure to follow it and avoid emotional behavior.
*Trade safely with us*

EURUSD Last bounce before a Lower Low.The EURUSD pair continues to trade within its 2-month Channel Down and following the start of the latest Bearish Leg since the November 13 Lower High rejection on the 1D MA50 (blue trend-line), we are now experiencing the first consolidation phase.
Based on the previous Bearish Legs of this pattern, this consolidation could end up in a short-term rebound limited by the 0.786 Fibonacci retracement level, only for it to be rejected and resume the bearish trend.
Both previous rejections eventually made a Lower Low for the Channel Down, hitting the -0.618 Fibonacci extension (minimum), declining in total Bearish Leg terms by at least -2.03%.
As a result, our 1.14200 medium-term Target (still above both conditions) remains valid, but we will close it earlier if we see the price hit the 1D MA200 (orange trend-line) and fail to close the 1D candle below it.
---
** Please LIKE 👍, FOLLOW ✅, SHARE 🙌 and COMMENT ✍ if you enjoy this idea! Also share your ideas and charts in the comments section below! This is best way to keep it relevant, support us, keep the content here free and allow the idea to reach as many people as possible. **
---
💸💸💸💸💸💸
👇 👇 👇 👇 👇 👇

EURGBPEURGBP price is near the support zone 0.87811-0.87663. If the price fails to break through the 0.87663 level, a rebound is likely. Consider buying the red zone.
🔥Trading futures, forex, CFDs and stocks carries a risk of loss.
Please consider carefully whether such trading is suitable for you.
>>GooD Luck 😊
❤️ Like and subscribe to never miss a new idea!

NZDCAD: Move Down Ahead 🇳🇿🇨🇦
NZDCAD is trading in a downtrend on a daily.
After updating a new low, the price bounced to a significant
resistance based on a falling trend line and a horizontal structure.
Odds are high that the pair will drop from there.
Expect a drop to 0.787 level.
❤️Please, support my work with like, thank you!❤️
I am part of Trade Nation's Influencer program and receive a monthly fee for using their TradingView charts in my analysis.

CHFJPY: Overbought Market & Pullback 🇨🇭🇯🇵
CHFJPY finally leaves some reversal clues.
I see a confirmed breakout of a daily support with
a high momentum bearish candle.
I think that a correction will continue and the price
will drop at least to 192.75 level
❤️Please, support my work with like, thank you!❤️
I am part of Trade Nation's Influencer program and receive a monthly fee for using their TradingView charts in my analysis.

DXY Coils Above 100 – Build-Up Before the Breakout?1. Recap of Recent Analysis
In my last DXY update, I highlighted the 100.00 zone as both a major psychological resistance and my initial upside target for the entire rise from 99.
Price reached that zone perfectly.
Since then, the index has been consolidating, but not in a weak way — the structure looks tight, controlled, and directional, not corrective or exhausted.
2. Current Market Context – Sideways, But With a Bullish Tilt
What stands out in this consolidation is:
- DXY is not rejecting 100 zone aggressively.
- Candles are small but.
- Sellers are not showing real control.
This type of behavior suggests a market that is building energy, not one that is rolling over.
The sideways action appears more like a pause before a breakout, not the start of a larger correction.
3. Technical Outlook – Trend is Up Since Mid-September
The broader structure is clear:
- DXY has been in an uptrend since mid-September.
Based on the trend, structure, and consolidation behaviour, the probability favors upside continuation.
Next technical target:
➡️ 102.00 zone
This level stands out as the next meaningful resistance and a natural extension of the current rally.
4. Trading Plan – Follow the Trend, Don’t Fight It
My approach remains simple:
Bullish outlook stays active as long as DXY holds above 99.20.
I expect a break above resistance soon, especially if volatility picks up.
First major target: 102.
Only if DXY fails dramatically at 100 with strong rejections would I consider a short-term bearish adjustment — not the case right now.
5. Conclusion – The Dollar Looks Ready for the Next Push
The index is coiling at resistance, but the structure favors buyers, not sellers.
Given the steady uptrend since September and the controlled consolidation just above 100, the most probable scenario remains an upside continuation toward 102. 💵📈

GOLD ANALYSIS (Nov 25, 2025) | XAUUSD Next MoveOANDA:XAUUSD GOLD ANALYSIS What’s Moving the Market Today? (November 25, 2025)
Welcome back to Trade with DECRYPTERS, where we turn complex smart-money charts into clean buy & sell zones.
Keep it simple let the levels guide your decisions.
*📰 Market Overview*
Gold is stabilizing after a sharp impulsive rally toward the Smart Money Sell Area (4165–4148) and is currently hovering around $4,140–4,150.
The Dollar Index stays firm near 100.20, keeping upside capped while buyers continue defending deeper discounts.
Volatility remains moderate as the market awaits high-impact macro data and clarity from the Fed.
*Key Fundamentals Driving Today’s Move*
📈 DXY steady near 100.20 → limits bullish continuation
🏦 Fed divisions on December cuts → rate-cut expectations drop
🌍 Geopolitical risks (US–China tariffs, Middle East tensions) keep safe-haven demand alive
🏛 Central bank buying strong — Poland, Azerbaijan & Kazakhstan continue accumulation
📊 ETF flows slow in late November as investors partially book profits
The tug-of-war between hawkish Fed tone and global risk premium keeps gold trading inside a tight structure.
*📆 What’s Ahead Key Events to Watch*
🔸 Flash PMIs — This Week
Manufacturing expected ~49
Services expected ~51
Weak PMI → boosts rate-cut probability → gold bullish
Strong PMI → DXY bounce → gold dips toward demand zones
🔸 US Q3 GDP & Jobless Claims
First major data release after the recent government shutdown.
A strong GDP print could delay rate-cut bets → gold bearish short-term.
🔸 FOMC Meeting — December 16
Markets lean toward a pause, but a dovish shift could push gold toward 4180 → 4220+.
Hawkish tone risks flushing price into 4085–4095 or deeper smart-money zones.
🔸 Geopolitical Premium
Any escalation = instant gold spike
Calm environment + strong USD = controlled pullbacks
*🟩 GOLD TECHNICAL LEVELS*
Gold continues to respect the mid-range structure, rejecting premium levels and seeking discounts for re-accumulation.
After a strong impulse from 4085–4095, price surged into 4148–4165, where sellers remain active.
*🎯 EQUILIBRIUM (EQ): 4122 – 4125*
This is the true intraday pivot.
Hold Above EQ
Bullish momentum continues toward:
➡️ 4148 → 4165 → 4180
Stay Below EQ
Price weakens toward:
➡️ 4095 → 4085
Possible deeper sweep if macro data disappoints.
*🟩 📌 SCALP BUY AREA: 4085 – 4095*
Strong demand zone where smart money previously accumulated.
Ideal for:
✔️ Intraday dip buys
✔️ First reaction entries
✔️ Counter-trend bounces inside discount areas
Break below this = fast drop toward deeper liquidity zones.
*🟥 📌 SMART MONEY SELL AREA: 4165 – 4148*
Chart’s primary reaction zone.
✔️ Sellers consistently defend this
✔️ Perfect area for scalping shorts
✔️ High probability liquidity-grab zone
A clean break above 4165 shifts momentum toward Extreme POIs.
*🔺 📌 EXTREME POI (Institutional Orders Zone): 4180 – 4200*
High-volume liquidity pocket.
If price taps this:
Expect manipulation wicks → sharp reversals unless backed by strong news.
*🚨 📌 ULTRA EXTREME POI (Smart Money $32M Block): 4220 – 4240*
This is the zone highlighted in your chart as
“32 Million $$ of Smart Money Orders.”
Only activated during:
✔️ Major volatility
✔️ Data spikes
✔️ Geo-political shocks
A premium zone ideal for swing-level reversal trades.
*🔻 📌 DEEP SMART MONEY BUY ORDERS (If Market Flushes): 3962 – 3978*
Only triggered on a larger macro-driven correction.
Institutions are heavily positioned here.
Expect:
✔️ Violent V-shaped recoveries
✔️ Long-wick reversals
✔️ High-reward long setups
Reclaiming above 4,000 from this zone confirms strong bullish intent.
*📌 Conclusion*
Gold remains firmly range-bound, with the 4122–4125 equilibrium acting as the true intraday pivot for direction. Holding above this zone keeps momentum tilted toward 4148–4165 and possibly 4180, while slipping below it exposes the market to dips into 4095–4085 where buyers have consistently defended. With the Fed’s uncertain tone and ongoing geopolitical risks shaping sentiment, gold continues to behave as a strict level-to-level market. Stay patient, let price return to your zones, and execute only where smart money is active.
Stay disciplined.
Let the levels do the work.
*🙌 Support the Analysis*
Please support this work with your likes & comments it motivates deeper daily analysis!
Share your charts & thoughts
Let’s grow together.
Best Regards,
*M. MOIZ KHATTAK | Founder — TRADE WITH DECRYPTERS*

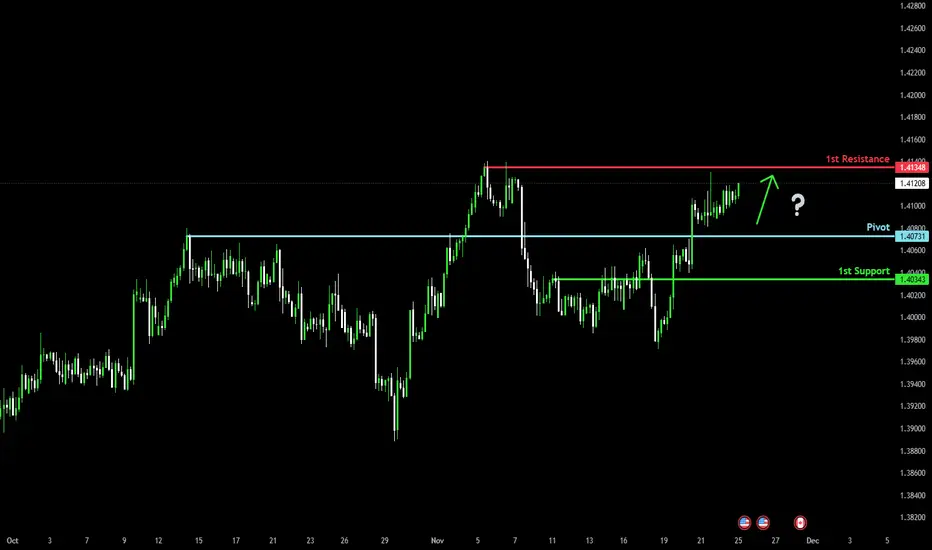
Bullish momentum to set to continue?Loonie (USD/CAD) could fall towards the pivot, which is a pullback support and could bounce to the 1st resistance.
Pivot: 1.4073
1st Support: 1.4034
1st Resistance: 1.4134
Disclaimer:
The opinions given above constitute general market commentary and do not constitute the opinion or advice of IC Markets or any form of personal or investment advice.
Any opinions, news, research, analyses, prices, other information, or links to third-party sites contained on this website are provided on an "as-is" basis, are intended to be informative only, and are not advice, a recommendation, research, a record of our trading prices, an offer of, or solicitation for, a transaction in any financial instrument and thus should not be treated as such. The information provided does not involve any specific investment objectives, financial situation, or needs of any specific person who may receive it. Please be aware that past performance is not a reliable indicator of future performance and/or results. Past performance or forward-looking scenarios based upon the reasonable beliefs of the third-party provider are not a guarantee of future performance. Actual results may differ materially from those anticipated in forward-looking or past performance statements. IC Markets makes no representation or warranty and assumes no liability as to the accuracy or completeness of the information provided, nor any loss arising from any investment based on a recommendation, forecast, or any information supplied by any third party.
Bullish continuation?Swissie (USD/CHF) could make a short-term pullback to the pivot and could bounce to the swing high resistance.
Pivot: 0.8030
1st Support: 0.7987
1st Resistance: 0.8109
Disclaimer:
The opinions given above constitute general market commentary and do not constitute the opinion or advice of IC Markets or any form of personal or investment advice.
Any opinions, news, research, analyses, prices, other information, or links to third-party sites contained on this website are provided on an "as-is" basis, are intended to be informative only, and are not advice, a recommendation, research, a record of our trading prices, an offer of, or solicitation for, a transaction in any financial instrument and thus should not be treated as such. The information provided does not involve any specific investment objectives, financial situation, or needs of any specific person who may receive it. Please be aware that past performance is not a reliable indicator of future performance and/or results. Past performance or forward-looking scenarios based upon the reasonable beliefs of the third-party provider are not a guarantee of future performance. Actual results may differ materially from those anticipated in forward-looking or past performance statements. IC Markets makes no representation or warranty and assumes no liability as to the accuracy or completeness of the information provided, nor any loss arising from any investment based on a recommendation, forecast, or any information supplied by any third party.

Could we see a bearish reversal?Cable (GBP/USD) is reacting off the pivot which aligns with the 38.2% Fibonacci retracement and could drop to the swing low support.
Pivot: 1.3106
1st Support: 1.3012
1st Resistance: 1.3179
Disclaimer:
The opinions given above constitute general market commentary and do not constitute the opinion or advice of IC Markets or any form of personal or investment advice.
Any opinions, news, research, analyses, prices, other information, or links to third-party sites contained on this website are provided on an "as-is" basis, are intended to be informative only, and are not advice, a recommendation, research, a record of our trading prices, an offer of, or solicitation for, a transaction in any financial instrument and thus should not be treated as such. The information provided does not involve any specific investment objectives, financial situation, or needs of any specific person who may receive it. Please be aware that past performance is not a reliable indicator of future performance and/or results. Past performance or forward-looking scenarios based upon the reasonable beliefs of the third-party provider are not a guarantee of future performance. Actual results may differ materially from those anticipated in forward-looking or past performance statements. IC Markets makes no representation or warranty and assumes no liability as to the accuracy or completeness of the information provided, nor any loss arising from any investment based on a recommendation, forecast, or any information supplied by any third party.

Bearish reversal off 50% Fibonacci resistance?Fiber (EUR/USD) could rise towards the pivot and could reverse to the pullback support.
Pivot: 1.1567
1st Support: 1.1494
1st Resistance: 1.1623
Disclaimer:
The opinions given above constitute general market commentary and do not constitute the opinion or advice of IC Markets or any form of personal or investment advice.
Any opinions, news, research, analyses, prices, other information, or links to third-party sites contained on this website are provided on an "as-is" basis, are intended to be informative only, and are not advice, a recommendation, research, a record of our trading prices, an offer of, or solicitation for, a transaction in any financial instrument and thus should not be treated as such. The information provided does not involve any specific investment objectives, financial situation, or needs of any specific person who may receive it. Please be aware that past performance is not a reliable indicator of future performance and/or results. Past performance or forward-looking scenarios based upon the reasonable beliefs of the third-party provider are not a guarantee of future performance. Actual results may differ materially from those anticipated in forward-looking or past performance statements. IC Markets makes no representation or warranty and assumes no liability as to the accuracy or completeness of the information provided, nor any loss arising from any investment based on a recommendation, forecast, or any information supplied by any third party.

Bearish reversal off key resistance?Ethereum (ETH/USD) is rising towards the pivot and could reverse to the 1st support, which has been identified as a pullback support.
Pivot: 3,057.32
1st Support: 2,818.56
1st Resistance: 3,230.74
Disclaimer:
The opinions given above constitute general market commentary and do not constitute the opinion or advice of IC Markets or any form of personal or investment advice.
Any opinions, news, research, analyses, prices, other information, or links to third-party sites contained on this website are provided on an "as-is" basis, are intended to be informative only, and are not advice, a recommendation, research, a record of our trading prices, an offer of, or solicitation for, a transaction in any financial instrument and thus should not be treated as such. The information provided does not involve any specific investment objectives, financial situation, or needs of any specific person who may receive it. Please be aware that past performance is not a reliable indicator of future performance and/or results. Past performance or forward-looking scenarios based upon the reasonable beliefs of the third-party provider are not a guarantee of future performance. Actual results may differ materially from those anticipated in forward-looking or past performance statements. IC Markets makes no representation or warranty and assumes no liability as to the accuracy or completeness of the information provided, nor any loss arising from any investment based on a recommendation, forecast, or any information supplied by any third party.

XAU/USD: Gold Uptrend - Buy at 4,090 & 4,044 USD📊 Market Structure
Gold is maintaining an upward structure after creating a series of bullish BoS from the Demand zone. Currently, the price is technically pulling back to discount zones, where the BUY side has more advantages.
Above, the 4,206 USD zone is confirmed as OB Bearish , acting as strong resistance and a potential reversal point for the SELL side.
Below, the discount zones including Fibo–Buy 4,090 and OB Bullish 4,044–4,047 USD are reasonable places to wait for BUY to continue following the main trend.
💎 Key Technical Zones
• Fibo–Buy Zone: 4,085 – 4,095 → priority BUY zone
• FVG Reaction Zone: around 4,095 – 4,105 → signal present → BUY immediately
• OB Bullish: 4,044 – 4,047 → deep, safe BUY zone
• OB Bearish: 4,206 → strong SELL zone
• Partial resistance for SELL scalp: 4,169 – 4,186 – 4,206 – 4,237
🎯 Trading Plan – BUY (Main Priority)
1️⃣ Main BUY – Fibo–Buy 4,090
• Entry: 4,085 – 4,095
• SL: below 4,060
• TP1: 4,169
• TP2: 4,186
• TP3: 4,206 / 4,237
→ This is the most beautiful discount zone according to structure + fibo + trendline.
2️⃣ BUY on Reaction – FVG
If the price only touches FVG 4,095–4,105 and then shows a strong rejection candle:
• BUY immediately when there is a signal
• Target remains: 4,169 → 4,186 → 4,206 → 4,237
3️⃣ Defensive BUY – OB Bullish 4,044
• Entry: 4,044 – 4,047
• SL: 4,020
• TP1: 4,095
• TP2: 4,169
• TP3: 4,206
→ This is the “last bottom” zone before the uptrend is threatened.
🎯 Trading Plan – SELL SCALP (Not the Main Trend)
Zones where SELL can react when a reversal candle appears:
• 4,169 USD
• 4,186 USD
• 4,206 USD (OB Bearish)
• 4,237 USD (Supply)
Entry SELL: when there is a clear rejection (H1 long wick / engulfing)
SL: above the zone 10–15 USD
TP: back to 4,186 → 4,169 → 4,128
→ These are counter-trend scalp orders, only for flexible traders.
🧠 Vincent’s View
The main trend is still up, adjustments down to FVG – Fibo – OB Bullish are all beautiful BUY opportunities.
The BUY side dominates as long as 4,044 is not broken – SELL is only secondary, BUY remains the main play.
“Buy at discount, sell at reaction — that’s how the market moves.”
⏰ Timeframe: 1H
✍️ Analysis by: Captain Vincent

Bearish reversal off 50% Fibonacci resistance?USD/JPY has rejected off the resistance level which acts as a pullback resistance that aligns with the 50% Fibonacci retracement and could drop from this level to our take profit.
Entry: 157.11
Why we like it:
There is a pullback that aligns with the 50% Fibonacci retracement.
Stop loss: 157.73
Why we like it:
There is a swing high resistance.
Take profit: 156.23
Why we like it:
There is a pullback support level.
Enjoying your TradingView experience? Review us!
Please be advised that the information presented on TradingView is provided to Vantage (‘Vantage Global Limited’, ‘we’) by a third-party provider (‘Everest Fortune Group’). Please be reminded that you are solely responsible for the trading decisions on your account. There is a very high degree of risk involved in trading. Any information and/or content is intended entirely for research, educational and informational purposes only and does not constitute investment or consultation advice or investment strategy. The information is not tailored to the investment needs of any specific person and therefore does not involve a consideration of any of the investment objectives, financial situation or needs of any viewer that may receive it. Kindly also note that past performance is not a reliable indicator of future results. Actual results may differ materially from those anticipated in forward-looking or past performance statements. We assume no liability as to the accuracy or completeness of any of the information and/or content provided herein and the Company cannot be held responsible for any omission, mistake nor for any loss or damage including without limitation to any loss of profit which may arise from reliance on any information supplied by Everest Fortune Group.

Bullish momentum to extend?USD/CHF has bounced off the support level which is a pullback support and could potentially rise from this level to our take profit.
Entry: 0.8065
Why we like it:
There is a pullback support level.
Stop loss: 0.8037
Why we like it:
There is a pullback support level.
Take profit: 0.8123
Why we like it:
There is a swing high resistance level.
Enjoying your TradingView experience? Review us!
Please be advised that the information presented on TradingView is provided to Vantage (‘Vantage Global Limited’, ‘we’) by a third-party provider (‘Everest Fortune Group’). Please be reminded that you are solely responsible for the trading decisions on your account. There is a very high degree of risk involved in trading. Any information and/or content is intended entirely for research, educational and informational purposes only and does not constitute investment or consultation advice or investment strategy. The information is not tailored to the investment needs of any specific person and therefore does not involve a consideration of any of the investment objectives, financial situation or needs of any viewer that may receive it. Kindly also note that past performance is not a reliable indicator of future results. Actual results may differ materially from those anticipated in forward-looking or past performance statements. We assume no liability as to the accuracy or completeness of any of the information and/or content provided herein and the Company cannot be held responsible for any omission, mistake nor for any loss or damage including without limitation to any loss of profit which may arise from reliance on any information supplied by Everest Fortune Group.

Bearish drop?EUR/USD has rejected off the resistance level which is an overlap resistance that aligns with the 38.2% Fibonacci retracement and could drop from this level to our take profit.
Entry: 1.1554
Why we like it:
There is an overlap resistance level that aligns with the 38.2% Fibonacci retracement.
Stop loss: 1.1602
Why we like it:
There a pullback resistance that is slightly above the 61.8% Fibonacci retracement.
Take profit: 1.1475
Why we like it:
There is a swing low support.
Enjoying your TradingView experience? Review us!
Please be advised that the information presented on TradingView is provided to Vantage (‘Vantage Global Limited’, ‘we’) by a third-party provider (‘Everest Fortune Group’). Please be reminded that you are solely responsible for the trading decisions on your account. There is a very high degree of risk involved in trading. Any information and/or content is intended entirely for research, educational and informational purposes only and does not constitute investment or consultation advice or investment strategy. The information is not tailored to the investment needs of any specific person and therefore does not involve a consideration of any of the investment objectives, financial situation or needs of any viewer that may receive it. Kindly also note that past performance is not a reliable indicator of future results. Actual results may differ materially from those anticipated in forward-looking or past performance statements. We assume no liability as to the accuracy or completeness of any of the information and/or content provided herein and the Company cannot be held responsible for any omission, mistake nor for any loss or damage including without limitation to any loss of profit which may arise from reliance on any information supplied by Everest Fortune Group.

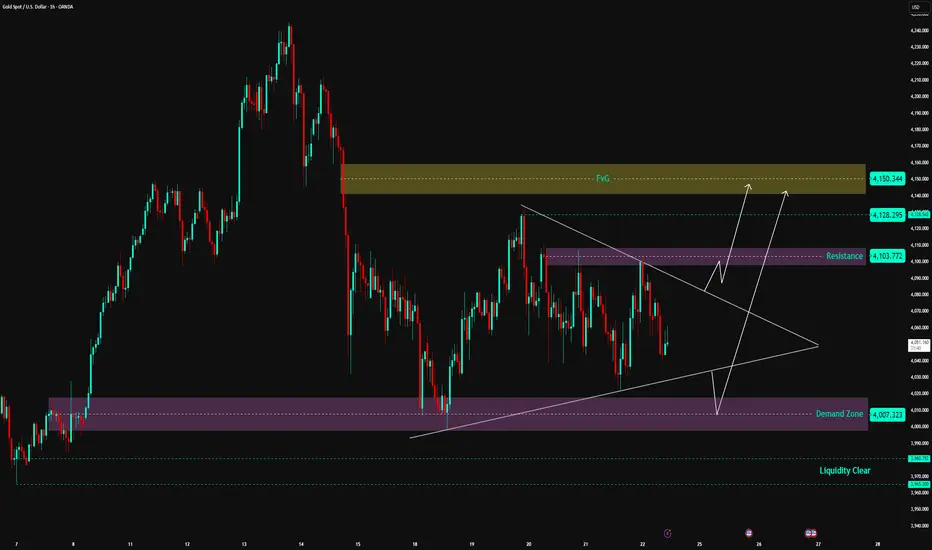
XAUUSD | Gold Set to Explode from Triangle Pattern—Act Now!📊 Market Structure
Gold is entering a tight accumulation phase within a Symmetrical Triangle pattern – indicating compression before a strong breakout.
On the downside, the price is still supported by the Demand Zone 4,007 – 4,020 USD , which is the main support area for the medium-term uptrend structure.
On the upside, the Resistance Zone 4,103 – 4,110 USD continuously exerts pressure, causing price rejection.
Currently, gold is trading right in the middle of the compression triangle → the market is preparing to choose a direction.
Looking at the wave structure, the trend slightly leans towards a break up to sweep liquidity in the high area.
💎 Key Technical Zones
• ⭐ FVG Supply Zone: 4,128 – 4,150 USD → expected strong reaction area if price breaks up
• 🟣 Resistance Zone: 4,103 – 4,110 USD → decisive area for direction
• 🟪 Demand Zone: 4,007 – 4,020 USD → strong base maintaining structure
• 🟦 Liquidity Clear: 3,980 USD → risk area if price collapses the triangle
🎯 Trading Plan – Two Possible Scenarios
1️⃣ BUY – Wait for Breakout from Triangle (priority scenario)
If the price breaks the resistance zone 4,103 – 4,110 with a strong H1 closing candle:
• Entry: 4,112 – 4,115
• SL: 4,095
• TP1: 4,128
• TP2: 4,145
• TP3: 4,150 (reach FVG)
→ This is a trend-following setup, with a high probability of sweeping liquidity above after the break.
2️⃣ BUY – Retest Demand Zone 4,007 – 4,020
If the price continues to follow the triangle pattern and falls to the trendline + demand zone:
• Entry: 4,010 – 4,017
• SL: 3,990
• TP1: 4,103
• TP2: 4,128
• TP3: 4,150
→ This is a very strong confluence area between Demand Zone + Trendline + pattern base.
❌ SELL? When is it valid?
Currently, selling is not prioritized, as the price is still above the Demand Zone and the larger structure still favors an uptrend.
Selling is only valid if the price:
• Breaks strongly below 4,007 USD
→ At this point, the market turns bearish, with a distant target of 3,980 USD.
🧠 Vincent’s View
Gold is under strong compression. When the triangle pattern is broken, the move will be extremely fast and decisive.
The current trend leans towards breaking up and heading straight into the FVG area 4,128 – 4,150 USD.
Just be patient and wait for the confirmation candle — don’t predict, react to the market.
⚡ “Breakout is born from pressure — patience profits.”
⏰ Timeframe: 1H
📅 Update: 24/11/2025
✍️ Analysis by: Captain Vincent
XAUUSDHello Traders! 👋
What are your thoughts on GOLD?
Gold continues to trade in a range-bound and choppy structure, showing back-and-forth movement with no clear directional bias in the short term.
In the current zone, price is trapped between channel resistance and key support, and a breakout from either side will determine the next strong move.
We expect gold to form a short-term upward correction toward the upper boundary of the descending channel and the resistance zone.
Once price reaches this area, a bearish rejection is likely, leading to a continuation of the downward trend toward lower support levels.
If gold breaks below the 4050 support zone and the daily candle closes below this zone,
this will confirm further downward continuation without any bullish pullback, signaling a stronger bearish wave.
As long as gold remains below the resistance zone and channel top, the short-term bias stays bearish.
Any upward movement is likely to be corrective, providing a potential setup for continuation to the downside.
Don’t forget to like and share your thoughts in the comments! ❤️

AUD/JPY – H4 - Rising Wedge Breakdown | Key Zones Targeted📝 Description:
The AUD/JPY pair is showing a clear Rising Wedge formation on the 4H timeframe, with three clean touches on the trendline—indicating weakening bullish momentum. Price has now broken below the lower trendline, suggesting increased probability of bearish continuation toward the next key zones. FX:AUDJPY
This setup highlights:
Rising Wedge pattern
Trendline break
Retest opportunity
Key support zones at 99.00 and 97.80
AUD fundamentals: driven by commodity demand, RBA policy, and risk sentiment
JPY fundamentals: influenced by BOJ stance, yields, and safe-haven flows
This analysis is ideal for traders monitoring price action, forex patterns, and high-probability setups on AUD/JPY.
Keep an eye on upcoming economic releases from RBA, BOJ, and US data, as they can influence risk sentiment and impact this pair heavily.
✅ Support this analysis with a
LIKE 👍 | COMMENT 💬 | FOLLOW 🔔
It helps a lot & keeps the ideas coming!
⚠️ Disclaimer: This analysis is for educational purposes only and does not constitute financial advice. Forex trading involves high risk. Trade only with capital you can afford to lose and always do your own research.
