Bullish reversal for the Aussie?The price has bounced off the pivot, which is a pullback support, and could rise to the 1st resistance, which has been identified as an overlap resistance.
Pivot: 0.6468
1st Support: 0.6444
1st Resistance: 0.6512
Disclaimer:
The opinions given above constitute general market commentary and do not constitute the opinion or advice of IC Markets or any form of personal or investment advice.
Any opinions, news, research, analyses, prices, other information, or links to third-party sites contained on this website are provided on an "as-is" basis, are intended to be informative only, and are not advice, a recommendation, research, a record of our trading prices, an offer of, or solicitation for, a transaction in any financial instrument and thus should not be treated as such. The information provided does not involve any specific investment objectives, financial situation, or needs of any specific person who may receive it. Please be aware that past performance is not a reliable indicator of future performance and/or results. Past performance or forward-looking scenarios based upon the reasonable beliefs of the third-party provider are not a guarantee of future performance. Actual results may differ materially from those anticipated in forward-looking or past performance statements. IC Markets makes no representation or warranty and assumes no liability as to the accuracy or completeness of the information provided, nor any loss arising from any investment based on a recommendation, forecast, or any information supplied by any third party.
Forexsignals

Bearish reversal off key reversal?Fiber (EUR/USD) is rising towards the pivot, which acts as an overlap resistance and could reverse to the 1st support, which is a swing low support.
Pivot: 1.1553
1st Support: 1.1481
1st Resistance: 1.1602
Disclaimer:
The opinions given above constitute general market commentary and do not constitute the opinion or advice of IC Markets or any form of personal or investment advice.
Any opinions, news, research, analyses, prices, other information, or links to third-party sites contained on this website are provided on an "as-is" basis, are intended to be informative only, and are not advice, a recommendation, research, a record of our trading prices, an offer of, or solicitation for, a transaction in any financial instrument and thus should not be treated as such. The information provided does not involve any specific investment objectives, financial situation, or needs of any specific person who may receive it. Please be aware that past performance is not a reliable indicator of future performance and/or results. Past performance or forward-looking scenarios based upon the reasonable beliefs of the third-party provider are not a guarantee of future performance. Actual results may differ materially from those anticipated in forward-looking or past performance statements. IC Markets makes no representation or warranty and assumes no liability as to the accuracy or completeness of the information provided, nor any loss arising from any investment based on a recommendation, forecast, or any information supplied by any third party.

Bullish bounce off?US Dollar Index (DXY) is falling towards the pivot and could bounce to the 1st resistance resistance.
Pivot: 99.78
1st Support: 99.34
1st Resistance: 100.71
Disclaimer:
The opinions given above constitute general market commentary and do not constitute the opinion or advice of IC Markets or any form of personal or investment advice.
Any opinions, news, research, analyses, prices, other information, or links to third-party sites contained on this website are provided on an "as-is" basis, are intended to be informative only, and are not advice, a recommendation, research, a record of our trading prices, an offer of, or solicitation for, a transaction in any financial instrument and thus should not be treated as such. The information provided does not involve any specific investment objectives, financial situation, or needs of any specific person who may receive it. Please be aware that past performance is not a reliable indicator of future performance and/or results. Past performance or forward-looking scenarios based upon the reasonable beliefs of the third-party provider are not a guarantee of future performance. Actual results may differ materially from those anticipated in forward-looking or past performance statements. IC Markets makes no representation or warranty and assumes no liability as to the accuracy or completeness of the information provided, nor any loss arising from any investment based on a recommendation, forecast, or any information supplied by any third party.

EUR/USD: Bearish Drop to 1.1483?As the previous analysis worked exactly as predicted, FX:EURUSD is flashing bearish signals on the 4-hour chart , with price forming successive lower highs under a downward trendline, indicating sustained selling pressure and potential for a downside continuation if resistance holds firm. The setup aligns near the resistance zone for a high-probability short, especially as the pair tests key levels amid recent volatility.
Entry zone between 1.1638-1.1656 for a short position. Target at 1.1483 near the support zone, delivering a risk-reward ratio close to 1:4 . Set a stop loss on a close above 1.16775 to protect against upside breaks. 🌟 Look for confirmation on a break below the entry with increasing volume, amid ongoing USD strength versus the EUR.
Fundamentally , the pair has fallen to around 1.1594 as markets await key US data today, including manufacturing and construction releases, which could reinforce USD if positive—potentially pressuring EUR further amid low volatility and a lingering upward bias from last week's channel breakout. 💡
📝 Trade Setup
🎯 Entry Zone: 1.1638 – 1.1656 (short position)
🎯 Target:
1.1483 (major support zone)
❌ Stop Loss: Close above 1.16775
⚖️ Risk-to-Reward: Approximately 1:4
What's your outlook on this setup? Drop your thoughts below! 👇

Gold Recovers, Targeting FVG & Liquidity Zone 4.20x📊 Market Structure
Gold has completed a deep decline from the 4,20x zone and continuously created bearish BoS, indicating sellers controlled the period from 14–18/11.
However, a significant sign appeared when:
Price created an Order Block at 4,008 USD
Then surged to create a Change of Character (ChoCH) on the H1 timeframe
The market maintained higher lows on the intraday structure
This indicates that selling momentum has weakened, and buyers are starting to rebuild a short-term bullish structure.
Currently, the price is approaching the Supply & Resistance zone at 4,086 USD – the zone confirming the strength of the BUY side.
If the price decisively breaks this zone, the next targets are clear:
FVG 4,150 USD
Liquidity Zone 4,202 USD – where old peak liquidity is concentrated
💎 Key Technical Zones
• Order Block: 4,000 – 4,009 USD → the main reversal zone of the current rally
• Supply & Resistance: 4,078 – 4,086 USD → trend confirmation point
• FVG Zone: 4,132 – 4,150 USD → zone where a corrective reaction may occur
• Liquidity Zone $$$: 4,195 – 4,205 USD → target of large capital flows
🎯 Trading Plan – Prioritize BUY according to structure
1️⃣ BUY Setup – Trend Following
Activated when price breaks and retests the 4,086 USD zone:
Entry: 4,086 – 4,090
SL: 4,058
TP1: 4,132
TP2: 4,150
TP3: 4,202
→ This is the highest probability setup: a new uptrend is forming + retesting the invalidated supply zone.
2️⃣ BUY Setup 2 – Deep Retracement (safer)
If the price is rejected at 4,086 and returns to test the lower zone:
Entry: 4,050 – 4,058 (Premium Zone on chart)
SL: 4,028
TP: 4,086 → 4,132 → 4,150
→ This setup offers a higher R:R, suitable for patient traders.
3️⃣ SELL Scalp – For intraday only
If the price hits FVG 4,150 and shows strong rejection signals:
Entry: 4,148–4,150
SL: 4,160
TP: 4,130 → 4,100
→ Not for swing traders. This is merely a technical reaction at the FVG zone.
🧠 Vincent’s View
The main trend of the day leans towards recovery – expanding towards upper liquidity.
As long as the price remains above 4,008 USD, the BUY side will continue to lead the market.
“Follow the structure, follow the liquidity — the market never lies.”

AUD/CHF: Bearish Slide to 0.51425?FX:AUDCHF is displaying bearish continuation signals on the 1-hour chart , with price forming successive lower highs under a downward trendline, suggesting persistent seller dominance and potential for further downside if resistance levels hold. The dual entry points highlight a layered approach, but this increases exposure—always emphasize strict risk and capital management, such as position sizing based on account equity and using trailing stops to protect gains.
Entries at 0.5206 or 0.5224 for short positions. Target at 0.51425 🎯 near the support zone, offering an average risk-reward ratio around 1:2 .Set a stop loss on a close above 0.5254 to limit losses 📊.Seek confirmation with a bearish breakdown below entry and rising volume, amid the pair's choppy range 🌟.
Fundamentally , AUD/CHF has shown weakness, lingering around 0.5226 since late June, with recent Q3 Australian wage growth marking time and RBA navigating high inflation against slow growth, potentially capping AUD upside. Forecasts point to a weighted average target of 0.5158 by mid-December, signaling negative trends with volatility around 3.32%. 💡
📝 Trade Setup
🎯 Entry Zones (Short):
• 0.5206
• 0.5224
🎯 Target:
• TP: 0.51425 (major support zone)
❌ Stop Loss: Close above 0.5254
⚖️ Risk-to-Reward: Approximately 1:2 on average
📌 Be cautious with dual entries — use proper sizing to avoid overexposure.
What's your take on this setup? Drop your thoughts below! 👇

CADJPY: Ending Diagonal + RD(_) = Downtrend StartingToday, I’d like to share a Short positioning opportunity on the CADJPY pair .
In the current scenario, CADJPY is moving within a Resistance zone(112.100 JPY-109.500 JPY) and is close to a Potential Reversal Zone(PRZ) as well as the upper line of the ascending channel.
From an Elliott Wave perspective, it seems that CADJPY is completing the microwave 5 of the microwave C of the main wave Y , and the microwave 5 appears to be forming an Ending Diagonal .
Additionally, we can observe a negative Regular Divergence (RD-) between the peaks.
Fundamental analysis : Considering the above analysis, and also taking into account the fundamental conditions, Canada’s core inflation came in softer than expected, reinforcing the BoC’s easing path, while JPY benefits from the current risk-off tone. Fundamentally, CADJPY remains biased to the downside.
Finally, based on all the above, I expect that CADJPY will begin its downward trend, with a First target at 109.103 JPY
Take Profit(2): 108.543 JPY
Stop Loss(SL): 118.820 JPY(Worst)
Please respect each other's ideas and express them politely if you agree or disagree.
Canadian Dollar/ Japanese Yen Analysis (CADJPY), 4-hour time frame.
Be sure to follow the updated ideas.
Do not forget to put a Stop loss for your positions (For every position you want to open).
Please follow your strategy and updates; this is just my Idea, and I will gladly see your ideas in this post.
Please do not forget the ✅' like '✅ button 🙏😊 & Share it with your friends; thanks, and Trade safe.

BUY GBPUSD (head and shoulders pattern formed)A head and shoulder pattern was recently formed on the GBPUSD paid indicating it is time for a major reversal to the upside. The price also broke through all the last resistance levels and has nowhere else to go to except the next resistance zone which is marked as the next take profit level. We will be buying GBPUSD NOW!

SELL NZDUSD - easy profitable trade opportunity!For many weeks NZDUSD has been dropping to the downside and is in a very clear downtrend. NZDUSD has tried to gain support but each time it holds onto support, it breaks through to the downside. NZDUSD recently tried to hold onto the latest support zone but once again it broke through which means it's time to sell and take profit at the next support level!

SELL EURUSD - Amazing trade opportunityEURUSD has broken a powerful channel that it was stuck in-between for a few weeks and broke the major support zone. The price recently retested the support trendline (which is now acting as resistance) .. From here it will continue to remain bearish and likely hit the next support level which is marked as "take profit". This is a very good zone to sell at! SELL EURUSD.

NZD/USD Bearish Play — Trend Reversal + Structured Sell Zones🐻 BEARISH SWING TRADE SETUP | NZD/USD "The Kiwi"
Hey Traders! 👋 Here's a detailed swing trade analysis for the NZD/USD pair, focusing on a high-probability bearish continuation play. We're using a strategic layered entry method to optimize our risk.
📈 Trade Thesis & Market Context
A bearish structure is confirmed, and price is currently exhibiting a classic pullback towards a key dynamic resistance (Moving Average). This setup aims to capture the next leg down in line with the prevailing downtrend.
⚡ The "Thief" Layered Entry Strategy
This plan uses multiple limit orders to "scale in" to the position, averaging your entry price as the pullback unfolds.
🎯 Entry Zone (Sell Limit Orders):
Layer 1: 0.56500
Layer 2: 0.56400
Layer 3: 0.56300
💡 Pro Tip: You can increase or decrease the number of layers and adjust prices based on your own capital and risk management.
🚨 Risk Management (Your Responsibility!)
Stop Loss (SL): A suggested stop loss is above the recent structure at 0.56700.
⚠️ IMPORTANT NOTE: I am NOT recommending you use only my SL. You MUST adjust your stop loss based on your personal risk tolerance, account size, and strategy. The market is unpredictable; protect your capital first!
🎯 Profit Targets (Take Profit - TP)
Primary Target (TP): 0.55900
Rationale: This target aligns with a strong support zone, oversold conditions, and a potential liquidity pool ("trap"). The goal is to "escape" with profits before any significant bounce.
⚠️ REMINDER: Just like the SL, this is a suggested target. You are free to take profits earlier or adjust based on how price action develops. Manage your own trade!
🔍 Key Correlations & Pairs to Watch
Understanding the Kiwi's relationships is crucial for this trade's context.
AUD/USD ( OANDA:AUDUSD ): 🦘 The "Aussie" and "Kiwi" are highly correlated commodity brothers. A strong downtrend in AUD/USD often reinforces bearish momentum in NZD/USD.
USD/CNH ( FX:USDCNH ): 🇨🇳 China's economy is a major driver for New Zealand's exports (especially dairy). A stronger USD/CNH (weaker Yuan) can signal risk-off sentiment and pressure the NZD.
TVC:DXY (US Dollar Index): 🇺🇸 A strong overall US Dollar, as shown by a rising DXY, provides a strong tailwind for this bearish NZD/USD setup.

BTCUSDTBTCUSDT price is near the support level 90196-88441. If the price can hold above 88441, it is expected that the price will rebound. Consider buying the red zone.
** This is not financial advice.
🔥Trading futures, forex, CFDs and stocks carries a risk of loss.
Please consider carefully whether such trading is suitable for you.
>>GooD Luck 😊
❤️ Like and subscribe to never miss a new idea!

AUDJPY: Rise Continues 🇦🇺🇯🇵
AUDJPY will likely continue rising after a confirmed
bullish change of character and a formation of a bullish imbalance on a 4h time frame.
Expect a growth at least to 101.8
❤️Please, support my work with like, thank you!❤️
I am part of Trade Nation's Influencer program and receive a monthly fee for using their TradingView charts in my analysis.

XAUUSD Bullish Setup Toward 4100XAUUSD is showing a bullish setup after sweeping liquidity and rejecting strongly from the order block zone. Price is pushing upward toward the 4100 target, supported by previous range breakout, FVG imbalance, and clear resistance levels above. The chart signals continuation to the upside.

USDHKD Forex Pair is exploding as expectedMost traders keep chasing candles on the 5-minute chart, hoping to find magic. But magic doesn’t happen there — it happens when you learn to wait.
The USD/HKD Forex pair is the perfect example. We called the monthly demand level at 7.77 weeks ago, and look at it now — it’s reacting beautifully.
The big boys are buying while everyone else is still guessing. Let’s dive into the chart and see why this pair is offering both swing and intraday opportunities right now!
USDHKD Forex Analysis and Forecast
The USD/HKD Forex pair is doing exactly what supply and demand imbalances told us it would do.
The monthly demand level at 7.77 — the one we discussed in our last analysis — is playing out beautifully. Price reached this imbalance, and once again, demand took full control.
This isn’t the first time the US dollar has bounced hard from around the 7.75–7.78 range. Historically, whenever the dollar dips near that area, strong buyers step in, triggering a powerful bullish reaction.
Now, as the pair rallies from this strong monthly demand, we can already see strong impulses on the daily, 4H, and 1H timeframes. These are early signs of new buyers entering the market — perfect for Forex swing traders and intraday traders alike.

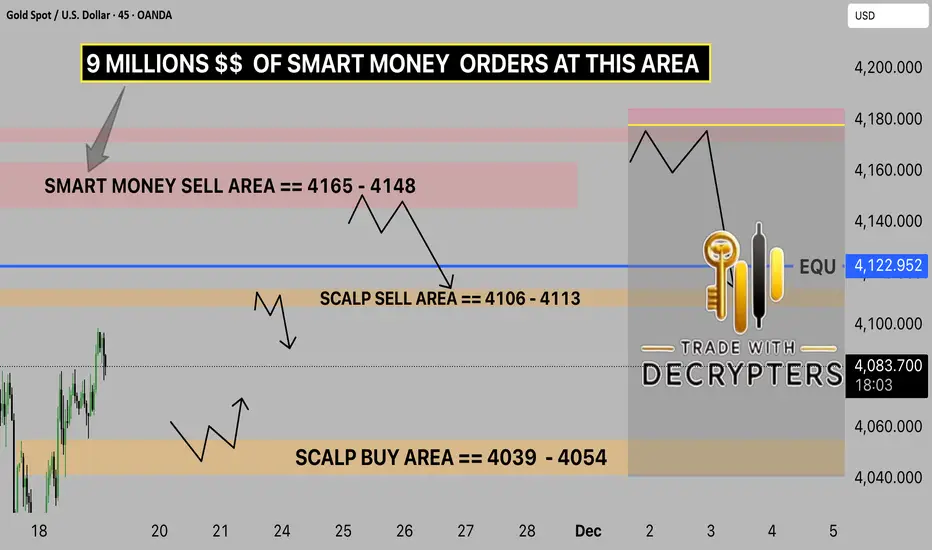
GOLD Analysis (Nov 19, 2025) - Key Levels for BreakoutOANDA:XAUUSD GOLD ANALYSIS What’s Moving the Market Today? (November 19, 2025)
Welcome back to Trade with DECRYPTERS, where we turn complex charts into clean buy & sell zones.
Keep it simple. Let levels drive your decisions.
*📰 Market Overview*
Gold dipped after failing to hold above $4,100, sliding toward the mid-range as the U.S. Dollar Index (DXY) climbs toward 99.55. Expectations for a December rate cut weaken (now ~47%), adding pressure on metals.
*Key fundamentals driving today’s volatility:*
📈 DXY rebound → reduces short-term gold momentum
🏦 Fed hawkish tone after October’s cut; policymakers want “pause & observe”
📉 Shutdown-related data blackout = mixed signals + unpredictable volatility
🌍 Geopolitical tensions (US–China tariffs, Mideast, Ukraine-Russia) continue to anchor safe-haven flows
🏛 Central banks still buying: Q3 +220t, Poland +67t YTD
*📊 ETF flows:*
ETF flows hit a record +222t in Q3, but November is seeing mild outflows even as AUM holds near $472B. It’s like investors took a big bite earlier, but are now nibbling less while still keeping most of their gold on the table.
*📆 What’s Ahead Key Events to Watch*
🔸 FOMC Meeting – Dec 10
Odds remain mixed with a slight hawkish tilt; any surprise tough tone could pressure gold short-term.
🔸 Data Blackout Continues
With CPI/NFP still imputed, November data may drop in clusters, triggering sudden volatility spikes.
🔸 Geopolitical Risk Premium
Escalation brings instant safe-haven demand, while de-escalation boosts DXY and pushes gold lower.
🟩 *GOLD TECHNICAL LEVELS*
By analyzing the #Gold chart on the 4H timeframe, we can see that after dropping to 3998 dollars, price found strong demand and has now climbed back up to around 4050 dollars.
*Whats NEXT ON GOLD ?* 👀👀
🎯 EQUILIBRIUM: 4122.95
Hold above = bullish momentum toward 4148
Stay below = re-test 4054 & possibly sweep 4039
🟩 📌 SCALP BUY AREA: 4039 – 4054
Strong intraday support + previous demand footprint.
🟥 📌 SCALP SELL AREA: 4106 – 4113
Expected rejection zone first reaction area.
🚨 📌 SMART MONEY SELL AREA: 4165 – 4148
CONCLUSION:-
Gold remains in a tight battle between demand at 4039–4054 and rejection zones near 4106–4113, with EQ at 4122.95 acting as the true directional trigger. Holding below EQ favors a pullback toward 4054/4039, while a clean break above opens momentum toward 4148–4165. Overall, range-bound with a slight downside bias until EQ is reclaimed.
*Please support me with your likes and comments to motivate me to share more analysis with you and share your opinion & chart with me !*
*Best Regards , M.MOIZ KHATTAK | FOUNDER OF TRADEWITHDECRYPTERS*
USDCAD: Buying After the Trap 🇺🇸🇨🇦
Quick update for the yesterday's post for USDCAD.
I finally see some strength of the buyers after a test
of the underlined intraday support.
A buying imbalance after a trap suggests a highly probable growth.
Expect a rise at least to 1.4013
❤️Please, support my work with like, thank you!❤️
I am part of Trade Nation's Influencer program and receive a monthly fee for using their TradingView charts in my analysis.

Hellena | GBP/USD (4H): SHORT to min wave "4" area 1.30100.Colleagues, I haven't reviewed the pound for a long time and now I finally did it)
The wave layout shows that the downward movement is not over yet. I think that wave “4” will soon complete its development and the impulse in wave ‘5’ will start, which will complete the big correction “C”. The minimum target is the support area at 1.30103.
Further we will observe the activity in this area.
Manage your capital correctly and competently! Only enter trades based on reliable patterns!

NASDAQ Signal : US 100 H1 / H4 : long !!!Hello Traders! 👋
What are your thoughts on NASDAQ ?
This correction could offer a buy-the-dip opportunity, with potential for a move back toward the recent highs.
NASDAQ ( US100 ) :
Market price : 24400
Buy limit 1 : 24200
buy limit 2 : 24000
Tp1 : 24600
Tp2 : 25000
Tp 3: 25700
Tp 4 : 26300
SL : 23700
Traders, Don’t forget to like and share your thoughts in the comments! ❤️
Remember this is a position that was found by me and it is a personal idea not a financial advice, you are responsible for your loss and gain.

USDJPY Near Major Resistance – Rising Wedge Signals Reversal1. What Happened Recently
After the gap up above resistance in early October, USDJPY has continued to climb, recently breaking above the 155.00 psychological level.
However, the entire advance of the past weeks is developing inside a rising wedge pattern — a structure that usually signals loss of momentum and often precedes a bearish reversal.
2. Current Market Context
It is also important to note that if USDJPY rises above 156.50, it enters a major resistance zone, historically triggering significant pullbacks.
So while the trend is still technically up, the risk-reward for new longs is deteriorating rapidly.
3. Technical Outlook
Key levels to watch:
- 156.50 → strong resistance; break above it creates a fade-the-rally opportunity
- Rising wedge support → a break below confirms a reversal signal
- 158.00 → invalidation; strong buying above this level cancels the bearish scenario
Downside target:
- 150.00 → main objective for a completed wedge breakdown
4. Trading Plan
I am currently preparing two sell plans:
- Break above 156.50 → fade rallies
If price spikes above this zone but fails to hold, I will look to sell.
- Break of the wedge support → trend reversal setup
A clean breakdown from the wedge would confirm that the uptrend is exhausted, offering another shorting opportunity.
5. Conclusion
Although USDJPY remains in an uptrend for now, the combination of a rising wedge, major resistance at 156.50, and weak bullish momentum makes a reversal increasingly probable.
My target is 150, with invalidation only if strong buying appears above 158.

Could we see a bearish reversal from here?GBP/CHF is reacting off the pivot, which has been identified as a pullback resistance level that aligns with the 61.8% Fibonacci retracement. Price could reverse from here and move back toward the pullback support.
Pivot: 1.0519
1st Support: 1.0456
1st Resistance: 1.0573
Disclaimer:
The opinions given above constitute general market commentary and do not constitute the opinion or advice of IC Markets or any form of personal or investment advice.
Any opinions, news, research, analyses, prices, other information, or links to third-party sites contained on this website are provided on an "as-is" basis, are intended to be informative only, and are not advice, a recommendation, research, a record of our trading prices, an offer of, or solicitation for, a transaction in any financial instrument and thus should not be treated as such. The information provided does not involve any specific investment objectives, financial situation, or needs of any specific person who may receive it. Please be aware that past performance is not a reliable indicator of future performance and/or results. Past performance or forward-looking scenarios based upon the reasonable beliefs of the third-party provider are not a guarantee of future performance. Actual results may differ materially from those anticipated in forward-looking or past performance statements. IC Markets makes no representation or warranty and assumes no liability as to the accuracy or completeness of the information provided, nor any loss arising from any investment based on a recommendation, forecast, or any information supplied by any third party.

Bullish continuation?EUR/JPY is falling towards the pivot and could bounce to the 1st resistance.
Pivot: 179.13
1st Support: 178.71
1st Resistance: 180.73
Disclaimer:
The opinions given above constitute general market commentary and do not constitute the opinion or advice of IC Markets or any form of personal or investment advice.
Any opinions, news, research, analyses, prices, other information, or links to third-party sites contained on this website are provided on an "as-is" basis, are intended to be informative only, and are not advice, a recommendation, research, a record of our trading prices, an offer of, or solicitation for, a transaction in any financial instrument and thus should not be treated as such. The information provided does not involve any specific investment objectives, financial situation, or needs of any specific person who may receive it. Please be aware that past performance is not a reliable indicator of future performance and/or results. Past performance or forward-looking scenarios based upon the reasonable beliefs of the third-party provider are not a guarantee of future performance. Actual results may differ materially from those anticipated in forward-looking or past performance statements. IC Markets makes no representation or warranty and assumes no liability as to the accuracy or completeness of the information provided, nor any loss arising from any investment based on a recommendation, forecast, or any information supplied by any third party.

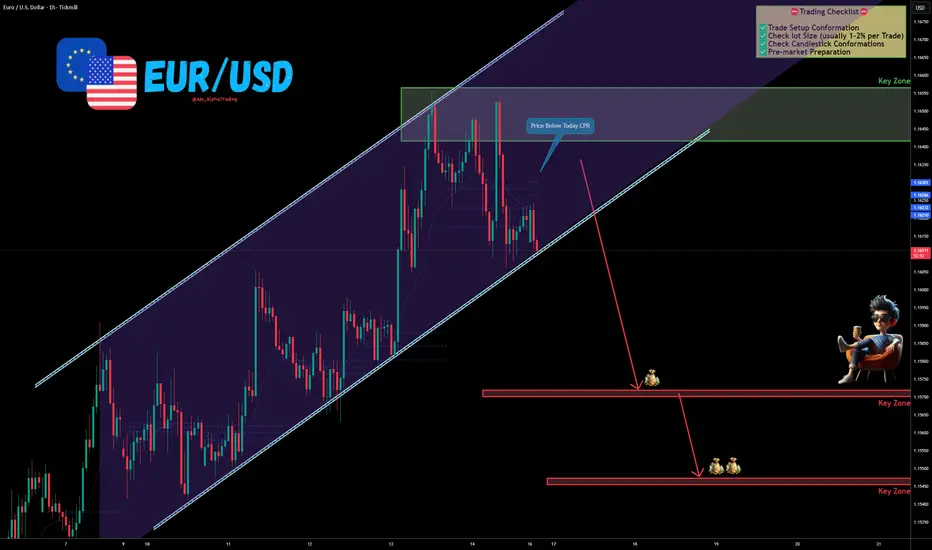
EUR/USD – Channel Breakdown Possibility | CPR Rejection Signals The EUR/USD Pair, Price has been trading within a Channel Pattern on the H1 chart, forming consistent lower highs and lower lows. Price action is now testing the lower boundary of the pattern, signalling a possible breakdown.
✅Market Context:
1️⃣Downward structure building inside the pattern.
2️⃣Sellers are showing strength near support levels.
3️⃣Breakdown below the trendline indicates momentum continuation toward lower zones.
✅Trade Plan:
Entry: Sell after confirmed breakdown below the support (Candle close below trendline or retest of the breakout).
💰Take Profit (TP): At the Key Zone – major support area identified ahead.
🛑Stop Loss (SL): Above the pattern structure / recent swing high.
✅Psychological Discipline:
1️⃣Stick to plan – No Revenge Trades.
2️⃣Accept losing trades as part of the strategy.
3️⃣Risk only 1–2% of your account balance per trade.
✅ Support this analysis with a
LIKE 👍 | COMMENT 💬 | FOLLOW 🔔
It helps a lot & keeps the ideas coming!
⚠️ Disclaimer: This analysis is for educational purposes only and does not constitute financial advice. Forex trading involves high risk. Trade only with capital you can afford to lose and always do your own research.