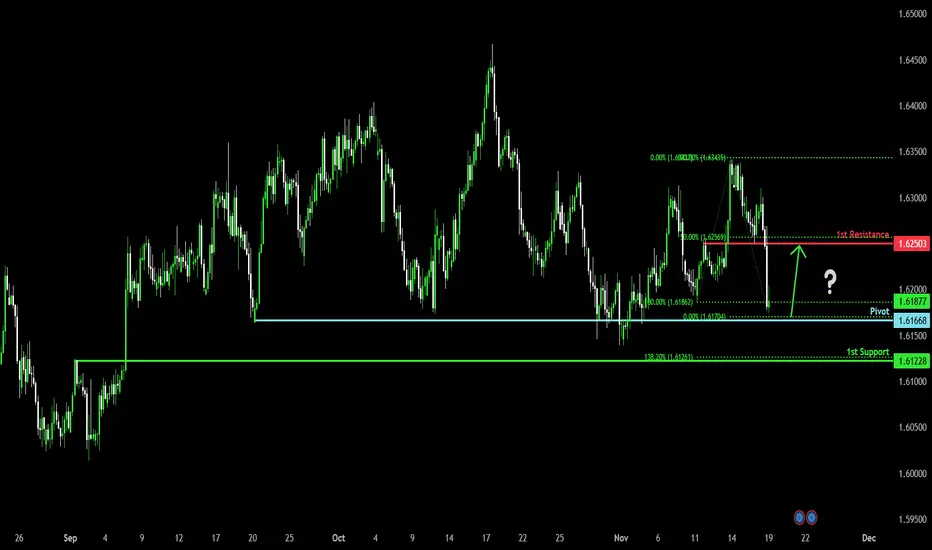
Bullish reversal setup?EUR/CAD is currently reacting off the pivot and could reverse to the 1st resistance.
Pivot: 1.61786
1st Support: 1.61228
1st Resistance: 1.62503
Disclaimer:
The opinions given above constitute general market commentary and do not constitute the opinion or advice of IC Markets or any form of personal or investment advice.
Any opinions, news, research, analyses, prices, other information, or links to third-party sites contained on this website are provided on an "as-is" basis, are intended to be informative only, and are not advice, a recommendation, research, a record of our trading prices, an offer of, or solicitation for, a transaction in any financial instrument and thus should not be treated as such. The information provided does not involve any specific investment objectives, financial situation, or needs of any specific person who may receive it. Please be aware that past performance is not a reliable indicator of future performance and/or results. Past performance or forward-looking scenarios based upon the reasonable beliefs of the third-party provider are not a guarantee of future performance. Actual results may differ materially from those anticipated in forward-looking or past performance statements. IC Markets makes no representation or warranty and assumes no liability as to the accuracy or completeness of the information provided, nor any loss arising from any investment based on a recommendation, forecast, or any information supplied by any third party.
Forexsignals
Bullish momentum to extend?CAD/JPY is falling towards the pivot, which has been identified as a pullback support and could bounce to the 1st resistance, which aligns with the 100% Fibonacci projection.
Pivot: 110.59
1st Resistance: 112.07
1st Support: 109.83
Disclaimer:
The opinions given above constitute general market commentary and do not constitute the opinion or advice of IC Markets or any form of personal or investment advice.
Any opinions, news, research, analyses, prices, other information, or links to third-party sites contained on this website are provided on an "as-is" basis, are intended to be informative only, and are not advice, a recommendation, research, a record of our trading prices, an offer of, or solicitation for, a transaction in any financial instrument and thus should not be treated as such. The information provided does not involve any specific investment objectives, financial situation, or needs of any specific person who may receive it. Please be aware that past performance is not a reliable indicator of future performance and/or results. Past performance or forward-looking scenarios based upon the reasonable beliefs of the third-party provider are not a guarantee of future performance. Actual results may differ materially from those anticipated in forward-looking or past performance statements. IC Markets makes no representation or warranty and assumes no liability as to the accuracy or completeness of the information provided, nor any loss arising from any investment based on a recommendation, forecast, or any information supplied by any third party.

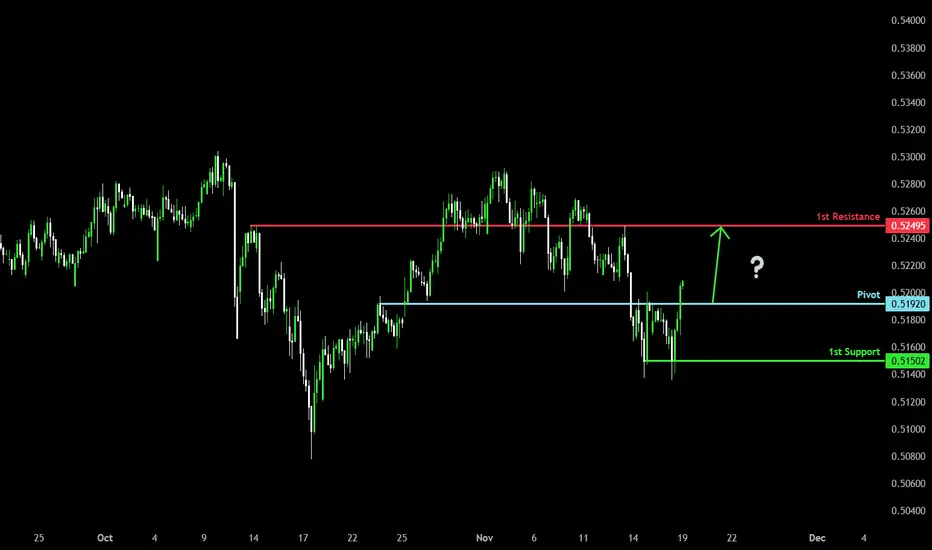
Bullish reversal?AUD/CHF could make a short-term pullback to the pivot, which acts as an overlap support, and could bounce to the 1st resistance.
Pivot: 0.51920
1st Resistance: 0.52495
1st Support: 0.51502
Disclaimer:
The opinions given above constitute general market commentary and do not constitute the opinion or advice of IC Markets or any form of personal or investment advice.
Any opinions, news, research, analyses, prices, other information, or links to third-party sites contained on this website are provided on an "as-is" basis, are intended to be informative only, and are not advice, a recommendation, research, a record of our trading prices, an offer of, or solicitation for, a transaction in any financial instrument and thus should not be treated as such. The information provided does not involve any specific investment objectives, financial situation, or needs of any specific person who may receive it. Please be aware that past performance is not a reliable indicator of future performance and/or results. Past performance or forward-looking scenarios based upon the reasonable beliefs of the third-party provider are not a guarantee of future performance. Actual results may differ materially from those anticipated in forward-looking or past performance statements. IC Markets makes no representation or warranty and assumes no liability as to the accuracy or completeness of the information provided, nor any loss arising from any investment based on a recommendation, forecast, or any information supplied by any third party.
Bullish bounce off key support?NZD/CHF is falling towards the pivot, which has been identified as an overlap support and could bounce to the 1st resistance.
Pivot: 0.45145
1st Support: 0.44964
1st Resistance: 0.45571
Disclaimer:
The opinions given above constitute general market commentary and do not constitute the opinion or advice of IC Markets or any form of personal or investment advice.
Any opinions, news, research, analyses, prices, other information, or links to third-party sites contained on this website are provided on an "as-is" basis, are intended to be informative only, and are not advice, a recommendation, research, a record of our trading prices, an offer of, or solicitation for, a transaction in any financial instrument and thus should not be treated as such. The information provided does not involve any specific investment objectives, financial situation, or needs of any specific person who may receive it. Please be aware that past performance is not a reliable indicator of future performance and/or results. Past performance or forward-looking scenarios based upon the reasonable beliefs of the third-party provider are not a guarantee of future performance. Actual results may differ materially from those anticipated in forward-looking or past performance statements. IC Markets makes no representation or warranty and assumes no liability as to the accuracy or completeness of the information provided, nor any loss arising from any investment based on a recommendation, forecast, or any information supplied by any third party.

USDJPY Vulnerable to Deep Pullback After Wave 5USDJPY has completed a full 5-wave rising structure inside a clear wedge pattern, which usually signals exhaustion. The final Wave (5) shows weakening momentum, and price is beginning to slip below the wedge support — an early sign that the trend may be reversing. This suggests the pair is likely entering a deeper corrective decline, potentially retracing toward 150 or lower in an impulsive A-B-C move. In simple terms: uptrend looks tired → wedge breakdown could trigger a strong downside correction.
Stay tuned!
@Money_Dictators
Thank you :)

GBPUSD Buy Strategy: From Safe Zone to the TopGuys,
I have prepared a GBPUSD analysis for you.
📌 When GBPUSD reaches the 1.31642 - 1.31495 zone, I will open a buy position, aiming for the 1.37937 level as my target.
My friends, I share these analyses thanks to each like I receive from you. I sincerely thank all of you who support me with your appreciation.

USOIL : LIVE TRADEHello friends
Given the price growth, you can see that buyers have repeatedly tried to break the resistance but were unsuccessful and the weakness of the trend is quite clear.
Now we can trade with capital and risk management and account management.
This is not a buy or sell offer.
*Trade safely with us*

BTC Downtrend With Short-Term Rebound TargetBTC is trading in a clear downtrend, breaking below the central level and approaching the support zone. A short-term corrective bounce toward 92,000 is highlighted, but overall structure still shows bearish pressure under major resistance and BOS levels.

EURUSDHello Traders! 👋
What are your thoughts on EURUSD?
EUR/USD has bounced strongly from the identified support zone and has now broken above the descending trendline, holding firmly above it .
In the current area, we expect some short-term consolidation, followed by a continued move higher toward the next resistance levels.
A breakout above 1.166 would act as a key confirmation signal, suggesting continuation of the bullish trend and opening the path toward higher targets.
As long as the price remains above the ascending trendline, the bullish scenario remains valid.
Don’t forget to like and share your thoughts in the comments! ❤️

GBP/USD | Pound Setting Up for a Pullback Move! (READ CAPTION)By analyzing the GBPUSD chart on the 2H timeframe, we can see the price trading around 1.3150. I expect a small move to the upside first, followed by a stronger drop.
Key supply zones are 1.31770, 1.31910–1.32170, and 1.32250–1.32490.
This analysis will be updated soon.
Please support me with your likes and comments to motivate me to share more analysis with you and share your opinion about the possible trend of this chart with me !
Best Regards , Arman Shaban
EURUSD Channel Down has started its new Bearish Leg.The EURUSD pair has been trading within a Channel Down since the October 01 High and price its latest Lower High last Thursday, getting rejected exactly on the 1D MA50 (red trend-line) for the first time in 1 month.
Today it broke below its 4H MA50 (blue trend-line) after 10 days and such break-outs have confirmed both previous Bearish Legs. As a result, we turn bearish again on this pair and since both previous Legs declined by at least -2.03%, we are targeting 1.14200.
As you can see, this can make a perfect technical Lower Low on the 1D MA200 (black trend-line) a major long-term market Support. Another metric to look for, is the 4H RSI, which provides a Buy Signal when it double bottoms below 30.00.
---
** Please LIKE 👍, FOLLOW ✅, SHARE 🙌 and COMMENT ✍ if you enjoy this idea! Also share your ideas and charts in the comments section below! This is best way to keep it relevant, support us, keep the content here free and allow the idea to reach as many people as possible. **
---
💸💸💸💸💸💸
👇 👇 👇 👇 👇 👇

Gold Bearish Continuation Analysis
📉 Gold Market Analysis (45-min Chart)
Your chart shows a full transition from bullish trend → distribution → bearish trend.
Below is the step-by-step breakdown:
1️⃣ Previous Trend: Strong Uptrend
Price was moving inside a rising channel, creating:
Higher highs
Higher lows
Fair Value Gap (FVG) inside the channel
Breakout points showing bullish continuation
This structure remained intact until BOS (Break of Structure).
2️⃣ Break of Structure (BOS) → Trend Reversal
Price broke out of the ascending channel and then broke below structural support → confirming a bearish reversal.
This BOS is the key signal showing buyers losing control.
3️⃣ Current Phase: Range Consolidation
After BOS, price entered a range between:
Upper range: ~4,100
Lower range: ~4,020
This type of consolidation usually appears before another strong move.
Because BOS is bearish, the expected continuation is downward.
4️⃣ Liquidity Objective: 4,012 Target
Your chart marks TARGET 4012, and it aligns with:
Liquidity grab zone
Previous reaction area
Lower range boundary
Beginning of the order block
This makes 4,012 a high-probability bearish target.
5️⃣ Order Block Confirmation
Below the chart, there is a large order block zone (3,927–3,947).
If 4,012 is broken with momentum, price may later gravitate toward this deeper zone.
But for now, the nearest confirmed target is:
👉 4,012
6️⃣ Expected Movement (Short-term)
Price is currently retesting the breakdown area (small pullback).
From here, the expected path is:
Pullback → Rejection → Drop toward 4,012
(Bearish continuation)
---
📉 Summary
Trend shifted from bullish to bearish after BOS.
Price is inside a bearish range.
Momentum favors a continuation downward.
Short-term target: 4,012
Major support/order block below: 3,927–3,947
If you want this analysis in another language or want me to write a full signal, let me know!

CADJPY: Buyers' Dominance 🇨🇦🇯🇵
I think that CADJPY will update the high soon.
The market completed a correctional movement,
after setting a new higher high higher close with a break of structure.
A strong buying imbalance on a 4H time frame suggests a highly
probably rise.
Expect a movement up to 111.0 level.
❤️Please, support my work with like, thank you!❤️
I am part of Trade Nation's Influencer program and receive a monthly fee for using their TradingView charts in my analysis.

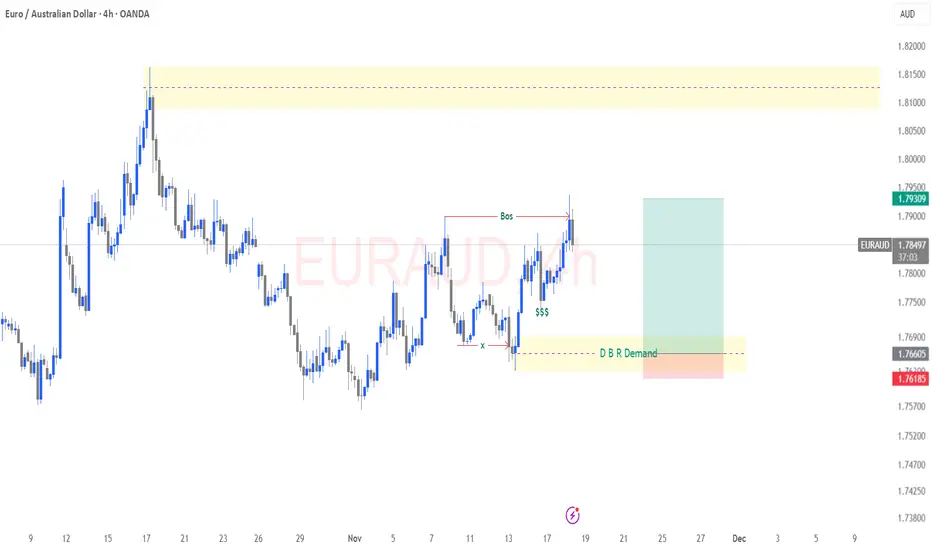
EURAUD – Bullish Continuation Setup BOS + Liquidity Sweep + DBRPrice has printed a clear Break of Structure (BOS) to the upside, establishing bullish order flow on the 4H timeframe. After the BOS, the market rotated lower to sweep internal liquidity (SSS) and tag the last down-close candle the DBR Demand that sponsored the bullish impulse.
This demand zone remains unmitigated and sits neatly in discounted pricing. The expectation is that price may revisit this zone before launching the next bullish leg.
If the zone holds, the next expansion phase should target the higher-timeframe premium zone above, where the prior rally originated. This forms a clean asymmetric scenario: discounted entries below, premium exits above.
What matters operationally is confirmation within demand lower-timeframe BOS or displacement signalling that buyers are re-entering the flow. Once that triggers, the bullish continuation aligns perfectly with current structure.
A disciplined demand-play backed by BOS, liquidity, and clean imbalance.
AUDUSDAUDUSD price is currently approaching the support zone at 0.64866-0.64670$. If the price cannot break above 0.64670$, it is expected that the price will have a chance to rebound. Consider buying in the red zone.
🔥Trading futures, forex, CFDs and stocks carries a risk of loss.
Please consider carefully whether such trading is suitable for you.
>>GooD Luck 😊
❤️ Like and subscribe to never miss a new idea!

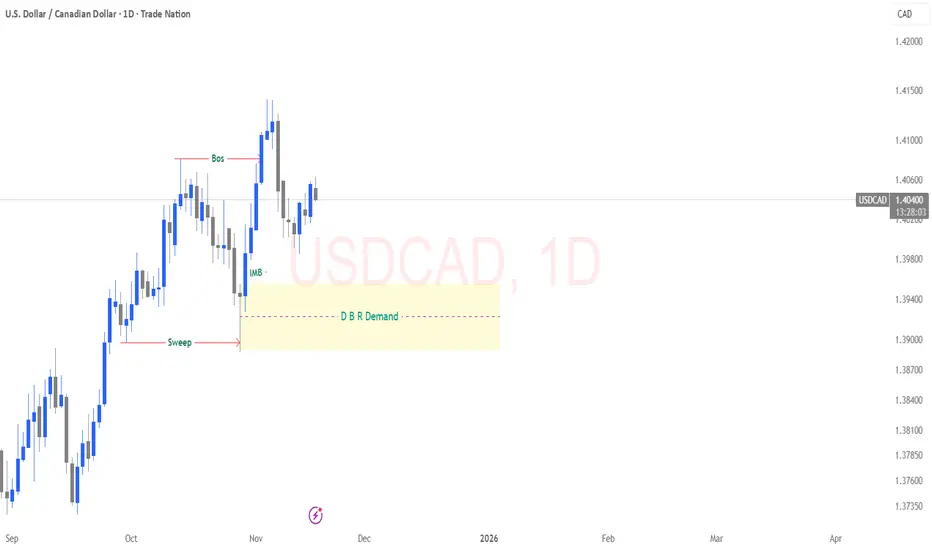
USDCAD – Clean Daily Buy Scenario Price has already established a bullish Break of Structure (BOS), confirming upside order flow on the daily timeframe. After that BOS, the market dipped back down to sweep the previous low, clearing out sell-side liquidity and creating the fuel required for a bullish continuation.
From there, price impulsively rallied, leaving behind a clear imbalance (IMB) and an unmitigated Daily DBR Demand zone the origin of the bullish displacement.
As price pulls back, the expectation is for a corrective move into this DBR demand. This zone represents discounted pricing aligned with the dominant trend and offers high-probability buy setups once lower-timeframe confirmations show up (reaction, BOS, or displacement).
If this demand holds, the next bullish leg should target the highs created above the imbalance, continuing the overall upward structure.
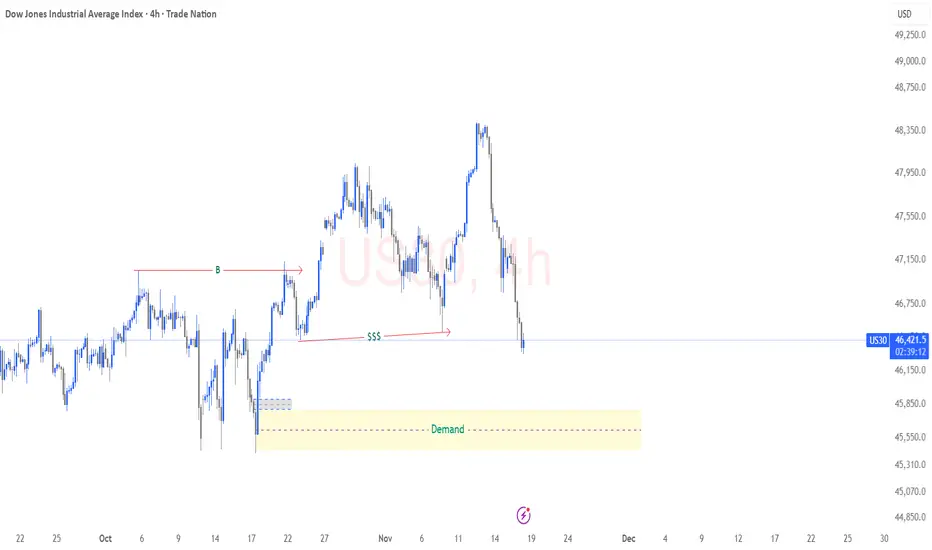
US30 – Potential Buy Setup into Higher-Timeframe Demand 4HPrice has already printed a Break of Structure (BOS), confirming bullish order flow on the 4H timeframe. The current sell-off is corrective, not a trend reversal. As price retraces, it sweeps internal liquidity (SSS) and taps into a strong 4H demand zone – the same zone that caused the BOS.
This area offers discounted pricing for a potential continuation of the bullish move. If lower-timeframe confirmations appear inside the demand zone, we can expect price to rotate upward and target the imbalance and highs left above.
A value-driven buy: wait for confirmation, then aim for bullish continuation in line with the structural bias.
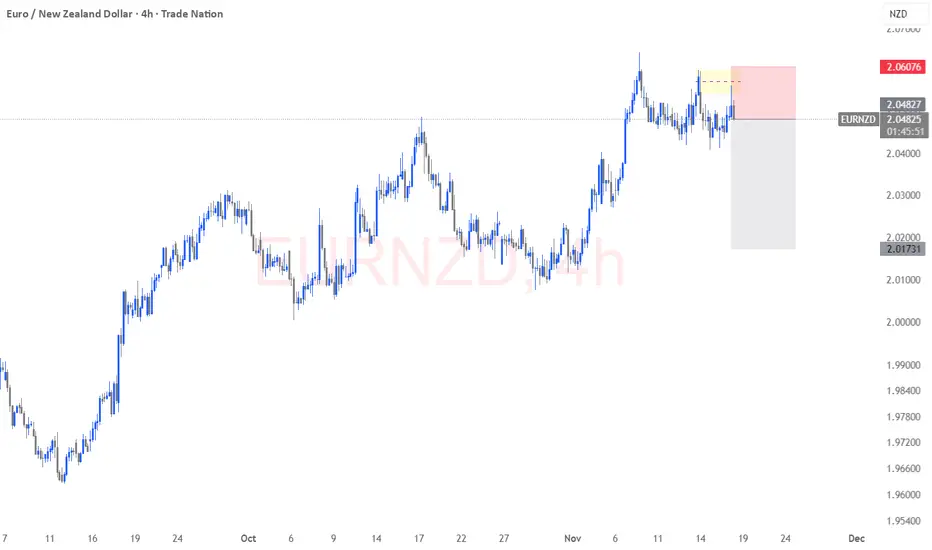
EUR/NZD – Short Position Breakdown (4H Context)The market is signalling a potential downside rotation after tapping into a premium pricing zone. Price has reacted inside a clear rejection block sitting at the upper boundary of the recent rally, showing early signs of supply taking control.
From an execution standpoint, this region represents an attractive shorting opportunity as liquidity has likely been engineered above the prior high. Once that sweep was completed, we saw price struggle to maintain bullish momentum an early indicator of possible distribution.
The current short position is aligned with a corrective move back into discounted territory. If momentum holds, structure suggests a continuation towards the previous 4H demand area, where we expect buyers to potentially step back in. Risk parameters remain intact above the engineered high, ensuring optimal downside exposure while maintaining disciplined capital protection.
This setup reflects a textbook scenario of waiting for price to enter a premium zone before taking action—maximising reward efficiency while protecting the downside.
USDCAD: Bullish Bias Remains 🇺🇸🇨🇦
USDCAD will likely grow more,
following a test and a strong pullback from the underlined
daily support cluster.
Expect a rise at least to 1.4089
❤️Please, support my work with like, thank you!❤️
I am part of Trade Nation's Influencer program and receive a monthly fee for using their TradingView charts in my analysis.

eurnzd buy signal. Don't forget about stop-loss.
Write in the comments all your questions and instruments analysis of which you want to see.
Friends, push the like button, write a comment, and share with your mates - that would be the best THANK YOU.
P.S. I personally will open entry if the price will show it according to my strategy.
Always make your analysis before a trade

EUR/USD Targets 1.16300 After Trendline Rejection“EUR/USD trend is respecting the ascending support line with BOS confirmations. Price is expected to retest the trendline and push upward toward the 1.16300 target zone.”
If you want a title also, just tell me!

Bullish bounce off 38.2% Fibonacci support?USD/JPY is falling towards the pivot, which has been identified as a pullback support that aligns with the 38.2% Fibonacci retracement and could bounce to the 1st resistance.
Pivot: 154.73
1st Support: 154.36
1st Resistance: 155.27
Disclaimer:
The opinions given above constitute general market commentary and do not constitute the opinion or advice of IC Markets or any form of personal or investment advice.
Any opinions, news, research, analyses, prices, other information, or links to third-party sites contained on this website are provided on an "as-is" basis, are intended to be informative only, and are not advice, a recommendation, research, a record of our trading prices, an offer of, or solicitation for, a transaction in any financial instrument and thus should not be treated as such. The information provided does not involve any specific investment objectives, financial situation, or needs of any specific person who may receive it. Please be aware that past performance is not a reliable indicator of future performance and/or results. Past performance or forward-looking scenarios based upon the reasonable beliefs of the third-party provider are not a guarantee of future performance. Actual results may differ materially from those anticipated in forward-looking or past performance statements. IC Markets makes no representation or warranty and assumes no liability as to the accuracy or completeness of the information provided, nor any loss arising from any investment based on a recommendation, forecast, or any information supplied by any third party.

Could the bearish momentum continue?Swissie (USD/CHF) has rejected off the pivot and could drop to the 1st support, which acts as a pullback support.
Pivot: 0.7965
1st Support: 0.7924
1st Resistance: 0.7992
Disclaimer:
The opinions given above constitute general market commentary and do not constitute the opinion or advice of IC Markets or any form of personal or investment advice.
Any opinions, news, research, analyses, prices, other information, or links to third-party sites contained on this website are provided on an "as-is" basis, are intended to be informative only, and are not advice, a recommendation, research, a record of our trading prices, an offer of, or solicitation for, a transaction in any financial instrument and thus should not be treated as such. The information provided does not involve any specific investment objectives, financial situation, or needs of any specific person who may receive it. Please be aware that past performance is not a reliable indicator of future performance and/or results. Past performance or forward-looking scenarios based upon the reasonable beliefs of the third-party provider are not a guarantee of future performance. Actual results may differ materially from those anticipated in forward-looking or past performance statements. IC Markets makes no representation or warranty and assumes no liability as to the accuracy or completeness of the information provided, nor any loss arising from any investment based on a recommendation, forecast, or any information supplied by any third party.
