Best Ways of Trading1. Trade with a Clear Strategy (Not Emotion or Guesswork)
One of the biggest mistakes new traders make is trading without a defined plan. The best way to trade is to follow a tested strategy. Some proven trading styles include:
a) Trend Trading
This approach involves identifying the overall market direction and trading in line with it. Trend traders use tools like moving averages (20, 50, 200), MACD, or trendlines to determine direction. The idea is simple:
“Trade with the trend until it ends.”
b) Swing Trading
Swing trading works best for people who cannot monitor markets all day. This approach aims to catch reversals or continuation moves over days to weeks. Traders look for key support/resistance, breakouts, and candlestick patterns.
c) Intraday Trading
Intraday traders look for small, high-probability moves within a single session. The best intraday setups come from volume spikes, VWAP, breakout zones, and strong trend days.
d) Momentum Trading
Momentum traders focus on stocks or instruments that show strong volume and price acceleration. When markets move rapidly in one direction, momentum traders ride the wave.
e) Options Trading
Options allow traders to profit using leverage and hedge positions. Buying calls and puts, selling options for premium, or using spreads can significantly enhance risk-reward profiles.
f) Algorithmic or Systematic Trading
A growing method that uses rules, automation, or AI-driven models. This reduces emotions and increases consistency.
The best traders select one main strategy and master it, rather than attempting everything.
2. Follow Multi-Time-Frame Analysis
Always confirm trades using multiple time frames. For example:
Long-term trend – weekly chart
Medium trend – daily chart
Entry timing – 15-minute or 5-minute chart
This prevents taking trades against the broader market direction. When all time frames align, the probability of success increases dramatically.
3. Master Risk Management (The Heart of Successful Trading)
Even the best strategy fails without proper risk control. The strongest traders treat risk management as the core of their system.
a) Risk per Trade
Smart traders risk 1–2% of their capital on any single trade. This helps avoid catastrophic losses.
b) Stop-Loss Use
Always define where the trade is wrong and set a stop-loss accordingly. A systematic stop-loss protects capital and preserves longevity.
c) Position Sizing
Your position size should be based on your risk per trade and stop-loss distance, not on emotions or random judgment.
d) Risk-to-Reward Ratio (RRR)
Successful traders aim for at least 1:2 or 1:3 RRR.
This means:
If you risk ₹1, you target ₹2 or ₹3.
e) Avoid Overtrading
One of the most common reasons traders lose money is taking too many trades. Quality beats quantity.
Risk management is the backbone of consistent long-term profitability.
4. Use Technical and Fundamental Analysis Together
The best trading approach usually combines elements of both.
Technical Analysis helps with:
Timing entry and exit
Understanding trend structure
Recognizing chart patterns
Interpreting market psychology
Key indicators include RSI, MACD, Bollinger Bands, moving averages, and volume-based tools.
Fundamental Analysis helps with:
Identifying long-term direction
Understanding earnings, interest rates, inflation
Recognizing geopolitical and macroeconomic risks
Selecting strong long-term stocks or commodities
A trader who understands both sides sees the market differently and more accurately.
5. Develop Strong Trading Psychology
The market is a psychological battlefield. The best traders keep emotions under control. Some core psychological frameworks include:
a) Discipline and Patience
Only take setups that match your strategy. Good traders wait for the right moment.
b) Emotion Control
Fear and greed destroy accounts. The best way to avoid emotional decisions is to follow a rule-based system.
c) Accepting Losses
Even top traders lose 40–50% of trades. Losses are part of the game. The goal is to keep them small.
d) Avoiding the “Revenge Trade” Trap
Never attempt to win back losses instantly. This leads to impulsive decisions and bigger losses.
Mastering psychology is as important as mastering charts.
6. Backtest and Forward-Test Your Strategy
Before risking real money, test your strategy historically (backtesting). Check:
Win rate
Average gain vs average loss
Maximum drawdown
Consistency during different market conditions
Follow this with paper trading to see real-time behavior. A strategy that performs well in backtests and paper trading has higher chances of success in real markets.
7. Use Technology to Your Advantage
Modern trading has advanced tools:
Algorithmic screeners
Charting platforms
AI-driven market sentiment analysis
Automated alerts
Portfolio trackers
Order execution bots
Technology increases efficiency and reduces human error.
8. Follow Market Cycles and Global Trends
Markets move in cycles: accumulation, uptrend, distribution, correction.
Understanding economic cycles, liquidity conditions, central bank policy, and geopolitical events helps you choose the right instruments and strategies.
For example:
High inflation phase → commodities tend to outperform
Low interest rates → equities rally
Geopolitical tensions → gold, USD strengthen
Trading in sync with macro trends improves accuracy.
9. Diversify Your Trading Portfolio
Do not rely on one asset or one market. Trade multiple instruments (equities, commodities, indices, currencies) to reduce risk. A diversified portfolio smoothens performance and reduces emotional pressure.
10. Keep a Trading Journal
A trading journal is one of the most effective tools for improvement. Record:
Entry & exit levels
Strategy used
Reason for trade
Emotions felt
Result and analysis
Review your journal weekly. It reveals patterns in your behavior, helping you correct mistakes and become a more consistent trader.
Conclusion: What Is the Best Way of Trading?
There is no one “best way,” but the best traders combine:
A clear, tested strategy
Multi-time-frame confirmation
Strong risk management
Mastered psychology
Smart use of technology
Discipline in execution
Trading is not about predicting the future; it's about managing risk, following a system, and staying emotionally stable. If you approach it scientifically and patiently, you can achieve long-term success in any market.
Forextargets
Economic Future at Risk in the Trading Market1. Heightened Market Volatility and Unpredictability
Market volatility is not new, but its frequency, magnitude, and drivers have changed. Previously, volatility was largely triggered by economic data or company earnings. Today, geopolitical shocks, pandemic-like events, cyber-attacks, and supply chain breakdowns trigger sudden movements across global markets.
High-frequency trading algorithms and automated systems amplify these movements. A minor headline can trigger billions of dollars in buying or selling within seconds, resulting in flash crashes or sharp intraday swings. This makes the trading environment more dangerous for retail traders and institutions, raising the probability of mispricing, liquidity traps, and cascading sell-offs.
2. Central Bank Tightening and the Threat of Economic Slowdown
The last decade was marked by cheap money—near-zero interest rates and quantitative easing. But inflationary pressures following the pandemic, supply chain shortages, and geopolitical tensions forced central banks (like the U.S. Federal Reserve, ECB, and RBI) to raise interest rates aggressively.
Higher interest rates bring several risks:
Reduced liquidity in equity and bond markets
Corporate borrowing costs rise, leading to lower earnings
Emerging markets face currency pressure as capital flows back to the U.S.
Real estate and financial assets lose valuation
Higher chance of recession
In a high-rate environment, every asset class—stocks, crypto, gold, bonds, real estate—faces pricing uncertainty. Traders must adapt to a world where liquidity is shrinking and capital is more expensive.
3. Geopolitical Instability Rewriting Global Trade
The global economy is undergoing a major geopolitical realignment:
The U.S.–China rivalry is disrupting technology supply chains.
Conflicts in Europe, Middle East, and Asia threaten fuel and food supplies.
Countries are prioritizing economic nationalism, reshoring factories and reducing trade dependencies.
These shifts raise costs for companies and slow down global economic growth. Markets react violently to geopolitical shocks—especially commodity markets like oil, gas, wheat, and rare earth metals. For traders, this means higher uncertainty, sudden price gaps, and the constant threat of new sanctions or regulations.
4. Currency Instability and the Fight for Dominance
Global currency markets face major instability:
The U.S. dollar is strong, creating pressure on emerging market currencies.
Multiple countries are exploring de-dollarization, challenging the global currency order.
Large nations are increasing their reserves of gold, signaling declining trust in fiat systems.
Cryptocurrencies continue rising but remain highly volatile.
When currencies fluctuate rapidly, it affects trade balances, government debt, import/export costs, and corporate earnings. Multinational companies face higher hedging costs. Investors face exchange-rate risks. For developing economies, the risk of capital flight increases, putting their economic future at risk.
5. Debt Crisis Looming Over Countries and Corporations
Global debt—government, household, and corporate—has reached historically extreme levels. Many countries borrowed heavily during the pandemic to support their economies. Now, with higher interest rates, repayment burdens are rising.
Countries at risk include:
Highly indebted developed nations
Emerging markets dependent on foreign loans
Economies struggling with weak exports or falling currency reserves
A debt default or liquidity crisis in one major economy could trigger global contagion, as seen in the 2008 financial crisis. Corporate debt is another danger—many companies now face refinancing at significantly higher interest rates, which could push weaker firms toward bankruptcy.
6. Technology Disruption, Cyber Risks, and AI-Driven Trading
Technology has always shaped finance, but today’s disruption is unprecedented:
AI-driven trading
Algorithms dominate global trading volumes, making markets move faster and sometimes more irrationally. Errors, bugs, or miscalculations in algorithms can cause massive volatility.
Cyber-attack risks
Financial markets are prime targets for cyber warfare. A major breach on a stock exchange, bank, or clearinghouse could disrupt global markets instantly.
Blockchain instability
Crypto markets add another layer of uncertainty, with regulatory crackdowns, exchange failures, and price manipulation affecting investor confidence.
While technology brings efficiency, it also introduces systemic fragility, where one failure can ripple across markets.
7. Commodity Shock Risks: Energy, Metals, and Food
Commodity markets are extremely sensitive to global shocks:
Oil and gas supply disruptions raise costs worldwide.
Climate change affects crop yields, increasing food prices.
Rare earth and metal shortages disrupt technology and electric vehicle industries.
When commodities spike, inflation rises. When they crash, exporting nations suffer revenue losses. Both extremes create economic instability, affecting stock markets, currency markets, and global trade.
8. Climate Change and the Cost of Environmental Disasters
Climate risks are now financial risks. Extreme weather events—floods, droughts, heatwaves, storms—directly impact national economies and trading markets:
Agricultural output drops
Insurance costs surge
Supply chains break
Infrastructure is damaged
Energy demands rise
Climate-related losses already cost trillions globally. As environmental disasters increase, financial assets that depend on stability become more vulnerable.
9. Social and Political Instability Threatening Economic Confidence
Economic inequality, unemployment, and inflation often lead to social tensions. Political unrest can weaken investor confidence, reduce foreign investment, and derail economic growth. Countries facing internal instability often see:
Capital outflows
Currency depreciation
Stock market decline
Increased borrowing costs
Such scenarios make long-term planning difficult for traders and investors.
10. Psychological and Behavioral Risks in Trading
Human behavior plays a crucial role in market dynamics. The modern era has amplified emotional trading:
Social media influences market sentiment
FOMO-driven trading causes bubbles
Panic selling creates flash crashes
Retail traders follow trends without risk management
This irrational behavior increases systemic vulnerability. When millions follow the same emotional trend, markets lose stability.
Conclusion: Navigating a Future Filled With Risk
The economic future is undeniably at risk due to converging forces: geopolitical conflict, technology disruption, debt burdens, climate change, currency instability, and behavioral volatility. The trading market reflects these tensions in the form of rapid price swings, liquidity shocks, and unpredictable cycles.
However, risks also create opportunities. Traders and investors who focus on diversification, risk management, macro insights, and disciplined strategy can thrive even in turbulent times. The key is understanding that the future will not resemble the stability of previous decades. Instead, success depends on adapting to a world defined by uncertainty, speed, and global interconnectedness.
Competitive Currency Wars1. What Are Competitive Currency Wars?
A currency war begins when one country deliberately devalues its currency to make its exports cheaper and imports more expensive. This leads to:
Higher export competitiveness
Increased domestic production
Potential rise in GDP
Shift of trade deficits toward trade surpluses
However, once one major trading nation devalues its currency, others often follow suit to protect their trade position. This spiral of competitive devaluations becomes a “race to the bottom”, destabilizing capital flows and weakening global financial stability.
Currency wars are rarely declared openly. They typically unfold through monetary policy, interest rate cuts, quantitative easing, or direct market intervention.
2. Why Countries Engage in Currency Wars
A. To Boost Exports
A weak currency makes domestic products cheaper for foreign buyers. Export-driven economies—like Japan, China, and South Korea—often use currency policy to support global sales.
B. To Reduce Trade Deficits
Countries facing large trade deficits (like the U.S. historically) often accuse trading partners of manipulating exchange rates.
C. To Encourage Domestic Industrial Growth
Lower currency value attracts manufacturing demand, protects domestic industries, and supports job creation.
D. To Stimulate Inflation
If an economy is facing deflation (falling prices), a weaker currency increases import prices, pushing inflation into the system.
E. To Manage Debt Burden
A weaker currency reduces the real value of domestic debt, making repayment easier.
3. Key Tools Used in Currency Wars
Countries deploy several policy mechanisms to weaken or control exchange rates:
1. Monetary Policy (Interest Rates)
Lower interest rates reduce returns on investments in that currency, leading to capital outflow and depreciation. Central banks often use rate cuts to support domestic credit growth and weaken currency value.
2. Quantitative Easing (QE)
Central banks inject liquidity by buying government and corporate bonds. More money in circulation generally lowers currency value.
The U.S. Federal Reserve used QE heavily after the 2008 crisis.
Japan’s “Abenomics” relied on aggressive QE to weaken the yen.
3. Direct Currency Market Intervention
Central banks buy or sell foreign currency reserves to influence the local exchange rate.
Example: The People’s Bank of China has historically bought dollars to keep the yuan weaker.
4. Capital Controls
Governments may restrict money inflows or outflows to protect their currency from appreciation or depreciation.
5. Trade Tariffs and Economic Policies
Though not direct currency tools, such measures often accompany or provoke currency wars.
4. Historical Examples of Currency Wars
A. The Great Depression (1930s)
Countries abandoned the gold standard and devalued their currencies to gain export advantages. This period is often called the first modern currency war.
B. The Asian Financial Crisis (1997–98)
Thailand, Indonesia, and South Korea saw massive currency depreciations. Competitive moves followed as neighboring economies attempted to maintain trade competitiveness.
C. The U.S. vs China (2000s–2010s)
China was accused of keeping the yuan artificially low to boost exports. Tensions peaked around 2010–2015, intensifying global currency debates.
D. Post-2008 Global Financial Crisis
Massive global QE programs triggered competitive devaluations:
U.S. dollar weakened due to QE
Japan pushed yen down via Abenomics
Emerging markets reacted to defend their own currencies
This period is considered a modern example of global currency war dynamics.
5. How Currency Wars Affect the Global Economy
Competitive currency wars may offer short-term growth benefits to some nations, but they carry significant risks. Their impacts spread across:
A. Trade Balances
A weaker currency increases exports and reduces imports, but if multiple countries devalue simultaneously, the net effect becomes negligible. This leads to global trade instability.
B. Global Investment Flows
Currency uncertainty discourages foreign investment. Investors prefer stable currencies and predictable returns; currency wars increase volatility.
C. Inflation and Purchasing Power
Devalued currency raises import prices, leading to inflation. While mild inflation can stimulate growth, uncontrolled inflation reduces public purchasing power.
D. Commodity Prices
Commodities like oil, gold, and metals are dollar-denominated. If major currencies weaken:
Commodity prices rise in local currency
Import-dependent nations face higher costs
E. Stock Markets and Bonds
Currency weakening often boosts domestic stock markets as export-driven companies benefit. However, government bond markets may suffer due to capital outflows.
F. Geopolitical Tensions
Accusations of currency manipulation can escalate into:
Trade wars
Tariff battles
Diplomatic standoffs
For example, U.S.–China tensions over exchange rates influenced global trade policy for years.
6. Benefits of Currency Wars (Short-Term)
1. Export Boost
Helps domestic manufacturers stay competitive.
2. Economic Growth
Weaker currency can ignite growth during stagnation.
3. Job Creation
Export-dependent industries grow employment.
4. Debt Management
Real debt burden reduces with depreciation.
7. Risks and Long-Term Costs of Currency Wars
1. Global Instability
Currency wars destabilize global financial markets.
2. Retaliatory Devaluations
One country's move triggers others, amplifying volatility.
3. Imported Inflation
Higher prices for imported goods hurt consumers.
4. Financial Market Distortions
Capital flight, volatile stock markets, unstable bond yields.
5. Loss of Investor Confidence
If investors expect sustained devaluation, they withdraw capital.
6. Trade Conflicts
Countries may impose tariffs or sanctions, damaging global trade.
8. Are We in a Currency War Today?
In recent years, global economic conditions—such as rising U.S. interest rates, geopolitical tensions, inflation cycles, and post-pandemic stimulus—have created conditions resembling a currency war environment. Central banks are aggressively adjusting policies, and exchange-rate competition is visible among major economies like the U.S., China, Japan, and Europe.
9. Conclusion
Competitive currency wars represent a complex interplay of economics, politics, and global finance. While currency devaluation can offer short-term advantages such as export growth and inflation management, the long-term consequences often outweigh the benefits. Currency wars can ignite international tensions, distort global markets, and create instability for investors, consumers, and policymakers alike.
In a deeply interconnected world, sustainable economic growth depends more on cooperation than competitive devaluations. Countries must balance domestic priorities with global responsibilities, as excessive currency competition can ultimately harm all players in the global economic system.

US Dollar Index (DXY) Movements1. What the DXY Represents
The US Dollar Index was introduced in 1973 after the collapse of the Bretton Woods system. It represents a geometric weighted average of the USD compared with six major currencies:
Euro (EUR) – 57.6%
Japanese Yen (JPY) – 13.6%
British Pound (GBP) – 11.9%
Canadian Dollar (CAD) – 9.1%
Swedish Krona (SEK) – 4.2%
Swiss Franc (CHF) – 3.6%
Since the euro replaced multiple European currencies, its weight became dominant. Because of this, the DXY is heavily influenced by USD/EUR movements.
A rising DXY indicates a stronger dollar relative to the basket; a falling DXY shows a weakening dollar.
2. Why DXY Movements Matter
DXY movements are crucial because the USD is the world’s leading reserve currency. Approximately:
60%+ of global forex reserves are held in USD
40%+ of global trade invoicing uses USD
Most commodities—oil, gold, metals—are priced in USD
Therefore, changes in the DXY have wide-reaching consequences:
Influence commodity prices
Affect emerging market currencies
Impact global liquidity
Alter trade competitiveness
Drive foreign investment flows
Because of its influence, DXY is often considered a barometer of global risk sentiment.
3. Key Drivers of DXY Movements
A. Federal Reserve Interest Rate Policy
The most important driver of DXY is US interest rates, controlled by the Federal Reserve.
Higher US interest rates → attract foreign investment → stronger USD → DXY rises
Lower US interest rates → reduce yield advantage → weaker USD → DXY falls
Why? Because investors chase higher returns on US Treasury bonds, leading to greater demand for USD.
B. Economic Data
Key US economic indicators influence the dollar’s strength:
Non-Farm Payrolls (NFP)
Inflation (CPI, PCE)
GDP growth
Unemployment rate
Retail sales
Strong data makes the USD more attractive; weak data pressures the dollar.
C. Risk Sentiment (Risk-On vs. Risk-Off)
During risk-off times (geopolitical tensions, crises), global investors rush to the safety of the USD → DXY rises.
During risk-on periods (market optimism), investors move to risk assets → DXY weakens.
The USD acts as a safe-haven currency.
D. Global Monetary Policy Divergence
DXY rises when:
The Federal Reserve is more hawkish than the ECB, BOJ, or BOE.
US yields are significantly higher than global peers.
DXY falls when:
Other central banks become more hawkish than the Fed.
Interest rate differentials shrink.
E. Commodity Prices
Because commodities are priced in USD:
Higher commodity prices may weaken USD as import costs rise.
Lower commodity prices can strengthen USD.
Oil has a particularly strong relationship.
F. Geopolitical Events
Events that influence DXY include:
Trade wars (especially US-China)
Middle East conflicts
Elections in major economies
Sanctions and global instability
Uncertainty boosts USD demand.
4. How to Interpret DXY Movements
A. DXY Bullish Trends
When the index is rising, it signals:
Increased confidence in the US economy
Higher US interest rates or expectations of hikes
Flight to safety during global instability
Stronger demand for US assets (Treasuries, equities)
A strong dollar typically leads to:
Lower commodity prices (gold, oil)
Pressure on emerging markets
Weaker currencies in developing nations
B. DXY Bearish Trends
A falling DXY suggests:
Fed is expected to cut rates
Weakening US economic indicators
Rising confidence in global markets (risk-on)
Strong performance of the euro or other major currencies
A weak dollar results in:
Higher commodity prices
Support for emerging market currencies
More competitive US exports
5. Impact of DXY on Global Markets
A. Commodities
Because commodities trade in USD:
When DXY rises → commodities fall
(Because they become more expensive in other currencies)
When DXY falls → commodities rise
Gold has a particularly strong inverse relationship with DXY.
B. Forex Markets
The DXY affects forex pairs:
EUR/USD – inverse relationship
USD/JPY, USD/CHF, USD/CAD – generally move with DXY direction
Traders often use DXY for confirmation of forex signals.
C. Equity Markets
A strong USD:
Hurts US multinational corporations (expensive exports)
Strengthens economies that import US goods cheaply
A weak USD:
Boosts US stock earnings (foreign revenues worth more in USD)
Supports global liquidity flows
D. Emerging Markets
EM countries with USD-denominated debt are directly affected:
Strong DXY → EM currencies fall → debt servicing becomes expensive
Weak DXY → EM markets recover
Countries like India, Brazil, Turkey, and South Africa watch DXY closely.
6. DXY in Trading and Technical Analysis
Traders use the index for:
Trend confirmation
Anticipating commodity or forex moves
Identifying global risk sentiment shifts
Common technical indicators applied to DXY:
Moving averages (50-day, 200-day)
RSI (overbought/oversold signals)
MACD (trend momentum changes)
Fibonacci retracements (medium-term corrections)
Support/resistance zones
A break above long-term resistance is often seen as a sign of USD strength globally.
7. Limitations of the DXY
Even though DXY is widely used, it has limitations:
Overweight Euro – 57.6% makes it euro-centric
Ignores key trading partners like China, Mexico, India
Outdated composition (last changed in 1999)
For broader USD strength measurement, many analysts prefer the Trade-Weighted US Dollar Index by the Federal Reserve.
8. Long-Term DXY Patterns
Historically, DXY has gone through cycles:
1980s: Extremely strong USD due to high interest rates
1990s: Moderate decline during globalization
2000s: Major weakness post-dot-com crash
2008-2020: Dollar strengthened again due to safe-haven flows
2020-2022: Pandemic uncertainty pushed DXY higher
2023 onward: Movements linked to inflation battles and Fed policy shifts
DXY cycles often correlate with US economic performance and global uncertainties.
Conclusion
The US Dollar Index (DXY) is a vital measure of the USD’s global strength. Its movements reflect underlying economic conditions, central bank policies, geopolitical events, and investor sentiment. A rising DXY usually signals risk aversion, stronger US yields, and weakness in commodity and emerging markets. A falling DXY often supports global liquidity, raises commodity prices, and weakens the dollar’s dominance temporarily.
Understanding DXY movements helps traders, investors, and analysts interpret global market dynamics, anticipate forex trends, and position themselves effectively in equities, commodities, and bonds.
Forward and Future Forex Trading1. Understanding Forex Derivatives
A derivative is a financial contract whose value is derived from the performance of an underlying asset—in this case, a currency pair. In forex trading, derivatives such as forwards, futures, options, and swaps are used to hedge currency risks or to speculate on currency price movements. The purpose is to manage exchange rate volatility that can impact trade, investment returns, or the cost of imported and exported goods.
2. What is a Forward Forex Contract?
A forward contract in forex is a customized agreement between two parties to exchange a specific amount of one currency for another at a predetermined rate (known as the forward rate) on a specified future date.
For example, suppose an Indian importer expects to pay $1 million to a U.S. supplier in three months. If the current USD/INR rate is ₹83, and the importer fears that the rupee may depreciate to ₹85, they can enter into a forward contract with a bank to buy $1 million at ₹83.50 after three months. Regardless of the market rate at that time, the importer will pay ₹83.50 per dollar, thus avoiding potential losses from exchange rate volatility.
Key Characteristics of Forward Contracts:
Customization: The contract size, maturity date, and exchange rate are negotiated between the buyer and seller.
No Exchange Trading: Forwards are traded over-the-counter (OTC), typically between banks, corporations, or financial institutions.
Settlement: The exchange of currencies occurs on the agreed future date.
No Initial Margin: Usually, no upfront margin is required; settlement happens only at maturity.
3. What is a Forex Futures Contract?
A forex futures contract is a standardized agreement to buy or sell a specific amount of currency at a future date and a predetermined rate. Unlike forwards, futures are traded on regulated exchanges such as the Chicago Mercantile Exchange (CME) or Intercontinental Exchange (ICE).
For instance, a trader may buy a Euro FX Futures contract to purchase euros and sell U.S. dollars at a fixed exchange rate three months from now. These contracts are marked to market daily, meaning profits and losses are settled at the end of each trading day.
Key Characteristics of Futures Contracts:
Standardization: Futures have fixed contract sizes, maturity dates, and settlement procedures.
Exchange-Traded: Traded on organized exchanges under regulatory supervision.
Daily Settlement: Open positions are marked to market daily, and margin adjustments are made accordingly.
Margins and Clearing Houses: Traders deposit an initial margin and maintain a variation margin to cover potential losses. Clearing houses guarantee the trade, reducing counterparty risk.
4. Forward vs. Future Forex Contracts – Key Differences
Feature Forward Contract Futures Contract
Trading Venue Over-the-counter (OTC) Organized exchanges (e.g., CME)
Customization Fully customizable Standardized
Counterparty Risk Higher (no clearing house) Lower (clearing house guarantees)
Liquidity Lower Higher
Margin Requirement Usually none Required (initial and variation)
Settlement At maturity Daily mark-to-market
Flexibility High Limited due to standardization
Use Case Hedging by corporations Speculation and hedging by traders
In essence, forwards are tailored instruments suited for businesses with specific needs, while futures cater more to traders and investors who prefer liquidity, transparency, and regulatory oversight.
5. Purpose and Applications
A. Hedging
Corporations use forwards and futures to hedge foreign exchange exposure from imports, exports, loans, or investments.
Example: An Indian IT firm expecting USD inflows may sell dollars forward to lock in the current exchange rate and protect against rupee appreciation.
B. Speculation
Traders and investors use futures to profit from expected currency movements.
Example: A trader expecting the euro to strengthen may buy euro futures contracts.
C. Arbitrage
Arbitrageurs exploit differences in currency prices between spot, forward, and futures markets to earn risk-free profits.
Example: Covered interest arbitrage ensures alignment between interest rates and forward premiums.
D. Portfolio Diversification
Forex futures allow institutional investors to gain exposure to foreign currencies, balancing risk in their investment portfolios.
6. Advantages of Forward and Future Forex Contracts
Forwards:
Tailored contracts that meet exact needs.
Useful for long-term hedging.
No upfront margin or daily cash flow requirement.
Futures:
Highly liquid and easily tradable.
Reduced counterparty risk due to clearing houses.
Transparent pricing and regulated environment.
Ideal for short-term trading or speculation.
7. Disadvantages and Risks
Forwards:
High counterparty risk.
Illiquid—difficult to exit before maturity.
No daily marking to market; losses can accumulate unnoticed.
Futures:
Less flexibility due to standardization.
Requires margin deposits, tying up capital.
Daily settlement can create cash flow challenges.
Speculative positions can amplify losses.
8. Market Participants
The key participants in forward and future forex trading include:
Commercial Banks – act as counterparties in forward contracts.
Corporations – hedge foreign exchange risk.
Hedge Funds & Institutional Investors – speculate using futures.
Central Banks – use forwards/futures for currency stabilization.
Retail Traders – participate in exchange-traded futures for short-term gains.
9. Real-World Examples
Forward Example:
A Japanese exporter expecting $5 million from a U.S. buyer in six months locks in the JPY/USD forward rate to avoid yen appreciation losses.
Futures Example:
A currency trader on CME buys British Pound futures anticipating a rise in GBP against USD. If GBP strengthens, the trader profits as the futures contract gains value.
10. Global Forex Forward and Futures Markets
The forward market is vast, largely dominated by interbank transactions. According to the Bank for International Settlements (BIS), forwards account for over $1 trillion in daily turnover globally.
The futures market, while smaller, is growing rapidly due to transparency and accessibility. Leading exchanges like CME, Euronext, and SGX offer a wide range of currency futures, including EUR/USD, GBP/USD, USD/JPY, and emerging market pairs such as USD/INR.
Conclusion
Both forward and future forex trading play critical roles in the international financial system. Forwards provide flexibility and customization, making them ideal for corporations seeking to hedge long-term currency risks. Futures, on the other hand, offer liquidity, transparency, and regulatory safety, making them attractive for traders and investors.
In today’s volatile global economy, where exchange rates can fluctuate due to geopolitical tensions, monetary policies, or economic shocks, these instruments are indispensable tools for managing currency exposure and optimizing financial strategies. The choice between forwards and futures ultimately depends on the trader’s objectives, risk appetite, and the nature of their exposure. Together, they ensure that global trade and investment can proceed with reduced uncertainty and enhanced financial stability.
Capital Flows Impacted1. Understanding Capital Flows
Capital flows are broadly classified into two categories:
Foreign Direct Investment (FDI):
Long-term investments in physical assets like factories, infrastructure, or real estate. FDI represents stable and sustainable investment because it indicates confidence in the host country’s economy.
Portfolio Investment:
Short-term investment in financial assets like stocks, bonds, or other securities. These flows are more volatile, as investors can quickly withdraw funds based on changes in risk perception or economic conditions.
Other Capital Flows:
These include banking sector flows, loans, and remittances. While remittances are generally stable, banking flows can fluctuate depending on interest rates and credit conditions.
Capital flows contribute to a country’s balance of payments, affect exchange rates, and determine the availability of foreign reserves. They can enhance investment, technology transfer, and job creation, but excessive inflows or sudden outflows can destabilize financial markets.
2. Factors Impacting Capital Flows
Capital flows are influenced by both push factors (conditions in advanced economies) and pull factors (conditions in emerging markets).
a. Global Interest Rates
One of the most powerful influences on capital movement is the difference in interest rates between countries.
When interest rates in advanced economies like the United States rise, investors tend to pull money out of emerging markets to take advantage of higher returns on safer assets such as U.S. Treasury bonds.
Conversely, when global interest rates are low, investors seek higher yields in developing countries, leading to capital inflows.
For example, during the U.S. Federal Reserve’s monetary tightening cycles, emerging markets like India, Brazil, and Indonesia often experience capital outflows and currency depreciation.
b. Inflation and Macroeconomic Stability
High inflation reduces the real return on investments, making a country less attractive for foreign capital. Investors prefer economies with stable prices and predictable policy environments. Macroeconomic instability—such as high fiscal deficits, political turmoil, or weak governance—can trigger capital flight as investors look for safer destinations.
c. Exchange Rate Movements
Exchange rate expectations play a crucial role in capital flow decisions.
If investors expect a currency to appreciate, they increase inflows to benefit from exchange gains.
If depreciation is expected, capital outflows intensify as investors try to avoid losses.
Unstable or artificially managed exchange rates can also discourage long-term investment, as they create uncertainty about future returns.
d. Trade and Investment Policies
Governments that promote open trade, ease of doing business, and investor-friendly policies tend to attract more capital. On the other hand, restrictive trade policies, high tariffs, or uncertain regulatory environments discourage investors.
For example, India’s liberalization reforms in the 1990s led to significant FDI inflows, while policy uncertainty in some developing countries has caused capital to dry up.
e. Geopolitical and Global Uncertainties
War, sanctions, political instability, and diplomatic tensions often lead to abrupt shifts in capital flows. Investors seek safe-haven assets such as gold, the U.S. dollar, or Swiss franc during uncertain times. The Russia-Ukraine war and tensions in the Middle East have both demonstrated how quickly capital can move in response to global crises.
3. How Capital Flows Impact Economies
The impact of capital flows can be both positive and negative, depending on their nature, duration, and management.
a. Positive Impacts
Boost to Investment and Growth:
Inflows of foreign capital provide funds for domestic investment, which can increase productivity, job creation, and infrastructure development.
Technology Transfer and Knowledge Sharing:
FDI often brings advanced technologies, managerial skills, and innovation to the host country, improving competitiveness.
Strengthening of Financial Markets:
Portfolio inflows increase liquidity in stock and bond markets, deepening the financial system and promoting market efficiency.
Improved External Balances:
Stable capital inflows help countries finance current account deficits and build foreign exchange reserves.
b. Negative Impacts
Volatility and Financial Instability:
Short-term capital, especially portfolio flows, can exit the market rapidly, leading to sharp currency depreciation, stock market crashes, and financial crises.
Exchange Rate Appreciation (Dutch Disease):
Excessive capital inflows can cause the local currency to appreciate, making exports less competitive and hurting the manufacturing sector.
Asset Bubbles:
Large inflows can fuel speculative investments in real estate or equities, inflating asset bubbles that may burst later.
Dependency and External Vulnerability:
Over-reliance on foreign capital can make an economy vulnerable to global shocks. Sudden outflows can lead to liquidity crises, as witnessed during the 1997 Asian Financial Crisis.
4. Historical and Contemporary Examples
Asian Financial Crisis (1997–98):
Rapid capital inflows into Southeast Asia fueled credit and asset bubbles. When investor confidence collapsed, massive outflows led to currency crashes and economic recessions.
Global Financial Crisis (2008):
In the wake of the crisis, developed nations lowered interest rates, leading to a surge in capital inflows to emerging markets like India and Brazil. However, these flows reversed when the U.S. signaled policy tightening in 2013, causing the “taper tantrum.”
COVID-19 Pandemic (2020):
The pandemic caused unprecedented global uncertainty, leading to sudden capital outflows from emerging markets. Later, massive liquidity injections by central banks brought capital back, especially into tech and healthcare sectors.
Current Scenario (2023–2025):
Persistent global inflation, high U.S. interest rates, and geopolitical instability have created volatile capital movements. Many emerging markets are witnessing capital outflows due to a strong U.S. dollar and rising global risk aversion.
5. Policy Measures to Manage Capital Flow Impacts
Governments and central banks use various strategies to mitigate the negative effects of volatile capital movements:
Monetary Policy Adjustments:
Central banks can use interest rate changes to stabilize currencies and control inflation, influencing the direction of capital flows.
Foreign Exchange Reserves:
Maintaining adequate reserves helps cushion against sudden outflows and currency volatility.
Capital Controls:
Temporary restrictions on certain types of inflows or outflows can prevent speculative attacks and financial instability.
Macroprudential Regulations:
Strengthening the banking system through regulations reduces the risk of asset bubbles and credit booms fueled by capital inflows.
Fiscal Discipline:
A sound fiscal policy framework reassures investors of a stable economic environment, encouraging long-term investment.
6. Conclusion
Capital flows are a double-edged sword in the global economy. While they promote growth, innovation, and development, their volatility poses challenges to economic stability. Managing capital flows effectively requires a careful balance between openness and prudence.
Countries must design policies that attract long-term, productive investments while shielding their economies from the adverse effects of short-term speculative movements. As globalization deepens, the interdependence of financial markets means that even local policy decisions can have global repercussions. Therefore, maintaining financial stability amid changing global capital dynamics remains one of the most critical tasks for modern policymakers.
In essence, capital flows reflect not just the movement of money but the pulse of global confidence — a signal of how nations are perceived in an interconnected economic world.

Risks and Limitations of Time Zone ArbitrageIntroduction
Time zone arbitrage is a strategy that takes advantage of the differences in market operating hours across the globe. Financial markets in various regions — such as Asia, Europe, and North America — operate at different times of the day due to time zone variations. Traders exploit these gaps to profit from price discrepancies in stocks, commodities, or currencies before markets overlap or react to global developments.
While this approach may sound lucrative, it comes with several risks and limitations that can undermine potential profits. In this discussion, we’ll explore the major challenges of time zone arbitrage — from market inefficiencies and execution risks to regulatory hurdles and technological barriers.
1. Market Efficiency and Price Correction
One of the biggest challenges in time zone arbitrage is increasing market efficiency. Modern financial markets are interconnected through high-frequency trading (HFT), algorithmic trading, and real-time data feeds. These technologies reduce the time it takes for price discrepancies to disappear.
For example, if the U.S. market closes with a sharp rally in tech stocks, the Asian market (such as Japan or India) will often adjust its prices almost instantly when it opens. This rapid reaction leaves little room for traders to profit from any price misalignment.
In essence, markets have become too efficient for manual or slow-reacting arbitrageurs to gain consistent profits. What was once an opportunity lasting hours may now last mere milliseconds.
2. Execution Delays and Latency Risk
Even a slight delay in order execution can completely change the outcome of a trade. Time zone arbitrage requires near-instant transactions because prices can change rapidly between markets.
Execution latency may occur due to:
Network delays or poor internet connectivity.
Broker platform lag.
Differences in settlement systems or trading speeds between exchanges.
For instance, by the time a trader executes an arbitrage order between the London and Tokyo markets, prices might have already adjusted to reflect global sentiment, eliminating any profit potential.
Latency risk particularly affects retail traders, as institutional players use advanced infrastructure with microsecond execution capabilities. This makes the competition uneven.
3. Currency Conversion and Exchange Rate Risk
Since time zone arbitrage often involves trading across international markets, foreign exchange (forex) risk becomes significant. When traders buy assets in one currency and sell them in another, fluctuations in exchange rates can erode profits or even cause losses.
For example, suppose a trader profits from a stock arbitrage between the U.S. and Japanese markets. If the Japanese yen strengthens unexpectedly against the U.S. dollar before the trade settles, the final profit could diminish or turn negative.
Moreover, transaction costs involved in currency conversions — such as bank fees or forex spreads — further reduce the net gains from arbitrage trades.
4. Regulatory Restrictions and Compliance Issues
Each country has its own financial regulations, taxation policies, and trading restrictions. When traders engage in time zone arbitrage across jurisdictions, they must comply with multiple regulatory frameworks.
Potential issues include:
Capital controls that restrict the free movement of funds across borders.
Reporting requirements that make it difficult to operate anonymously.
Taxation differences that may eat into profits or create double-taxation risks.
Banned practices, as some countries limit certain forms of short-selling or speculative trading.
Failure to comply with these regulations can lead to penalties, account freezes, or even legal action — especially for traders operating without proper licensing.
5. Liquidity Constraints
Time zone arbitrage depends on market liquidity, which refers to how easily assets can be bought or sold without affecting prices. However, not all markets are equally liquid.
For example, the U.S. and European markets are deep and highly liquid, but smaller exchanges in Asia or Africa might experience low trading volumes. This can result in:
Wider bid-ask spreads, reducing profit margins.
Difficulty in executing large orders without slippage.
Delayed trade settlements.
Low liquidity also increases the risk of being “stuck” in a position — unable to sell at the desired price before the market adjusts.
6. Overnight and Weekend Risks
Since markets in different time zones open and close at varying hours, overnight positions expose traders to unexpected market movements.
For instance, a trader who buys shares on a U.S. exchange and plans to sell them in an Asian market the next morning could face risk from:
Overnight geopolitical events.
Economic data releases.
Company earnings announcements.
Unexpected global news or natural disasters.
Similarly, holding positions over weekends or holidays when markets are closed may result in gaps — where prices open significantly higher or lower than the previous close — causing unplanned losses.
7. Data Inconsistencies and Information Lag
Reliable and real-time data is essential for time zone arbitrage. However, data inconsistencies between markets or time delays in financial reporting can distort traders’ judgments.
For example, corporate earnings reported in one country might not be immediately reflected in another region’s market data feeds. Traders relying on outdated or inaccurate information might take positions based on incomplete insights, leading to financial losses.
Moreover, subscription-based financial data services or news terminals can be expensive, putting retail traders at a disadvantage compared to large institutional firms.
8. High Transaction and Operational Costs
Arbitrage across multiple markets involves multiple layers of cost, including:
Brokerage commissions.
Clearing and settlement charges.
Forex conversion fees.
Cross-border transfer costs.
Exchange access fees.
These expenses can significantly reduce the net profit margin, especially for small traders. Unlike large institutions that negotiate low transaction fees, retail traders often face higher costs per trade, making time zone arbitrage economically unviable in many cases.
9. Competition from Algorithmic Traders
Modern financial markets are dominated by algorithmic and high-frequency trading systems that can detect and exploit price discrepancies far faster than humans. These algorithms continuously scan global exchanges for arbitrage opportunities and execute trades automatically within milliseconds.
As a result, manual traders rarely find meaningful gaps before algorithms close them. The speed advantage of these systems, combined with their capacity to execute thousands of trades per second, has made time zone arbitrage extremely competitive and less profitable for ordinary investors.
10. Psychological and Logistical Challenges
Time zone arbitrage requires traders to monitor markets that operate in different time zones — often late at night or early in the morning. This leads to physical and mental strain, affecting decision-making and accuracy.
Maintaining focus across multiple trading sessions can result in:
Fatigue and stress.
Increased likelihood of human errors.
Poor reaction to sudden news or market movements.
Additionally, managing trades across various countries involves handling multiple trading accounts, regulatory systems, and tax jurisdictions — making operations complex and time-consuming.
11. Limited Profit Margins
Unlike speculative trades that may yield large returns, arbitrage profits are typically small and incremental. These small gains depend on executing large volumes of transactions efficiently.
For individuals or small firms without access to institutional-level resources, the cost-to-profit ratio often becomes unfavorable. When transaction costs, taxes, and risks are factored in, the net gain may be minimal or even negative.
12. Political and Economic Instability
Global markets are influenced by macroeconomic policies, trade relations, and political stability. Sudden policy changes, such as import bans, sanctions, or currency devaluations, can disrupt arbitrage strategies overnight.
For example, unexpected interest rate changes by central banks or geopolitical tensions (like wars or elections) can trigger volatile price swings, making arbitrage trades unprofitable or risky to hold.
Conclusion
While time zone arbitrage once offered profitable opportunities in the global market landscape, its potential has diminished significantly in the era of technological advancement, regulatory tightening, and high-speed trading systems.
Today, only institutions equipped with advanced infrastructure, deep liquidity access, and global compliance frameworks can effectively capitalize on fleeting cross-market discrepancies.
For individual traders, time zone arbitrage presents high complexity and low reward, often outweighed by the risks of execution delays, currency fluctuations, and regulatory hurdles.
In short, while the theory of profiting from market time gaps remains appealing, in practice, time zone arbitrage has become a high-risk, low-margin endeavor — best approached with caution, precision, and a deep understanding of global financial dynamics.
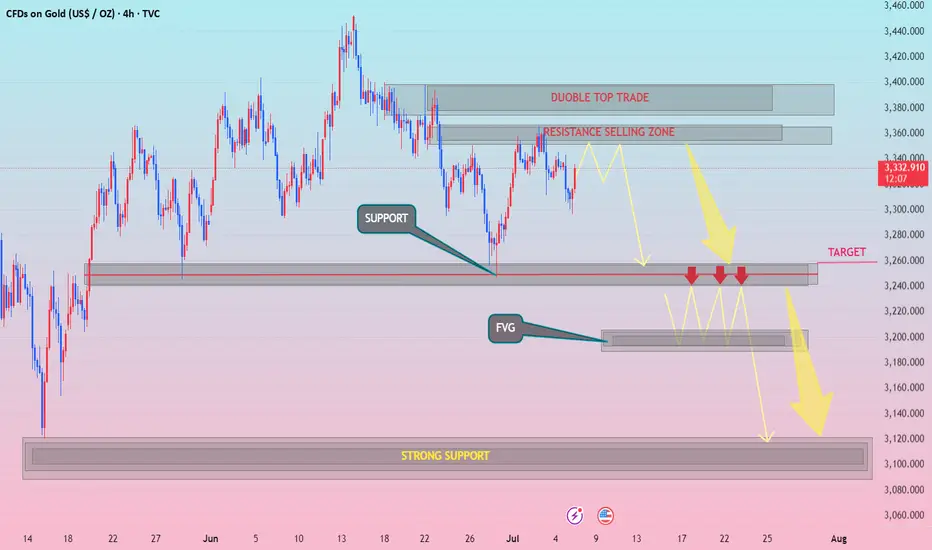
XAUUSD h4 down pattranDouble Top Yes Break above neckline = Bullish invalidation
Resistance Selling Zone Yes May flip to support
Target Zone (3,260) Yes Over-tested support may trigger reversal instead
FVG (~3,200) Yes May not fill if bullish momentum sustains
Strong Support (~3,100) Yes Price might not drop that far before buyers
WITH ZARA..FVG
Market next target 🔄 Disruption Analysis:
📌 Current Scenario:
Price is trading around 3,336.400, just below the identified resistance zone (~3,340-3,343).
A range-bound structure is visible with repeated rejections at resistance and support.
---
🚨 Disruption View:
❌ Invalidating Bearish Bias:
The chart assumes a bearish move toward the 3,320 target, but there are early signs of strength near the mid-range (3,335 area).
Failed breakdowns and higher lows indicate buying pressure below 3,330.
---
🟢 Alternative Disruption Outlook (Bullish Flip):
If price breaks and holds above 3,343 resistance, we may see:
🔼 Upside breakout toward 3,355–3,360 zone.
📈 Continuation of the larger uptrend from July 1st rally.
---
🔁 Key Disruption Levels:
Support: 3,328–3,330 (interim zone to watch before full drop)
Resistance: 3,343–3,345 (bullish breakout point)
Invalidation of Bearish Bias: Closing above 3,345 on strong volume.

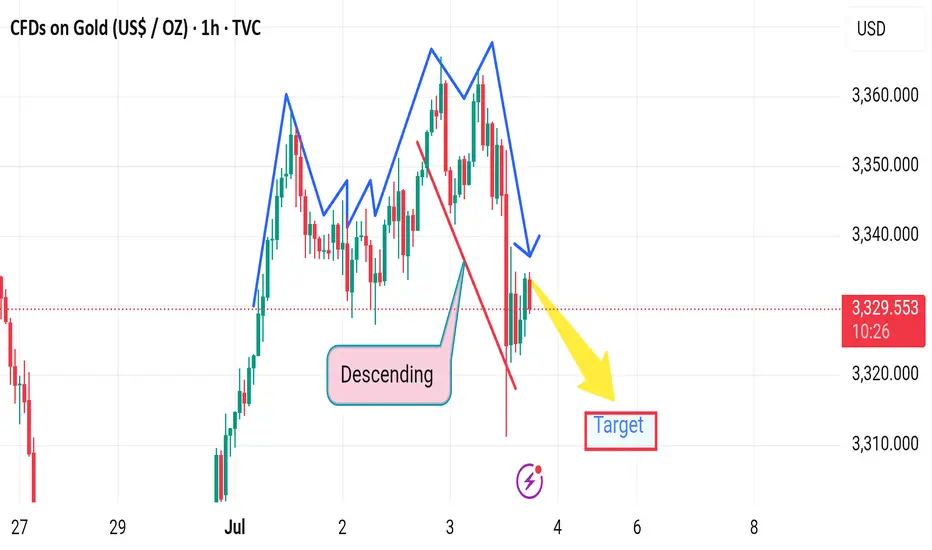
Market next target ⚠️ Disruption Analysis – Gold (1H):
🔹 Pattern Disruption Identified:
The chart previously followed a descending structure with lower highs and lower lows, confirming bearish momentum.
However, a temporary recovery (small bullish correction) appears after a sharp drop, disrupting the previous flow.
---
🔄 Disruption Points:
1. Break in Momentum (Structure Shift):
The recent bullish correction (small upward leg) challenges the consistency of the descending trend.
It signals a potential pause or trap in the current bearish move.
2. Price Rejection Area:
Price attempted to bounce but failed to break above the previous lower high, indicating bearish strength remains intact, but is facing disruption from short-term buyers.
3. Volatility Spike:
The long wick on the recent candle shows a volatility disruption, likely due to economic news or high-impact events (suggested by the ⚡ icon on the chart).
4. Target Zone Disruption:
Though the yellow arrow points toward a bearish target, the slight upward pullback adds uncertainty about whether price will reach that level immediately.
Market next move ❗ Disrupted Market Outlook:
⚠️ False Breakout Risk:
The recent "Breakout" above previous highs may be a bull trap. Although price surged, the follow-up candles are showing lower highs, suggesting weakening bullish momentum.
📉 Bearish Divergence (not shown but likely):
Based on the price action, there's a potential bearish divergence with RSI/MACD (if overlaid), as price makes higher highs while momentum likely weakens.
🔄 Resistance Reversal Zone:
The area labeled as "Support area" at the top (near $67.50) is actually acting as resistance again — the market is failing to hold above this level.
🔁 Retest Failure:
After the breakout, price failed to establish strong support and is consolidating below the highs, hinting at a potential breakdown below $66.
---
🔻 Disruption Path:
1. Drop to $66.00 - immediate pullback from failed breakout.

Market next target 🔀 Disruption Analysis – Bullish Alternative Scenario
The current chart suggests a bearish outlook from the resistance zone (~$2,495–$2,500), targeting a drop below $2,425. However, here’s how a bullish disruption could break this bearish narrative:
---
🟢 Bullish Disruption Possibility:
1. Support Reclaim & Strong Buyer Reaction:
If price reclaims and holds above the marked “support area” (~$2,495), it could signal strength and trap early sellers.
A strong bullish candle closing above $2,505 could invalidate the bearish scenario.
2. Higher Low Formation:
If ETH prints a higher low above $2,470, it would suggest buyers are stepping in early, reinforcing bullish momentum.
3. Target Shift – Bullish Continuation:
A confirmed breakout above $2,505 may open the path to $2,540–$2,560 as the new short-term target zone.
4. Momentum Catalyst:
A positive U.S. macroeconomic event or crypto-specific bullish news (e.g., ETF, institutional inflows) could fuel upside disruption.

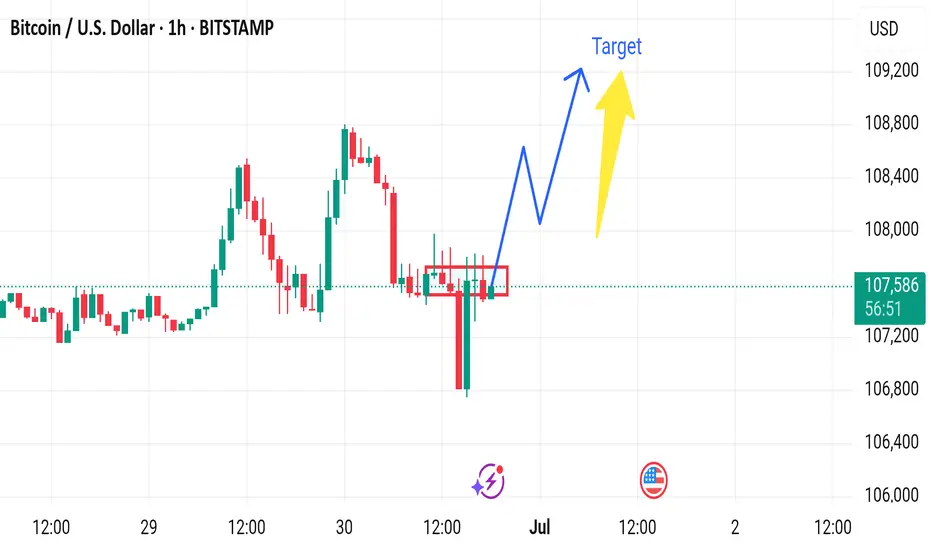
Market next target 🔀 Disruption Analysis – Bearish Alternative Scenario
The current chart suggests a bullish continuation from the consolidation zone around $107,300–$107,500, with a projected move toward $108,500+. However, the following bearish disruption could invalidate that path:
---
🔻 Bearish Disruption Possibility:
1. False Breakout Trap:
If price briefly spikes above the consolidation zone and quickly reverses, it could trap breakout buyers.
A failed bullish move around $107,800–$108,000 would be the first bearish signal.
2. Weak Volume Confirmation:
Lack of volume during the breakout would signal lack of institutional interest, increasing downside risk.
3. Break Below Support Zone:
If BTC breaks below $107,000, it would signal a loss of momentum and invalidate the bullish scenario.
This breakdown may lead to a quick move toward $106,000 or even $105,800, the recent swing low.
4. Macro Influence:
Any negative U.S. economic data or regulatory news could spark bearish sentiment and accelerate the drop.
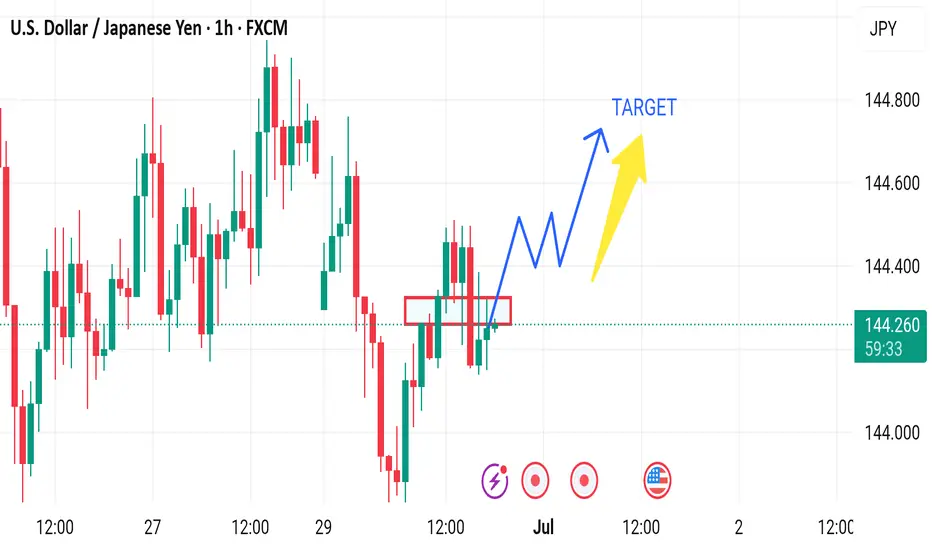
Market next move 🔀 Disruption Analysis – Bearish Alternative Scenario
While the current setup points to a bullish continuation above the support zone (around 144.10–144.20) with a projected target near 144.60, here’s how a bearish disruption could unfold instead:
---
🔻 Bearish Disruption Possibility:
1. Failed Breakout / Bull Trap:
Price may fake a move upward to trap breakout buyers near 144.40–144.50, then sharply reverse.
This would indicate a false breakout and potential reversal setup.
2. Rejection at Resistance:
Repeated failure to close above 144.40 may signal exhaustion.
Bearish divergence could form on momentum indicators (like RSI) as price rises.
3. Break Below Support Area:
A decisive break below the red support zone (around 144.10) may shift momentum bearish.
That would confirm a lower high and suggest downside continuation.
4. Next Bearish Target:
Initial support lies at 143.85, with further potential drop toward 143.60.
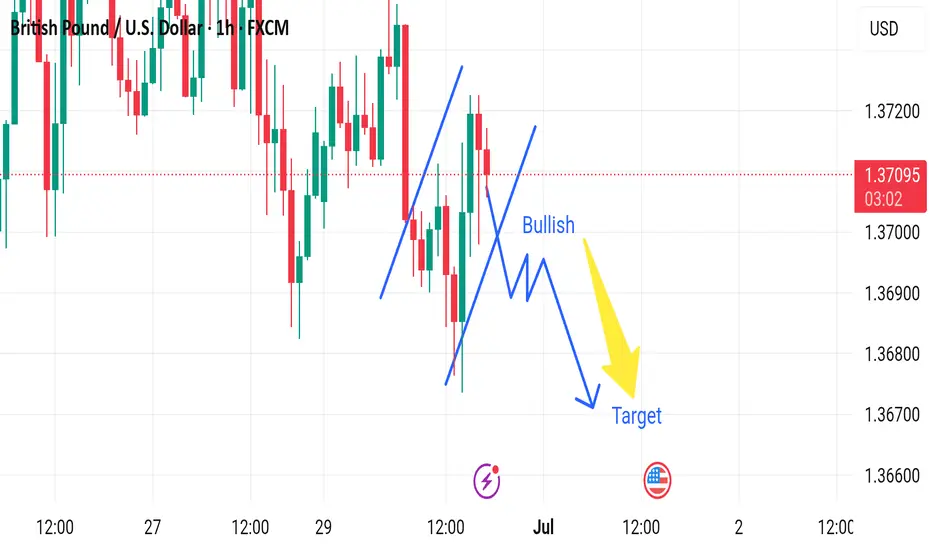
Market next target 🔀 Disruption Analysis – Bullish Alternative Scenario
While the current chart outlines a bearish scenario after a short-term bullish correction, leading to a drop toward the target near 1.36600, here’s how a bullish disruption could unfold instead:
---
🟢 Bullish Disruption Possibility:
1. False Breakdown / Bear Trap:
The market may dip slightly below recent lows to trigger sell stops and liquidity grab, then reverse upward.
If price finds strong buying interest around 1.3690–1.3700, it could spark a bullish reversal.
2. Strong Rejection Candles:
Watch for bullish engulfing or pin bar formations on lower timeframes (15m or 30m) near the dip area.
These would signal loss of bearish momentum.
3. Break of Lower High Structure:
A break above 1.3720 would shift short-term market structure to bullish.
It could lead to a move toward 1.3750–1.3780.
4. Macro Fundamentals:
Hawkish BOE comments or weak U.S. data could reverse USD strength, lifting GBP/USD.
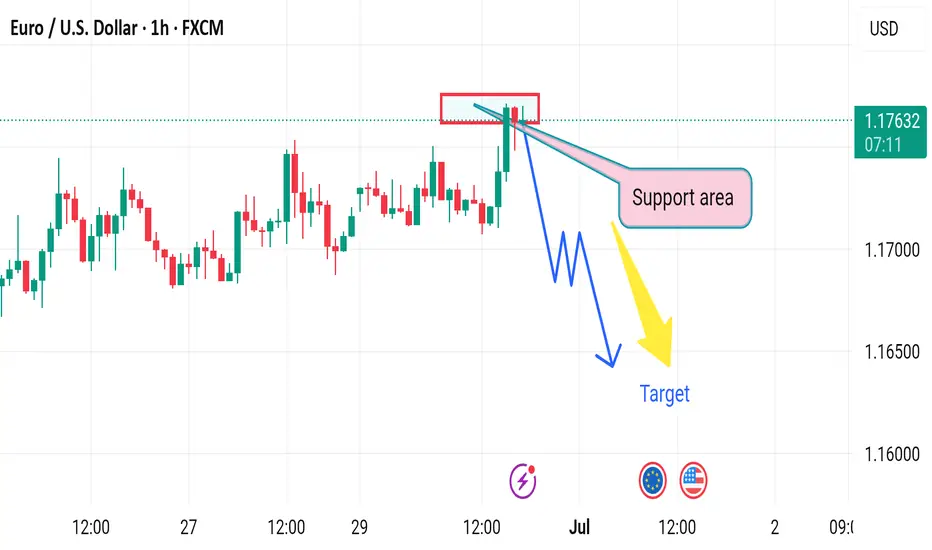
Market next move Disruption Analysis – Bullish Alternative Scenario
While the current chart suggests a bearish setup from a resistance zone (around 1.1765) toward a target near 1.1630, here's a potential bullish disruption that could invalidate the bearish thesis:
---
🟢 Bullish Disruption Possibility:
1. False Breakdown / Liquidity Grab:
Price may fake a dip below the red resistance-turned-support zone to trigger stop-losses before reversing.
This is known as a liquidity sweep or bear trap.
2. Higher Low Formation:
If the pair pulls back slightly but forms a higher low above 1.1700, it may signal bullish continuation.
3. Breakout Confirmation:
A strong bullish candle above 1.1775 could confirm continuation toward 1.1830–1.1850.
4. Fundamental Catalyst:
Positive EU economic news or dovish signals from the U.S. Fed could support Euro strength.
Market next target 🔀 Disruption Analysis - Alternative Scenario
While the current chart suggests a bullish breakout from the support area around $35.85–$35.90 with an upward target above $36.20, a potential bearish disruption scenario could unfold under the following conditions:
⚠️ Bearish Disruption Possibility:
1. Weakening Buying Pressure:
Price has tested the support zone multiple times, showing signs of weakening bullish momentum.
Buyers may be exhausting near the $36.00 area without strong follow-through.
2. Break Below Support:
If price breaks and closes below $35.85 support zone on high volume, it could invalidate the bullish setup.
This would create a lower low, indicating a potential trend reversal to the downside.
3. Next Downside Targets:
Immediate support lies around $35.60.
Further downside could take price to $35.40 if bearish momentum strengthens.
4. Bearish Triggers:
Negative economic data (especially U.S.-related as indicated by the calendar icon).
Rising DXY or bond yields may pressure silver prices

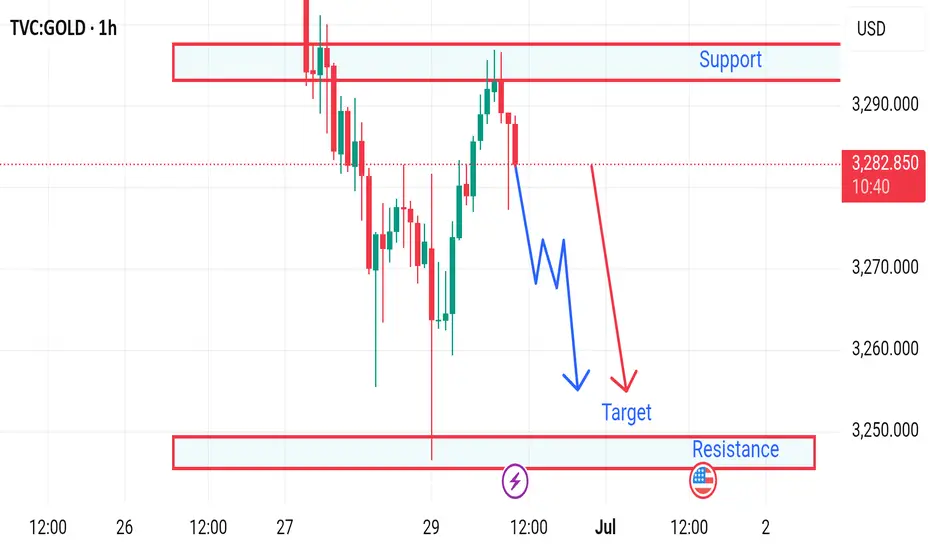
Market next move 📉 Gold Price Disruption Analysis – 1H Chart
Current Price: $3,282.880
Timeframe: 1-Hour
Trend Direction: Bearish bias with possible continuation toward $3,250
---
🔻 Bearish Scenario (Planned Path):
Support Turned Resistance: The area around $3,290 acted as strong resistance (previous support). Price failed to break above.
Lower High Formation: Price has created a lower high, indicating potential continuation to the downside.
Projected Target: A zigzag downward move is expected, with a target near $3,250, aligning with a key demand/support zone.
---
⚠️ Disruption Possibilities (Unexpected Movements):
🔁 1. Bullish Disruption Risk:
If buyers step in aggressively above $3,283–$3,285, we may see:
A break of structure
A reversal toward the $3,290+ zone
Possible formation of a double bottom or inverse head and shoulders
Disruption Target: $3,295–$3,300
🧨 2. False Breakdown at Support ($3,250):
Market could dip slightly below $3,250 to trap sellers and then reverse sharply.
A liquidity grab might lead to sudden bullish pressure, creating a disruption bounce.
📊 3. Fundamental Disruption Factors:
US Dollar strength/weakness
Fed interest rate news
Inflation data releases
These can instantly invalidate technical patterns and push price in either direction.
Market next move 🔄 Disruption Analysis: Contrarian View
⚠️ Original Viewpoint Summary:
The original analysis suggests a bearish breakdown from the rising channel, with a short-term target of 64.36, pointing to a move towards the support zone.
---
📉 Disrupted (Contrarian) Perspective:
🔁 Fakeout Scenario Possibility:
The sharp drop below the trendline may be a bear trap.
Price quickly bounced back into the channel region, showing buyer interest near the support.
🔎 Key Observations:
Wick rejection near the lower support suggests that demand is active around 64.50–64.36 zone.
The structure of higher lows is still valid unless there's a confirmed close below the support box.
Momentum indicators (not shown) may help validate whether this is a temporary pullback or a deeper correction.
📈 Alternative Projection:
If price holds above the support zone, it could rebound back to test 65.50–65.80 resistance.
A false breakdown followed by consolidation may lead to retest of the upper channel (near 66.00).
---
🧭 Revised Strategy Suggestion:
Avoid early shorts unless there is a confirmed candle close below 64.36.
Watch for bullish price action near support (hammer, engulfing) for a potential long re-entry.
Reevaluate if WTI forms a base around 64.40 — possible reversal setup.

Market next target 🟥 Disrupted (Bearish or Cautious) Analysis:
1. Failed Bullish Attempt Risk
While a bounce from the support zone (~3,260 USD) is visible, the momentum lacks strong bullish confirmation. The rejection from the support area could be a dead-cat bounce, especially since the overall trend leading into this zone was sharply downward.
2. Volume Divergence
The volume spike on the large red candle suggests heavy selling pressure, not accumulation. The weak follow-up volume on the minor green recovery bars indicates a lack of buyer confidence.
3. False Breakout Possibility
If price does push toward the “Target” or even the “Resistance” zone (3,290–3,310), it might be a bull trap, luring late buyers in before a reversal back downward.
4. Bearish Continuation Scenario
Price may retest the support zone (3,260) again.
If this support breaks decisively, it could trigger a strong sell-off, with potential to test lower zones around 3,240 or even 3,200.

Market next move Disruption (Bearish Scenario):
1. False Breakout Risk:
The price has recently tested the lower support range (red boxes) several times without strong follow-through. This could suggest weak buying momentum.
2. Volume Spike Trap:
The large volume spike on the wick down may represent stop-loss hunting or a liquidity grab rather than true accumulation. If it were strong accumulation, we would expect a more sustained bounce.
3. Resistance Zone Ahead:
The price is nearing resistance around $3,275–$3,280, where previous breakdowns started. If it fails to break above this zone decisively, a rejection and continued downtrend is possible.
4. Lower High Formation:
The most recent price action could form a lower high, suggesting a continuation of the bearish trend instead of a reversal.
---
🔽 Bearish Path (Alternative Projection):
Price retests $3,275–$3,280, fails to break out.
Drops below the red box support (~$3,260).
Heads toward the next support levels around $3,240 or lower.
📉 "Target becomes invalidated if price fails to hold above the red box support zone."

Market next target ⚠️ Disruption & Analytical Weaknesses:
1. Support Zone Already Broken (Wick Penetration):
The candlestick wick clearly pierced the support level drawn on the chart.
This indicates that buyers are weak at that level — the support is not holding firmly.
Relying on this support for a bullish bias is risky, as it may soon turn into resistance.
2. Volume Confirms Weakness, Not Strength:
The bounce from the support zone happens on low or declining volume, suggesting lack of strong buying interest.
A legitimate bullish reversal should be backed by a volume surge — here, that’s absent.
3. False Sense of Recovery:
The analysis shows arrows projecting straight up to the “Target” level, implying a smooth bullish recovery.
This is unrealistic given the recent choppy price action and repeated failures to hold gains above 107,200.
Price action suggests uncertainty or distribution, not clean bullish momentum.
4. Tight Range and High Volatility Ignored:
Price has been ranging between ~106,400 and ~107,600 with rapid whipsaws.
This kind of structure is often indicative of indecision, and setting a clear directional target without breakout confirmation is premature

Market next target ⚠️ Disruption & Counterpoints:
1. Premature Breakout Bias:
The chart shows price repeatedly rejecting the resistance zone (highlighted in red).
The arrow assumes a clean breakout without confirmation — this is speculative, as the price hasn’t closed convincingly above the resistance.
This could easily turn into a false breakout or double top if price fails again.
2. Volume Mismatch:
A breakout should be backed by strong bullish volume. However, the current volume is mixed and not showing a clear surge in buyer strength.
Lack of volume confirmation makes the breakout less reliable.
3. Ignoring Recent Rejections:
The red zone was tested multiple times in the last sessions without success. That typically signals strong supply or institutional selling.
Repeating this setup without accounting for historical failure adds downside risk.
4. Missing Bearish Scenario:
No alternate path is considered. A failed breakout could lead to a pullback toward 144.00 or lower, especially with U.S. news events (indicated by the flag).
A balanced analysis should always prepare for both breakout and rejection.
5. Macroeconomic Event Risk:
Similar to the GBP/USD chart, this one also shows an upcoming U.S. economic event. That could heavily move USD/JPY, and technical setups may become invalid fast.
The analysis ignores the need to wait for the news catalyst or confirmation after the release.
