XAU/USD 17 October 2025 Intraday AnalysisH4 Analysis:
-> Swing: Bullish.
-> Internal: Bullish.
Analysis and bias remains the same as yesterday's analysis, however CHoCH positioning has moved closer to more recent price action.
Price has printed a further bullish iBOS, however, I will apply discretion and not classify it as such due to the insignificant depth of pullback relative to recent price action.
At the time of this analysis price is continuing to print bullish without pause, which, as a result, I am unable to confirm a fractal high.
Current bearish CHoCH positioning is denoted with a blue horizontal dotted line.
Intraday expectation:
Price to print bearish CHoCH to indicate bearish pullback phase initiation.
Note:
The Federal Reserve’s sustained dovish stance, coupled with ongoing geopolitical uncertainties, is likely to prolong heightened volatility in the gold market. Given this elevated risk environment, traders should exercise caution and recalibrate risk management strategies to navigate potential price fluctuations effectively.
Additionally, gold pricing remains sensitive to broader macroeconomic developments, including policy decisions under President Trump. Shifts in geopolitical strategy and economic directives could further amplify uncertainty, contributing to market repricing dynamics.
H4 Chart:
M15 Analysis:
-> Swing: Bullish.
-> Internal: Bullish.
Price has continued bullish printing further ATH's.
Price has printed a further bullish iBOS and has again reacted from discount of 50% EQ.
Intraday expectation:
Price to target weak internal high, priced at 4,380.990.
Alternative scenario: As all higher timeframes are requiring a pullback, and we are seeing a narrowing of internal structure, price could target strong internal low.
Note:
Gold remains highly volatile amid the Federal Reserve's continued dovish stance, persistent and escalating geopolitical uncertainties. Traders should implement robust risk management strategies and remain vigilant, as price swings may become more pronounced in this elevated volatility environment.
Additionally, President Trump’s tariff announcements, particularly against China, are expected to further amplify market turbulence, potentially triggering sharp price fluctuations and whipsaws.
M15 Chart:
Fractal

EURUSD LONGI’m placing a limit order on EUR as well. I strongly recommend not just copying trades, but actually understanding the logic of the market. If anyone’s interested, write in the comments — I’m always happy to chat and share experience.

BITCOIN ACCUMULATIONS MAY START <= 100KFor those planning to buy Bitcoin (BTC), you could wait for the price to decline to the $100,000 level or below.
Currently, the price chart shows a "double top" formation, which is a potential bearish reversal signal. I suspect this could evolve into a "head and shoulders" pattern. A break below the neckline could push the price toward the discount or value area.
N.B!
- BTCUSD price might not follow the drawn lines . Actual price movements may likely differ from the forecast.
- Let emotions and sentiments work for you
- ALWAYS Use Proper Risk Management In Your Trades
#ethusd
#crypto
#btcusd

S&P500 | Mild CrashRisk assets looking to sell off as the stock market tops out around $6,800.
Current price action is only pulling back to test sellers again and we should see a continuation in selling until mid November and hopefully to see a Christmas rally to end the year off.
Since price action awfully looks similar to '24 - '25 Fractal we could say the SPX will look to top next year February/March also considering we're on correction 4 in the Elliott Wave Theory.
Would like to see the S&P bottom out around April - July months of next year at $5,600 if we can continue the bullish parallel trend.

XAU/USD 16 October 2025 Intraday AnalysisH4 Analysis:
-> Swing: Bullish.
-> Internal: Bullish.
Analysis and bias remains the same as yesterday's analysis, however CHoCH positioning has moved closer to more recent price action.
Price has printed a further bullish iBOS, however, I will apply discretion and not classify it as such due to the insignificant depth of pullback relative to recent price action.
At the time of this analysis price is continuing to print bullish without pause, which, as a result, I am unable to confirm a fractal high.
Current bearish CHoCH positioning is denoted with a blue horizontal dotted line.
Intraday expectation:
Price to print bearish CHoCH to indicate bearish pullback phase initiation.
Note:
The Federal Reserve’s sustained dovish stance, coupled with ongoing geopolitical uncertainties, is likely to prolong heightened volatility in the gold market. Given this elevated risk environment, traders should exercise caution and recalibrate risk management strategies to navigate potential price fluctuations effectively.
Additionally, gold pricing remains sensitive to broader macroeconomic developments, including policy decisions under President Trump. Shifts in geopolitical strategy and economic directives could further amplify uncertainty, contributing to market repricing dynamics.
H4 Chart:
M15 Analysis:
-> Swing: Bullish.
-> Internal: Bullish.
Price has continued bullish printing further ATH's.
Price has printed a bullish iBOS and has reacted from discount of 50% EQ.
Intraday expectation:
Price to target weak internal high, priced at 4,242.380.
Alternative scenario: As all higher timeframes are requiring a pullback, and we are seeing a narrowing of internal structure, price could target strong internal low.
Note:
Gold remains highly volatile amid the Federal Reserve's continued dovish stance, persistent and escalating geopolitical uncertainties. Traders should implement robust risk management strategies and remain vigilant, as price swings may become more pronounced in this elevated volatility environment.
Additionally, President Trump’s tariff announcements, particularly against China, are expected to further amplify market turbulence, potentially triggering sharp price fluctuations and whipsaws.
M15 Chart:

Ethereum.. Time for new highs?Price is Fractal - Revisiting this year's price action
In December of 2024, Ethereum tapped the 4100 level before dumping down to the $1400 level at the bottom of the altcoin bear market.
In doing so, it left behind equal highs at 4100. Prior to the move lower, it also had left behind equal lows at the $2050 mark - this can be spotted on the weekly timeframe. Leaving behind these equal highs/lows are classic signs of engineering liquidity - price tends to revisit it later.
What followed was a sweep of the 2050 equal lows and also the $1500 lows from August 2023. Once price reclaimed the 2050 level, I called for a rally back to 4100 highs to sweep. This is how price often reacts anyway.
Present
The current local range for ETH between $3400 and $4800 presents a similar opportunity. There are equal highs and equal lows as shown in the chart with the monthly level of $4100 smack in the middle. I personally don't want any HTF (>1D) below this 4100 level as it would signal significant weakness. But I do see a potential intraweek wick down to the sweep the $3400 equal lows. Keep in mind I don't see this as a certainty. But if Bitcoin continues to show weakness in the face of US-China trade tensions, then everything is on the table and one must think about the different scenarios.
As such, I'm looking at the possibility of a wick down to sweep those levels and ideally we get a swift recovery back above this level and back above the $4100 as confirmation. This would cement the outlook that a sweep of $4800 is next and onto new highs, which would likely be above $5000.
The Bearish Case
Ethereum is also in a larger HTF monthly range from all the way back in 2021. The monthly chart shows price ranging from $1500 to $4500. Given that we are range highs and are currently breaking back into the range, one must consider the possibility of the range continuing. If this were the case and $4100 were lost and $3400 does not provide a swift recovery, then a move back down to $2800 (mid-range) and lower would have to be considered.
Either way, this isn't the time for me to gamble and take in a leveraged position. I'd much rather see a sweep and a reversal for a confirmation for a swing long hold.
Let's see how it plays out.

GBPUSD Trading planThe price is currently in the rejection block zone. This zone could serve as a potential Point A, which will need to be confirmed and validated.
Let’s shift to the daily timeframe for a more detailed, local analysis of the chart.

USDJPY – Possible Reversal Setup (M15 + H1 Confluence)Price engineered a clean liquidity sweep beneath prior intraday lows, triggering a 1H Change of Character (CHoCH) that confirmed a shift from bearish to bullish order flow.
The move originated from a 15-Minute Refined POI within the liquidity grab zone — the likely area of institutional accumulation.
As long as structure remains bullish above the refined POI, the focus remains on higher liquidity targets around:
→ 151.612 – 152.000 (internal liquidity)
→ 152.370 – 152.600 (H4 supply)
This setup suggests a short-term retracement toward premium levels before potential redistribution from the higher-timeframe supply zone.
📍 Key Confluences
• Liquidity sweep into discount pricing
• 1H CHoCH confirmation
• 15M refined POI reaction
• Imbalance targets aligning with premium pricing
📈 Bias: Bullish retracement
📉 Invalidation: Break below 150.800

Bitcoin’s Bloodbath Was a Setup Smart Money Knows ItBitcoin remains structurally bullish despite the recent market turmoil. The monthly chart clearly shows that the main ascending trendline continues to hold firm acting as the backbone of the current bull cycle.
The recent drop was nothing more than a controlled retest of this key support zone. As long as Bitcoin stays above $103,000 and the trendline remains intact, the bull market stands strong.
Next upside projections:
First target: $126K – $165K
Extension target: $200K+
Only a confirmed monthly close below $103K would invalidate the bullish structure. Until then, this phase remains a buyers’ market, not a sellers’.
Share your thoughts below do you believe this trendline can carry BTC to new highs?
Like & share if you agree.


XAU/USD 15 October 2025 Intraday AnalysisH4 Analysis:
-> Swing: Bullish.
-> Internal: Bullish.
Price has printed a further bullish iBOS, however, I will apply discretion and not classify it as such due to the insignificant depth of pullback relative to recent price action.
At the time of this analysis price is continuing to print bullish without pause, which, as a result, I am unable to confirm a fractal high.
Current bearish CHoCH positioning is denoted with a blue horizontal dotted line.
Intraday expectation:
Price to print bearish CHoCH to indicate bearish pullback phase initiation.
Note:
The Federal Reserve’s sustained dovish stance, coupled with ongoing geopolitical uncertainties, is likely to prolong heightened volatility in the gold market. Given this elevated risk environment, traders should exercise caution and recalibrate risk management strategies to navigate potential price fluctuations effectively.
Additionally, gold pricing remains sensitive to broader macroeconomic developments, including policy decisions under President Trump. Shifts in geopolitical strategy and economic directives could further amplify uncertainty, contributing to market repricing dynamics.
H4 Chart:
M15 Analysis:
-> Swing: Bullish.
-> Internal: Bullish.
Price has continued bullish printing further ATH's.
Price has printed a further bullish iBOS. Current CHoCH positioning is denoted with a blue horizontal dotted line.
At the time of this analysis price is continuing bullish without puase, therefore, I am unable to confirm a fractal high.
Intraday expectation:
Allow price to print bearish CHoCH to indicate bearish pullback phase initiation.
Note:
Gold remains highly volatile amid the Federal Reserve's continued dovish stance, persistent and escalating geopolitical uncertainties. Traders should implement robust risk management strategies and remain vigilant, as price swings may become more pronounced in this elevated volatility environment.
Additionally, President Trump’s tariff announcements, particularly against China, are expected to further amplify market turbulence, potentially triggering sharp price fluctuations and whipsaws.
M15 Chart:

CONCENTRIX (CNXC) POTENTIAL DOUBLE BOTTOM LIKELY A BUY SIGNALCNXC stock price that has been heavily beaten down by market due to the fear over AI disrupting their business models. While the stock has seen a significant price drop, a compelling investment case is forming at these depressed levels, combining both the company's strong fundamental story and a potential technical buy signal. A weekly double bottom (or HL) price formation, will be a BUY confirmation.
FUNDAMENTALS
- Strong Financials: Despite the negative sentiment, CNXC continues to generate significant cash flow (a ~20% FCF yield).
- Cheap Valuation: Trading at a forward P/E ratio of around 4.5x, the stock is priced as if it's in terminal decline, which seems disconnected from its stable operational performance.
- Resilient Business: Only a small portion (~7%) of CNXC's business is the "low-complexity" work truly at risk of AI which is causing negative sentiment. But now, the company is actively integrating AI into its offerings, turning a threat into a high-margin opportunity.
N.B!
- CNCX price might not follow the drawn lines . Actual price movements may likely differ from the forecast.
- Let emotions and sentiments work for you
- ALWAYS Use Proper Risk Management In Your Trades
#cncx
#nasdaq
#nyse

XAU/USD 14 October 2025 Intraday AnalysisH4 Analysis:
-> Swing: Bullish.
-> Internal: Bullish.
Price has printed according to yesterday's intraday expectation by printing a bearish CHoCH.
We are now trading within an established internal range.
Intraday expectation:
Price to continue bearish, react at either discount of internal 50% EQ, or H4 supply zone before targeting weak internal high priced at 4,179.935
Note:
The Federal Reserve’s sustained dovish stance, coupled with ongoing geopolitical uncertainties, is likely to prolong heightened volatility in the gold market. Given this elevated risk environment, traders should exercise caution and recalibrate risk management strategies to navigate potential price fluctuations effectively.
Additionally, gold pricing remains sensitive to broader macroeconomic developments, including policy decisions under President Trump. Shifts in geopolitical strategy and economic directives could further amplify uncertainty, contributing to market repricing dynamics.
H4 Chart:
M15 Analysis:
-> Swing: Bullish.
-> Internal: Bullish.
Price has continued bullish printing further ATH's.
During the bullish run, price has printed two very insignificant bearish CHoCH's before price continued bullish.
Due to the insignificance of the bearish CHoCH's I have left them unmarked.
Price has since printed a further bearish CHoCH which is denoted with a blue horizontal dotted line.
We are now trading within an established internal range, however, I shall continue to monitor price with regards to depth of pullback.
Intraday expectation:
Price to continue bearish, react at either discount of internal 50% EQ, or M15 supply zone before targeting weak internal high priced at 4,179.135.
Note:
Gold remains highly volatile amid the Federal Reserve's continued dovish stance, persistent and escalating geopolitical uncertainties. Traders should implement robust risk management strategies and remain vigilant, as price swings may become more pronounced in this elevated volatility environment.
Additionally, President Trump’s tariff announcements, particularly against China, are expected to further amplify market turbulence, potentially triggering sharp price fluctuations and whipsaws.
M15 Chart:

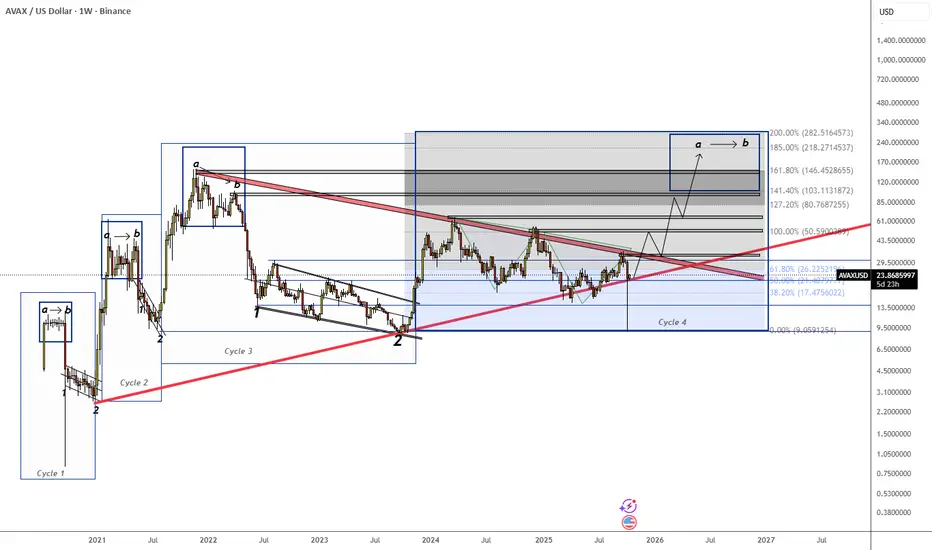
AVAX/USD - Projection idea - Cycle 4AVAX its about to break its downtrend to start an expansion cycle 4.
If history repeats again, we could see BNB between 146$ - 282$ with an average price of 218$ aprox.
Weekly Chart so updates will be slow. Just keep an eye on it.
Most cryptos have a similar cycle style.
Meaning the altseason might have just set off with the BTC Dominance dropping.
Any likes, boost, and share with your people its appreciated!
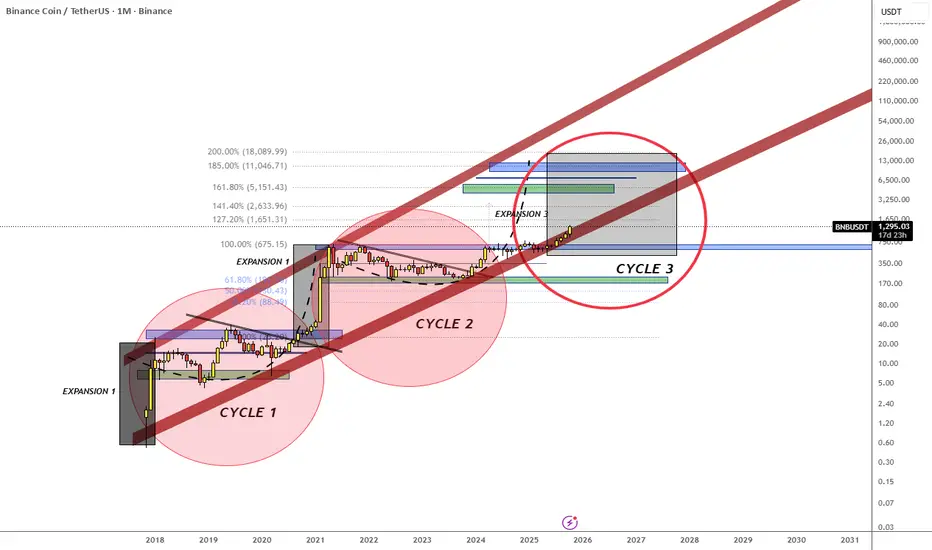
BNB/USDT - STARTING CYCLE 3BNB has started its third expansion cycle 3.
If history repeats again, we could see BNB between 5,000$ - 11,000$ with an average price of 7,000$ aprox.
Monthly Chart so updates will be slow. Just keep an eye on it.
Most cryptos have a similar cycle style. BNB is the first altcoin starting the cycle.
Meaning the altseason might have just set off with the BTC Dominance dropping.
Any likes, boost, and share with your people its appreciated!
DGBUSD - DigiByte, the Hidden GemThis is an idea based on the DGBUSD chart 1W log using Fibs levels and Bars Patterns.
DigiByte is known as the most decentralized coin on the market. Open Source, better tech than Bitcoin, smart contracts, decentralized applications and secure authentication, make DGB a True Gem.
Rumors about the incoming DigiDollar stable coin and years of accumulation could skyrocket soon the demand. DigiByte is ready for a 100-200x
This is not a financial advice. Do Your Own Research

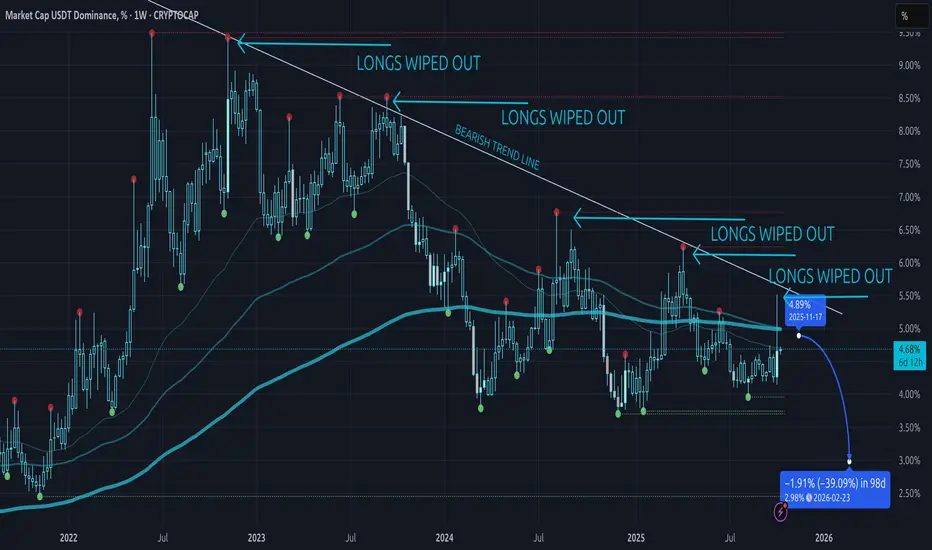
USDT.D Lower High Again — Why I’m Still Bullish on AltsQuick take: the weekly downtrend in USDT dominance is intact. We keep respecting the same descending trendline that starts at the Nov 7, 2022 peak, then tags Sep 11, 2023 → Aug 5, 2024 → Apr 7, 2025 → Oct 6, 2025. Every touch has printed a lower high. Price is still below the weekly 200 EMA (see the thick cyan line on the chart), which keeps the high-timeframe bias pointed down for USDT.D—and by extension, up for BTC/ETH/altcoins, because USDT.D typically moves inversely to the crypto market.
The part that matters to me is how liquidity spikes on CRYPTOCAP:USDT.D have behaved. On Aug 5, 2024, we swept the prior highs and then bled lower for roughly ~168 days, about ~45% down from that spike. On Apr 7, 2025, same story: a sharp markup and then a ~36% markdown after the sweep. Today we’ve done it again—another wick into the trendline, another lower high, and we’re still trading under the 200-week EMA. That combo has consistently led to multi-week declines in dominance.
Short term, after last Friday’s deleveraging and thin books, I’m not pretending to know every intraday zigzag. But on daily/weekly, the picture hasn’t changed: we cleaned the prior highs, failed at the trendline, and are sitting around the mid-4% zone with momentum fading under the EMAs. My base case is chop under the line and then a push lower toward the ~3% area (marked on the chart). If that plays out, it’s exactly the sort of backdrop that’s fueled alt rallies in the past as stablecoins rotate into risk.
What would make me reconsider? A meaningful refill of the wick and acceptance back toward ~5.5% with a weekly close above the trendline and the 200 EMA. Until I see that, I’m treating last week as a de-leveraging spike before higher for crypto broadly, not the end of the cycle. I’ll be watching the next 30 days: hold under the line and roll over, and I like the odds we slide toward 3%—which, historically, has lined up with strong legs up in BTC, ETH, and the better alts.
XAU/USD 13 October 2025 Intraday AnalysisH4 Analysis:
-> Swing: Bullish.
-> Internal: Bullish.
Price has recently potentially printed a bullish iBOS. This is potential as H4 candle is open. Confirmation will be once the candle is closed, however, currently, depth of pullback is insignificant relative to recent price action, therefore, I will again apply discretion and not classify this as an iBOS, however, I have marked this in red.
Intraday expectation:
Price to print bearish CHoCH to indicate bearish pullback phase initiation. Current bearish CHoCH positioning is denoted with a blue horizontal dotted line
Note:
The Federal Reserve’s sustained dovish stance, coupled with ongoing geopolitical uncertainties, is likely to prolong heightened volatility in the gold market. Given this elevated risk environment, traders should exercise caution and recalibrate risk management strategies to navigate potential price fluctuations effectively.
Additionally, gold pricing remains sensitive to broader macroeconomic developments, including policy decisions under President Trump. Shifts in geopolitical strategy and economic directives could further amplify uncertainty, contributing to market repricing dynamics.
H4 Chart:
M15 Analysis:
-> Swing: Bullish.
-> Internal: Bullish.
Price has printed printed according to my analysis dated 09 October where I mentioned price to trade down to either discount of 50% EQ, or M15 supply zone before targeting weak internal high priced at 4,059.350.
Price has printed a further bullish iBOS.
We are now trading within an internal low and fractal high. CHoCH positioning is denoted with a blue horizontal dotted line.
Intraday expectation: Await for price to print bearish CHoCH to indicate bearish pullback phase initiation.
Note:
Gold remains highly volatile amid the Federal Reserve's continued dovish stance, persistent and escalating geopolitical uncertainties. Traders should implement robust risk management strategies and remain vigilant, as price swings may become more pronounced in this elevated volatility environment.
Additionally, President Trump’s tariff announcements, particularly against China, are expected to further amplify market turbulence, potentially triggering sharp price fluctuations and whipsaws.
M15 Chart:

$BTC / Global Liquidity Acceleration with Business Cycle Today’s PA confirmed an interesting theory I’ve had where liquidity reaches risk assets faster as the business cycle picks up.
I wrote about this in depth in my “Twin Peaks” cycle top thesis (pinned tweet).
We were charting Total Global Liquidity with a 12-week lead against CRYPTOCAP:BTC before the rate cut in September, and then we got a 1-point higher reading in the ISM PMI, which I believe accelerated the liquidity cycle by a couple weeks.
I think for every 25 bps rate cut, we will see TGL accelerate by 2-weeks.
The next rate cut is expected at the October 29th FOMC.
It will be interesting to track liquidity flows and the ISM PMI after the next rate cut to see how they adapt to markets.
The GOLD / BTC chart confirms this acceleration, as GOLD typically has a near 1:1 ratio with TGL.
I was one of the first analysts to point out this signal earlier in year before all your favorite large accounts ran with it (go figure).
This acceleration in TGL would mark our local bottom near perfectly.
If this theory is correct and liquidity does accelerate by another 2 weeks, based on TGL, we would have the cycle’s first top somewhere around November 11th.
Currently it’s the 25th with a 10-week lead.
That would coincide with my OG ₿itcoin cycle analysis that I put out over 1.5 years ago, where I said the cycle top would be between OCTOBER 6th, which was already a local top, and NOVEMBER 9th.
However, there is a discrepancy with the GOLD / BTC chart. The local top would be around December 3rd. It’s currently the 17th with a 10-week lead.
I think GOLD has overshot TGL simply based on bull market mechanics creating a parabola.
To sum it up, stay vigilant over these next few months, and take nothing for granted.
The first peak will for sure come sooner than you think.
Going to be fascinating to follow these liquidity flows, at the very least.

SEIC / SEI Investment / Fractal inspired seasonal LONG ScenarioRoundabout 21th of september SEIC should show upside.
My fractal analysis suggests a ling entry from that marked area of price.
From there I suggest to take at least partial profit when 9-10% are reached or time reached 5th or deceber.
Some weakness end of october until early november may give a change to add to the position.

RENEWED US-CHINA TRADE TENSIONS COULD DRAG S&P500 TO ITS MEANWith renewed trade tensions between the US and China creating market uncertainty, the S&P 500 could be pushed significantly lower. The key support level to watch is the 6255 - 6468 range (1), which may act as a buffer. A break below this level could accelerate the move down toward the Feb - Apr 2025 monthly pullback zone (2). In either scenario, this volatility could cause a repricing of many stocks toward their perceived fundamental values.
N.B!
- ES! price might not follow the drawn lines . Actual price movements may likely differ from the forecast.
- Let emotions and sentiments work for you
- ALWAYS Use Proper Risk Management In Your Trades
#S&P500
#nasdaq
#nyse

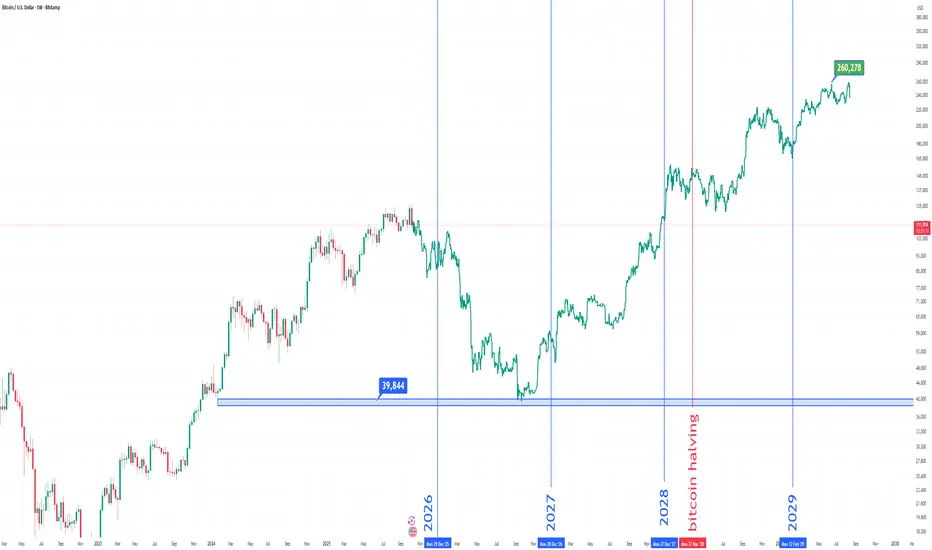
Bitcoin Roadmap Until 2029 | Halving Cycle ProjectionThis analysis illustrates Bitcoin’s potential price trajectory through the upcoming halving cycle.
Key Support Zone: 39,800 – 40,000 USD
Halving Date: 2028
Projection: Historical cycle patterns suggest a potential continuation toward 250K–300K USD range before the next major correction.
Mid-term Correction Expectation: Around late 2026 to 2027 before the next bullish expansion.
🔹 Based on past halvings, each cycle tends to follow a 12-18 month accumulation, parabolic rise, and correction phase.
🔹 Long-term investors might focus on accumulation near the blue support zone.
#Bitcoin #BTCUSDT #CryptoAnalysis #HalvingCycle #SmartMoneyConcepts
روند احتمالی بیتکوین تا سال ۲۰۲۹
در این تحلیل، چرخهی بعدی هاوینگ بیتکوین در سال ۲۰۲۸ و ناحیهی حمایتی مهم در محدودهی ۳۹٬۸۴۴ دلار مشخص شده است.
بر اساس الگوهای تاریخی، انتظار میرود پس از اصلاح میانمدت بین سالهای ۲۰۲۶ تا ۲۰۲۷، روند صعودی بزرگ بعدی آغاز شود که میتواند بیتکوین را به محدودهی ۲۵۰ تا ۳۰۰ هزار دلار برساند.
🔹 دورهی هاوینگ معمولاً با فازهای زیر همراه است:
۱️⃣ انباشت (۱۲ تا ۱۸ ماه قبل از هاوینگ)
۲️⃣ رشد پارابولیک
۳️⃣ اصلاح چرخهای
#Bitcoin #BTC #تحلیل_بیتکوین #Crypto #Halving #TradingView #farhadlotfizad
Bitcoin 130,000 – Correction AheadBitcoin
Around the $130,000 level, there is a possibility of a deep correction toward the $74,000 zone.
Do not panic, and do not get carried away by emotions.
This is the market — it plays with your psychology.
The market is geometric. BYBIT:BTCUSDT
