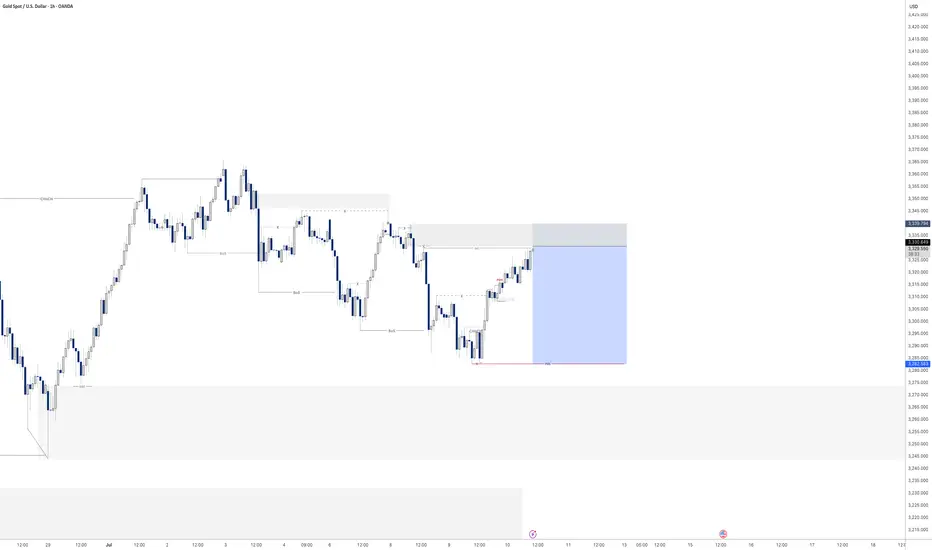
Gold - Sell inboundGold is looking very promising for another sell off. we are already showing signs that price has intent to move lower with some lower timeframe break of structure.
Just waiting for a manipulation now of the most recent highs put in before price moves lower.
Let's see if we get an entry tonight.
Fractal
BTC is on track!This is what four month for Bitcoin can look like and you really think 230k in October 2025 is far-fetched?? You better rethink that.

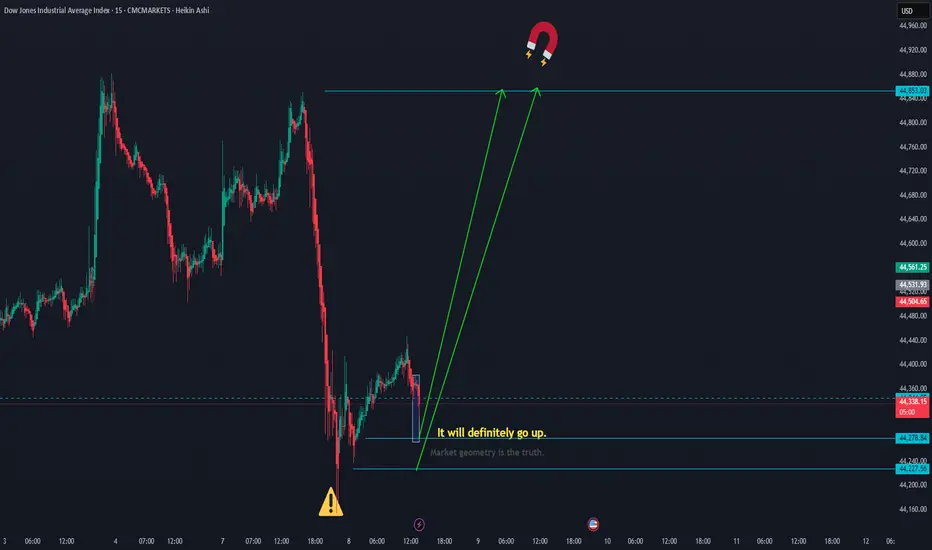
The dowjones should move upThe Dow Jones should move up to 44,853.
The levels 44,278.84 and 44,227.56 are good potential points for a bullish reversal. CMCMARKETS:US30

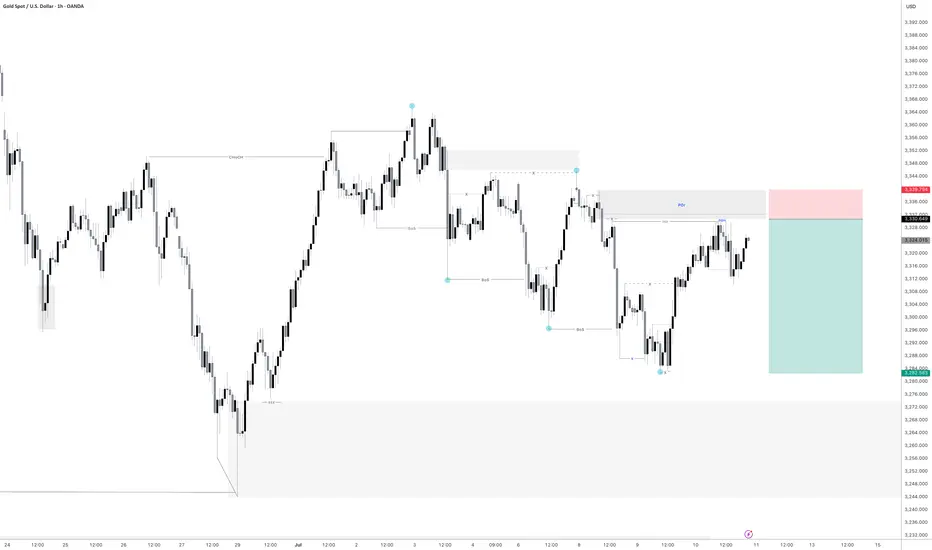
Gold - Sell before longer term buyLooking at gold we are a matter of a few pips away from entry. looking to play gold down till our larger 4H area of demand seeing as we have had a CHoCH to the upside.
There for i will be looking to take my sell position down to 3283.5 at a bare minimum as it was the previous structure level in which we turned around.
Lets see if we get tagged in. If not i will jump down to the lower TF and see if we can get a confirmation that price is going to turn from here.
Dogecoin Will Shock Investors With Its Next Move!Today I’m doing an in-depth analysis of Dogecoin and its market cycle in comparison to the early Bitcoin cycles. As you can see, the same human psychology and emotions are playing out in the Dogecoin market that we previously saw with Bitcoin. With mass adoption coming to the cryptocurrency markets, it’s very possible we’ll see a parabolic run on Dogecoin similar to what we saw with Bitcoin in 2016 and 2017. This could lead us to a new all-time high.
Because markets are fractal in nature, we see similar patterns appearing over and over again. If you can learn to understand and identify these cycles and patterns, you can position yourself for maximum profit. I see Dogecoin running very bullish through the rest of 2025, and it could also continue into 2026 as mass adoption drives increasing demand for cryptocurrencies. In fact, we could see the entire crypto market run all the way into 2029, as the stock market is also primed for a large parabolic move in its own cycle.
Stocks and crypto are heavily correlated since both are tied to the global economy. Contrary to popular belief, the world economy may actually be set up for a massive run in value—almost like a “Roaring 20s 2.0.” This means buying Dogecoin today could be like buying Bitcoin in early 2016—the opportunity for profit is enormous.
As always, stay profitable.
- Dalin Anderson

USOIL: Historic Full CyclesResearch Notes
Documenting historic examples of fractal loops for future references and research.
Fractal full cycles
70's; 80's; 90's
Late 90's & Early 00's
00's
10's
10's & 20's

$AAPL: Multi-Cycles At PlayResearch Notes
Documenting New Interconnections
Wave properties:
3rd frame of reference
Multi-Cycles
Fibs of broader cycle
Using coordinates of the recent established cycles for predictive/guiding properties:

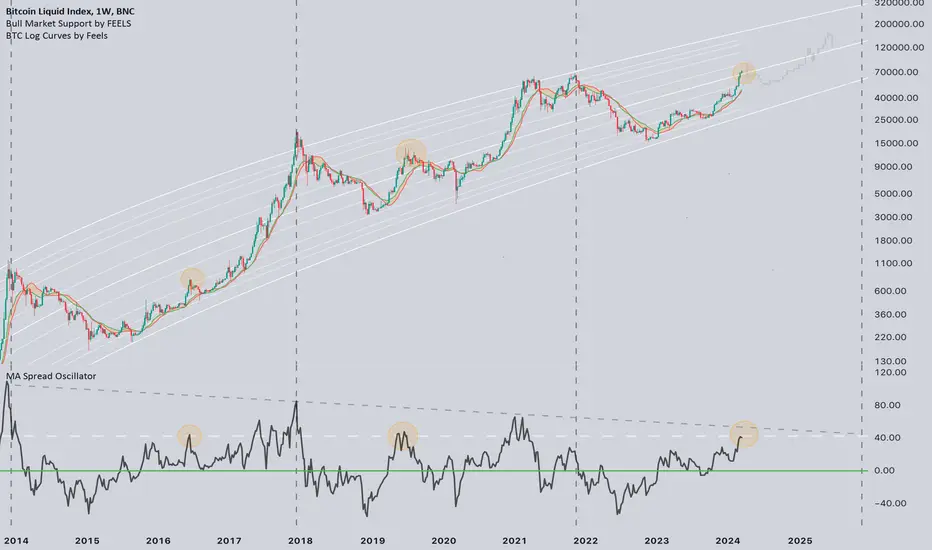
BTC reached the local peak? 👀#Bitcoin distance from BMS
Below is the oscillator, which shows how far the price has moved away from the bull market support. Mostly when we are in the 2-3 year of the cycle, the mark on the oscillator 40 acts as resistance, which indicates a mid-cycle peak.
Can it be different this time?🤔
Let's imagine that the CRYPTOCAP:BTC ETF inflow will be greater and distort the situation, in this case, we have a second trend line that indicates a global peak, which, by the way, becomes lower every cycle, now this mark is around ~50 on the oscillator or 80k on the price chart. You can consider this mark a best-case scenario for a local peak.
💡Remember, a good investor does not rely on one scenario but is ready for any.
Copper LongsBullish Bias for copper. Looking for daily BPR target, then possibly relative equal highs.
Ideally would like to pair a bullish weekly profile with longs. If the week opens lower first and delivers to a key level, thats favoring longs. So looking for Monday, Tuesday or Wednesday to create the low of the week.
I see a daily MMBM in play. Price expanded off the breaker block. If bsl is the dol, price should expand hard of EQ of the range.

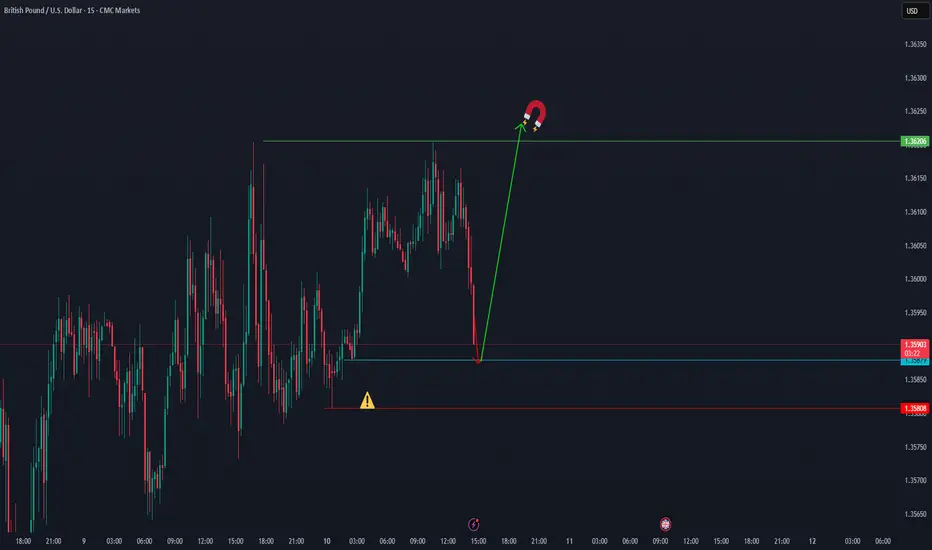
GBPUSD - 2 potential selling opportunitiesLooking at GBPUSD
We have 2 potential selling POI's.
The first one being a point in which we will need to sit on our hands for a little bit to see what price does at there is no inducement in the push down in the impulse leg. With that being the case we will need to see some sort of inducement built before we enter that POI
IF we clear the first POI I think I will take a more aggressive entry on the secondary POI that sits a little bit higher. This is due to us having already put in some sort of liquidity in and around that POI before pushing lower.
Will wait and see what happens.
Tomorrow could be a very good trading day

Bitcoin: Integration of Major BottomsUpdating former discovered connection from closeup.
Covid Low - 2022 Bottom
Using direction for fib channels

TSLA: Triangle PatternResearching the market through structural lens, particularly the topology of trapped liquidity buildup and compression of volatility, that leads to a proportionally heavier move once a breakout occurs.
Raw compression area derived from waves of higher degrees (2nd, 3rd)
The longer price consolidates within boundaries of a triangular formation, the more significant the breakout tends to be.

Gold sell off before continuation higher? Pending order set on this one before bed
Will see what develops overnight

EURUSD - Potential sell at LDN or NY openLooking for sell from the POI highlighted
We have raided buy side liquidity so now its time to look at the origin of the move and see if we can further capitalise on a similar set up I took yesterday in order to bank a lovely 8.5% profit on this single trade.
Will post the trade below

USDCHF - Potential downside incominglooking at UCHF we have just swept a level of liquidity.
We have had a Change of Character on the 15min to the downside and left a nice inducement / liquidity level alongside a nice FVG that has left a nice bearish orderblock
Once the spreads calm down I will set my pending order on this level and hope to be tagged into this position.
Due to the time it will be a reduced risk entry as I won't be able to manage the trade during the night.

DOGEUSDT Buy Long SetupWait for entry, if the tp hits first, then ignore the trade, I will share new entry.

GOLD - POTENTIALLooking at gold. Its still in a bit of limbo after the NFP reaction on Friday. However it is looking like the draw on liquidity is higher. Therefore my bias on gold for the start of the week is bullish so will be looking to get the most optimal entry to take some buys to the upside.
If we can manage to find a decent enough move price really could rally upwards.

DOW Jones go upCMCMARKETS:US30
Reaching the price level of 45,082.74 is inevitable. From the current closing price, there is a high probability of continuation toward the ATH.
However, the price levels 44,440 and 44,344.95 are also acceptable zones from which the move toward 45,082.74 may begin.
At the start of the upcoming week, as soon as the market opens, we are likely to move toward the ATH from one of these three levels.

SP500: Fib Channels on Fractal Corridors Research Notes
Testing angle of trendline which acts as support then defines resistance.
Structural reference
Pattern expressed in Fibonacci:
Ascending:
Descending:
Fib Channels on Fractal Corridors supposed to show alternative mapping method which differs from following approach.

EURUSD - Where next?Looking at EURUSD
I still feel like we are due some sort of deeper retracement to the downside considering how bullish the 4H and Daily time frame have been in recent times.
Although the market does not care how I feel in all honesty haha. I will play the short term short until the 15min orderflow switches bullish once again.
The expansion that is currently happing right now is very interesting and makes a good watch to see what we will do come market open as we are engineering liquidity for both a buy and sell with both POI's looking primed for entries.
Will be keeping a close and keen eye on EURUSD when the market opens
Any questions feel free to give me a message

