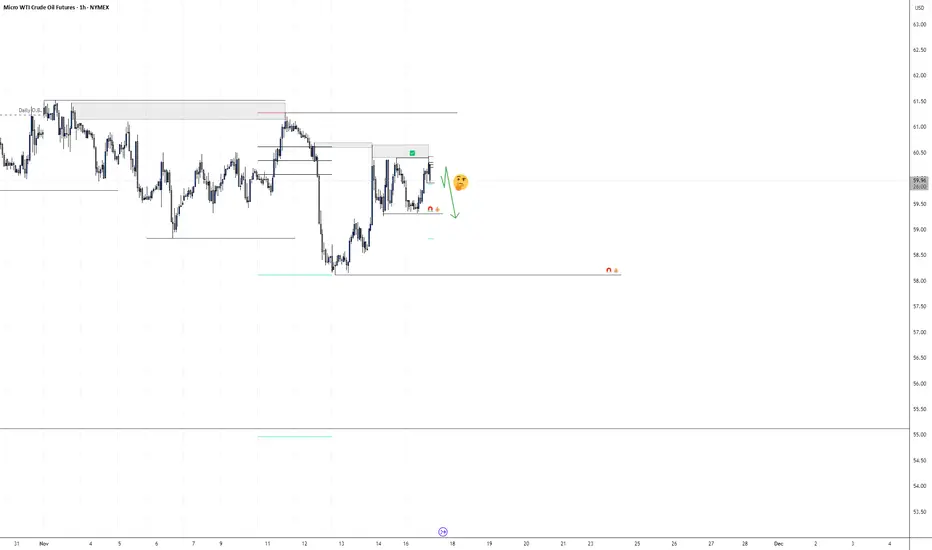
Institutional Order Flow MCl1!Institutional order flow on MCL1! is showing a draw on liquidity with relative equal lows near 55 - 55.5 pricing.
Dropping down to the lower time frame the swing structure holds true and is pointing at lower prices in the near future.
We're looking for entries on the lower time frame and following the fractal trend within the Daily.
Waiting for confirmations, it looks like today will be a bearish day with the nearest target of 59.31
As always, wait for a confirmation entry, and hold small running positions for if we get deeper profits.
Fractal
EURUSDEURUSD is at 1.15939
It has the potential to move towards 1.16152
The critical price level is 1.15797

ES1 outlookES/NQ Outlook – Bearish Continuation
Bias: Shifted from early Bullish/Neutral to bearish once ES failed to confirm NQ strength. Correlation cracks lined up with the broader sell-off trend.
Macro Sentiment:
Risk sentiment remains shaky — Bitcoin pushing toward 93K,recovering from gov-shutdown and no data releases, and inconsistent tech strength keep pressure on indices. Underlying tone remains defensive.
⸻
Market Structure
• ES failed Friday’s Value High and rotated back below Friday’s POC.
• Now holding under POC, confirming sellers remain in control.
• Last session’s Value Low target still untested → unfinished business below.
⸻
Key Downside Targets
• PDL: 6,778
• Friday VAL: 6,725
• Main unfinished target: 6,666.5 (untouched value level)
⸻
Plan Going Forward
• Bias stays bearish while ES remains below Friday’s value high/poc but seeing interaction with week open.

XAU/USD 17 November 2025 Intraday AnalysisH4 Analysis:
-> Swing: Bullish.
-> Internal: Bullish.
Analysis and bias remains the same as analysis dated 20 October 2025.
Price has printed as per previous intraday expectation by printing a bearish CHoCH which indicates, but not confirms, bullish pullback phase initiation.
Price is currently trading within an established internal range, however, I will continue to monitor price with regards to depth of pullback.
Intraday expectation:
Price to continue bearish, react at either discount of 50% internal EQ, or H4 supply zone before targeting weak internal high priced at 4,380.990.
Note:
The Federal Reserve’s sustained dovish stance, coupled with ongoing geopolitical uncertainties, is likely to prolong heightened volatility in the gold market. Given this elevated risk environment, traders should exercise caution and recalibrate risk management strategies to navigate potential price fluctuations effectively.
Additionally, gold pricing remains sensitive to broader macroeconomic developments, including policy decisions under President Trump. Shifts in geopolitical strategy and economic directives could further amplify uncertainty, contributing to market repricing dynamics.
H4 Chart:
M15 Analysis:
-> Swing: Bullish.
-> Internal: Bullish.
As per analysis dated 14 November 2025, price has printed a bearish CHoCH to indicate, but not confirm bearish pullback phase initiation.
Price is currently trading within an established internal range.
Intraday expectation:
Price to trade down to either discount of 50% internal EQ, or M15 demand zone before targeting weak internal high, priced at 4,245.195
Note:
Gold remains highly volatile amid the Federal Reserve's continued dovish stance, persistent and escalating geopolitical uncertainties. Traders should implement robust risk management strategies and remain vigilant, as price swings may become more pronounced in this elevated volatility environment.
Additionally, President Trump’s tariff announcements, particularly against China, are expected to further amplify market turbulence, potentially triggering sharp price fluctuations and whipsaws.
M15 Chart:

ETHUSD – Bullish Continuation Setup1H Reversal → Now Looking for Expansion**
ETH just confirmed a clean shift from reversal into continuation, exactly the structure we expect after clearing liquidity and tapping a fresh demand zone.
1️⃣ Liquidity Grab Completed
Price swept sell-side liquidity beneath the recent range (classic ICT sell-to-buy behavior).
Smart money filled long positions → bullish narrative begins.
2️⃣ Breaker + FVG Retest
ETH returned to a micro Breaker Block + a small 1H FVG.
These zones overlap—confluence for continuation.
Price is now sitting right inside that region.
3️⃣ Alligator Compression (Bill Williams)
Alligator (blue-red-green) lines are compressing.
This is the “sleeping Alligator” phase → volatility contraction.
What comes next?
Expansion.
Direction of expansion = aligned with the higher-timeframe liquidity draw above.
4️⃣ Clear Draw on Liquidity Above
Closest upside magnets:
3,300 – 3,330 → inefficiency fill
3,641.7 → major liquidity + previous 1H distribution high
The model favors a move up to rebalance those imbalances.
My Trade Setup (1H Long)
Entry Zone:
🔵 3,160 – 3,200 (Breaker + FVG confluence)
Stop Loss:
🔻 3,020
(below last displacement low — invalidation)
Targets:
🎯 TP1: 3,300
🎯 TP2: 3,420 – mid-range imbalance
🎯 TP3: 3,641.7 (main liquidity draw)
Risk-to-Reward:
Solid continuation R:R from current structure
(as shown on the chart).

USDCHF LONG POSITION SETUPStrategy: SMC (MARKET STRUCTURE SHIFT)
We saw a reaction to a swing low and a break of structure to the upside.
💡 IDEA:
Possible bullish market to the dollar against the Swiss Frank.
SUPPORT ANALYSIS:
DXY (Dollar Index) showed weak bearish momentum on Friday after a reaction to a support level (demand zone).
ENTRY ⛔:
Enter at NEW demand zone w/ SL below the zone and TP at recent high.
WHY?
- A change of will mean 💰 price is too strong to print new lower lows below $0.79, therefore we target the previous highs as our raid of liquidity!
Goodluck to myself and ya'll!

Litecoin — “Stay Above Here” or It’s Just Another WickCRYPTOCAP:LTC has the potential to go much higher, but so far it’s mostly reacting, not expanding. The bounce is clean, the structure improved, yet we still haven’t seen the kind of follow-through that turns a squeeze into a real trend.
On my chart I’ve highlighted the decision zone — roughly $134–$140 where the HTF descending trendline and prior supply stack up. That’s the gate. I don’t want a tag-and-fade; I want to see acceptance and time spent above it. When price breaks a key area and holds, it signals intent, not just a stop run.
In the next sessions it’s all about confirmation: push into that band, volume step-up, shallow pullbacks that base above the box, and then continuation. If we get that, the path opens for a proper stair-step: $132 → $140 hold → $150s, and, later, $165–$170 as the next extension. That’s the blueprint drawn on the chart.
Zooming out, LTC/BTC on the weekly is compressing—tight ranges, repeated rejections fading in size, and no loss of the key floor. It’s the same slow build we saw before XRP’s break: absorption candles, “quiet” volatility, liquidity loading. These periods don’t last forever; when they resolve, the move is usually meaningful.
Short term I’ll still treat dips as tests of intent. If price rolls back into the old range and can’t stabilize above the breakout band, it tells us the market wasn’t ready and we’ll need more time. But if LTC can push through and stay above the highlighted zone, the character of the trend changes from reactive to expansionary — and the upside scenario comes alive.
TL;DR: The idea is simple — stay above $134–$140 and the door to $150 → $165–$170 swings open. Fail to hold it, and it’s just another wick.

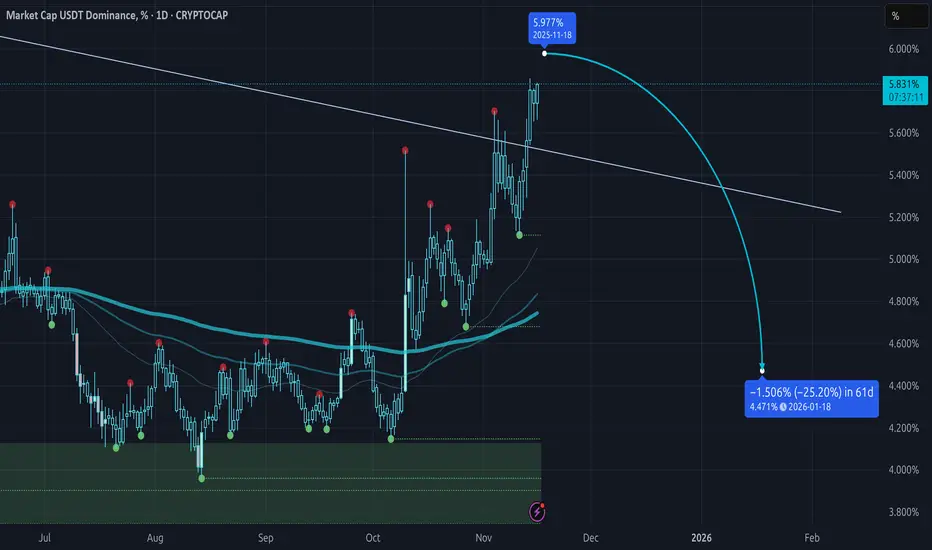
USDT Dominance is a metter of time....CRYPTOCAP:USDT.D is a mater of time that it reverses back to 4% area, and this time I suspect that liquidity will be rotating from Bitcoin into majors caps.
Few days left for the unwind.
If not, bear market starts and USDT.D goes back to 9%
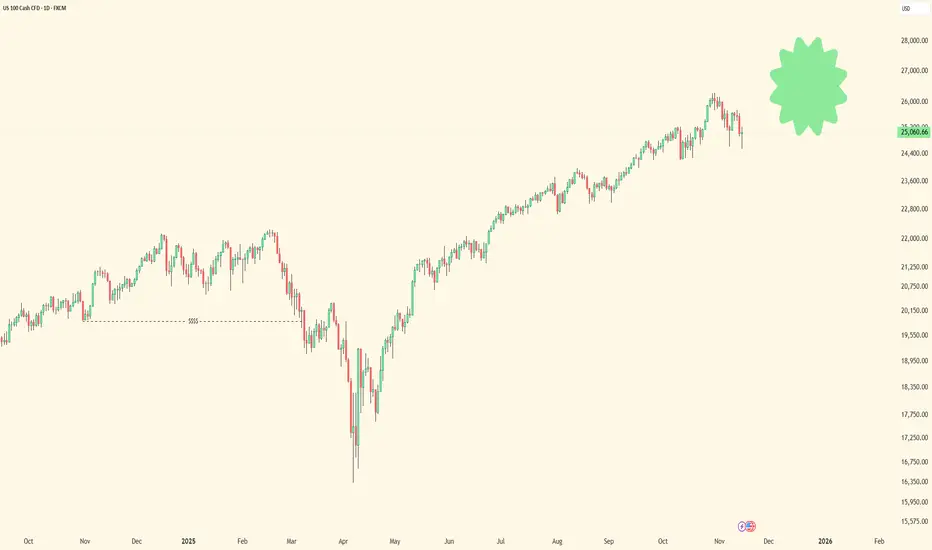
Market Update - RUT | BTCThis video looks at the underperformance of RUT compared to the rest of the markets including CRYPTOCAP:BTC where we could see a 50% drop as I compare it to 2021 fractals
We first need to see a pump around $88k and then go from there
TVC:RUT is clearly going through a Distribution phase that will Contract, and this is where we can see the rest of the markets follow through similar to Jan. 2025, and 2021 - 2022 fractal.
Expect stocks like NASDAQ:NVDA to retrace back to the downside, but will see it holdup pretty well
NASDAQ:TSLA on the other hand may see price fall back to its major Demand lvl as it has a few times already.

The Deeper Logic Behind Price Delivery (Nobody Talks About This)Most traders think some pairs are slow and others are fast.
But that belief is the reason they stay confused, lose trades, and can’t read delivery.
The truth is deeper, and once you see it, you can’t unsee it.
This is the real explanation behind timing, alignment, and phase delivery — the part nobody teaches.
Most traders think some markets “move fast” and other markets “move slow.”
That’s a surface-level observation. It sounds true, but it completely misses the deeper mechanics behind why price behaves the way it does.
The truth is this:
Markets don’t move fast or slow — markets move according to timing.
Every pair follows the same structural blueprint.
The only difference is where each pair is within its delivery cycle.
Price is always doing one of two things:
1. Delivering a continuation leg (impulsive, clean, fast movement)
2. Building the pullback leg (corrective, choppy, slower movement)
When a pair is fully aligned on the higher timeframe — when the trend, liquidity objectives, and structural breaks are all synchronized — the continuation phase will always look fast. It’s clean, directional, and decisive because the cycle is ready to deliver.
When a pair is still developing inducements, collecting liquidity, or forming the structure it needs for the next leg, it will naturally look slow or indecisive. Not because the pair is slow, but because the cycle is incomplete.
This is why one pair may be exploding while another is barely moving:
they’re simply in different phases of the same universal process.
Price is never random.
Price is never “lazy” or “weak.”
Price is simply obeying its timing.
Higher timeframes reveal that timing.
They show you:
• Whether continuation is ready
• Whether the pullback is still developing
• Whether liquidity has been engineered
• Whether the dominant leg is prepared to deliver
• Whether the cycle is aligned or still maturing
Lower timeframes only express what the higher timeframe already decided.
So the idea that “some pairs move fast and some move slow” is a misunderstanding. No pair is naturally fast or slow — every pair delivers exactly the same way, just not at the same time.
Fast movement = HTF alignment + continuation phase
Slow movement = HTF development + liquidity engineering phase
Once you understand timing, you stop comparing pairs by their speed and start reading them by their position in the cycle.
That’s when trading stops being guesswork and starts becoming recognition.
Because the deeper truth is simple:
Price isn’t unpredictable — traders are just unaware of what time it is.
-Do you view the market by timing or by “speed”?
Let me know — I read every comment.
#NAS100 #Education #SMC #MarketTiming #PriceAction #SmartMoney #Forex #Indices
History always repeats — that’s what trading is about !Hello Traders 🐺
Welcome back to another idea.
I think maybe you said to yourself that this idea could be a total madness :-)
But here is the truth — and we have to be honest with ourselves.
I know it sounds a little bit crazy to see a Skyfall from 96K all the way down to 34K , something around 60% !
But we’ve had similar situations so many times before.
Let me break it down for you, my friends 👇
As you can see on the Monthly timeframe , BTC is playing between two curves for almost its whole life.
Yes — looks interesting, and I think we can use it as a very clear map to avoid greed and fear , and control our emotions during the time, especially if you are not a day trader.
I think these two support and resistance curves are very valid because they formed on a high timeframe such as the monthly.
So what else can we see here?
If you pay closer attention to the chart, you’ll find that every time price hits the resistance line (the upper line of our curvy channel),
that was the top of the bull market.
But the interesting point here is:
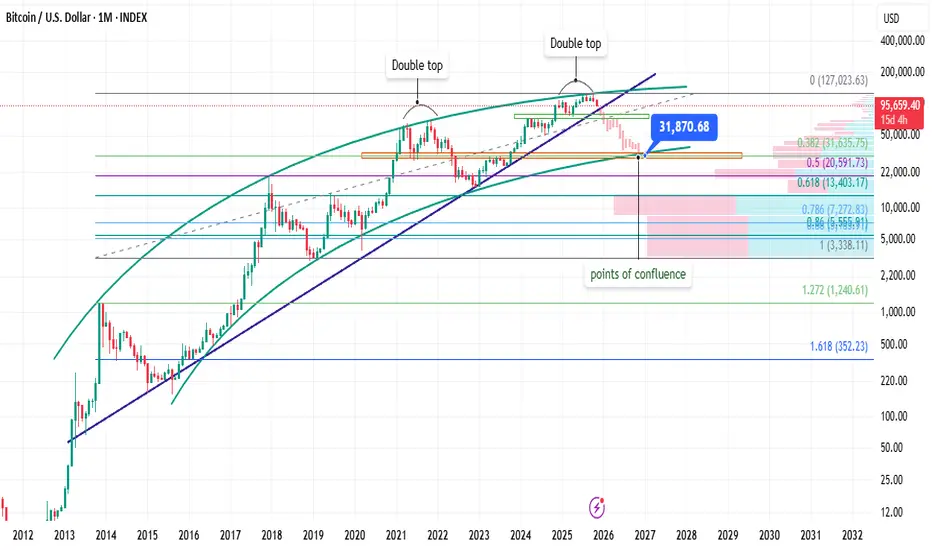
I am seeing a fractal pattern. Let me show you 🔍
If you go back to 21 November 2021 , you can see that price formed a double-top pattern, and the bear market officially started when price broke below the neckline of that double top.
Now here is the same twist:
We are very close to 21 November again :-)
And price is currently trying to hold above the support line of the double top pattern.
I think if we break below the neckline — which is around 75K —
with a high degree of certainty, BTC would fall straight to the next most important support level, which is 32K.
But why this level?
As you can see, at this level we have 3 points of confluence:
On the right-hand side of the chart, the Anchored VPVR shows a huge demand zone
This zone aligns exactly with the 0.382 Fibonacci retracement level
And the most interesting part: both areas perfectly match the support level of the curvy channel 📉
I think we must be honest in trading and always pay close attention to the warning signs.
This time is no different.
History will always repeat — and this is exactly what trading is about.
I hope you enjoy this idea 🙌
Please drop your comments below so we can share our thoughts together.
And as always remember:
🐺 Discipline is rarely enjoyable, but almost always profitable. 🐺
🐺 KIU_COIN 🐺
Gold — Liquidity Delivered Into WCL BreakerGold just tapped its higher-timeframe C target , completing the previous bullish cycle and leaving behind a clean WCL on the pullback. That WCL is now the boundary where the next phase should begin.
On the lower timeframes, price has been forming a controlled micro-bearish sequence. The important detail is that this micro-wave is delivering its C target directly into the 5-minute breaker block that's sitting inside the HTF WCL.
That combination is rare and powerful:
Liquidity has already been swept beneath the WCL
Momentum into the breaker is corrective, not impulsive
The breaker + WCL overlap is a classic launch zone
The next logical magnet is a revisit of the previous C
If Gold reacts from this breaker, the structure supports a full bullish wave back toward that C — and if C breaks, the matryoshka continuation opens.
I’m watching this zone as the potential ignition point for the next leg up.
This is not financial advice.

Gold: buyers defend the key demand zoneGold has reached the major demand zone at 4026–3993 — the same area where strong bullish reactions appeared multiple times in the past. The chart shows several reversal structures forming right inside this zone, while the price retests previous liquidity sweeps and a fair-value imbalance created before the last upward impulse.
Technically, gold remains inside a local descending channel, but the main focus is on the reaction from the demand zone. This level is supported by previous BOS signals, high-volume reactions and a clear accumulation base. EMA lines remain above the price, confirming the short-term bearish impulse, but zones like this often become the starting point for medium-term reversals.
Fundamentally, gold stays under pressure due to a strong USD and Fed expectations; however, macro-risks and safe-haven demand continue to prevent a deeper decline. If buyers hold 4026–3990, a recovery toward the major supply zone at 4210–4268 becomes highly probable.
Tactically: the main scenario is to look for confirmations to go long inside the demand zone. First target: 4170–4180. Main target: 4210–4268. If the zone breaks down, gold may head toward 3950.
If demand holds, the next impulse may come much faster than the market expects — gold often moves sharply once liquidity is collected.

Ethereum Trade IdeaThe recent volatility has pushed Ethereum and the entire altcoin market lower than expected, but this is exactly where disciplined traders find their edge. The setup on the chart shows a fresh order block with clear upside targets (TP1–TP4), offering a structured path for potential recovery. Stay focused, stay patient, and remember capital preservation is your strongest weapon. Only risk what you’re comfortable losing, trust your process, and let the market come to you. Smart risk management will carry you farther than any single trade.

BTC cycle top?BTC last 2 fractals from the ascending channel projected into the future. Both yellow and red fractals points at early Jan 2026 top around 133-135K. We have a Gann pivot date on 4th Jan, 2026 as an added confluence.

BTCUSDOur analysis is based on the weekly candle close. it closes below 107265, we can correct to the range below 92, then the power will return to the buyers.

EURUSD could dropA downward move in EURUSD could initiate from its current price range,
or from either the 1.16284 or 1.64500 levels. CMCMARKETS:EURUSD

XAU/USD 14 November 2025 Intraday AnalysisH4 Analysis:
-> Swing: Bullish.
-> Internal: Bullish.
Analysis and bias remains the same as analysis dated 20 October 2025.
Price has printed as per previous intraday expectation by printing a bearish CHoCH which indicates, but not confirms, bullish pullback phase initiation.
Price is currently trading within an established internal range, however, I will continue to monitor price with regards to depth of pullback.
Intraday expectation:
Price to continue bearish, react at either discount of 50% internal EQ, or H4 supply zone before targeting weak internal high priced at 4,380.990.
Note:
The Federal Reserve’s sustained dovish stance, coupled with ongoing geopolitical uncertainties, is likely to prolong heightened volatility in the gold market. Given this elevated risk environment, traders should exercise caution and recalibrate risk management strategies to navigate potential price fluctuations effectively.
Additionally, gold pricing remains sensitive to broader macroeconomic developments, including policy decisions under President Trump. Shifts in geopolitical strategy and economic directives could further amplify uncertainty, contributing to market repricing dynamics.
H4 Chart:
M15 Analysis:
-> Swing: Bullish.
-> Internal: Bullish.
As per yesterday's analysis, price has printed a bearish CHoCH to indicate, but not confirm bearish pullback phase initiation.
Price is currently trading within an established internal range.
Intraday expectation:
Price to trade down to either discount of 50% internal EQ, or M15 demand zone before targeting weak internal high, priced at 4,245.195
Note:
Gold remains highly volatile amid the Federal Reserve's continued dovish stance, persistent and escalating geopolitical uncertainties. Traders should implement robust risk management strategies and remain vigilant, as price swings may become more pronounced in this elevated volatility environment.
Additionally, President Trump’s tariff announcements, particularly against China, are expected to further amplify market turbulence, potentially triggering sharp price fluctuations and whipsaws.
M15 Chart:

USD/CHF – Building the LaunchpadAfter a clean impulse higher, USD/CHF is dipping right into the zone where demand was born — the BC + WCL overlap , sitting on top of the daily imbalance .
This area (around 0.7975 ) feels like the kind of zone where price takes a breath before the next leg.
As long as 0.7923 holds, I’m hunting for longs toward 0.8270–0.8300 .
That’s the HTF target and the last unmitigated supply area above.
If the zone cracks, I’ll let it go — no need to fight the flow.
Solid structure, clean logic, fair R:R. Let’s see if the launchpad fires.
Disclaimer: This post is for educational purposes only and does not constitute financial advice.

EUR/USD – The Rhythm ResetsPrice formed a clean A–B–C correction and tapped into the BC zone around 1.1570–1.1550 .
I’m watching this area for a possible reload — structure still bullish while 1.1539 holds.
Targeting the C extension near 1.1640 if momentum confirms.
If it breaks, I’ll wait for the next rhythm — no chase.
Disclaimer: This post is for educational purposes only and does not constitute financial advice.

BTC is going up BTC has the potential to rise from this its curent price of 98292
to 116551 , A key suport level to watch is at 92278. BINANCE:BTCUSDT

Corn butterfly Been bullish on corn 🌽 for a good while. This is long term harmonic pattern that made me that way. The bottom which recently occurred was marked by three distinct doji type candles. Really believe commodity supercycle is very close. Oil, corn , metals obviously 🙄.

XAU/USD 13 November 2025 Intraday AnalysisH4 Analysis:
-> Swing: Bullish.
-> Internal: Bullish.
Analysis and bias remains the same as analysis dated 20 October 2025.
Price has printed as per previous intraday expectation by printing a bearish CHoCH which indicates, but not confirms, bullish pullback phase initiation.
Price is currently trading within an established internal range, however, I will continue to monitor price with regards to depth of pullback.
Intraday expectation:
Price to continue bearish, react at either discount of 50% internal EQ, or H4 supply zone before targeting weak internal high priced at 4,380.990.
Note:
The Federal Reserve’s sustained dovish stance, coupled with ongoing geopolitical uncertainties, is likely to prolong heightened volatility in the gold market. Given this elevated risk environment, traders should exercise caution and recalibrate risk management strategies to navigate potential price fluctuations effectively.
Additionally, gold pricing remains sensitive to broader macroeconomic developments, including policy decisions under President Trump. Shifts in geopolitical strategy and economic directives could further amplify uncertainty, contributing to market repricing dynamics.
H4 Chart:
M15 Analysis:
-> Swing: Bullish.
-> Internal: Bullish.
Price did not print according to my analysis. Price instead targeted strong internal high by printing a bullish iBOS.
This could potentially indicate H4 bearish pullback phase is complete.
Price has since printed a couple of bearish CHoCH's, however, I will not mark them as such due to very insignificant depth of pullback.
Intraday expectation:
Price to indicate bearish pullback phase initiation by printing a bearish CHoCH. CHoCH positioning is demoted with a blue horizontal dotted line.
Note:
Gold remains highly volatile amid the Federal Reserve's continued dovish stance, persistent and escalating geopolitical uncertainties. Traders should implement robust risk management strategies and remain vigilant, as price swings may become more pronounced in this elevated volatility environment.
Additionally, President Trump’s tariff announcements, particularly against China, are expected to further amplify market turbulence, potentially triggering sharp price fluctuations and whipsaws.
M15 Chart:
