#GBPUSD short in profit.Currently still in #GBPUSD shorts but took most of the profits off the table; now I'm just managing my SL.
The less I trade, the better it goes. I don't have much time for scalping or day trading, so swinging is perfect for now but i hope this changes soon! #FOREX
Fractal

XAU/USD 29 October 2025 Intraday AnalysisH4 Analysis:
-> Swing: Bullish.
-> Internal: Bullish.
Analysis and bias remains the same as analysis dated 20 October 2025.
Price has printed as per previous intraday expectation by printing a bearish CHoCH which indicates, but not confirms, bullish pullback phase initiation.
Price is currently trading within an established internal range, however, I will continue to monitor price with regards to depth of pullback.
Intraday expectation:
Price to continue bearish, react at either discount of 50% internal EQ, or H4 supply zone before targeting weak internal high priced at 4,380. 990.
Note:
The Federal Reserve’s sustained dovish stance, coupled with ongoing geopolitical uncertainties, is likely to prolong heightened volatility in the gold market. Given this elevated risk environment, traders should exercise caution and recalibrate risk management strategies to navigate potential price fluctuations effectively.
Additionally, gold pricing remains sensitive to broader macroeconomic developments, including policy decisions under President Trump. Shifts in geopolitical strategy and economic directives could further amplify uncertainty, contributing to market repricing dynamics.
H4 Chart:
M15 Analysis:
-> Swing: Bullish.
-> Internal: Bearish.
As expected, price has printed a bullish CHoCH to indicate bullish pullback phase initiation.
Price is now trading within an established internal range.
Intraday expectation:
Price to continue bullish, react at either premium of internal 50% EQ or M15 demand zone before targeting weak internal low, priced at 3,886.456.
Note:
Gold remains highly volatile amid the Federal Reserve's continued dovish stance, persistent and escalating geopolitical uncertainties. Traders should implement robust risk management strategies and remain vigilant, as price swings may become more pronounced in this elevated volatility environment.
Additionally, President Trump’s tariff announcements, particularly against China, are expected to further amplify market turbulence, potentially triggering sharp price fluctuations and whipsaws.
M15 Chart:

XAU/USD 28 October 2025 Intraday AnalysisH4 Analysis:
-> Swing: Bullish.
-> Internal: Bullish.
Analysis and bias remains the same as analysis dated 20 October 2025.
Price has printed as per previous intraday expectation by printing a bearish CHoCH which indicates, but not confirms, bullish pullback phase initiation.
Price is currently trading within an established internal range, however, I will continue to monitor price with regards to depth of pullback.
Intraday expectation:
Price to continue bearish, react at either discount of 50% internal EQ, or H4 supply zone before targeting weak internal high priced at 4,380. 990.
Note:
The Federal Reserve’s sustained dovish stance, coupled with ongoing geopolitical uncertainties, is likely to prolong heightened volatility in the gold market. Given this elevated risk environment, traders should exercise caution and recalibrate risk management strategies to navigate potential price fluctuations effectively.
Additionally, gold pricing remains sensitive to broader macroeconomic developments, including policy decisions under President Trump. Shifts in geopolitical strategy and economic directives could further amplify uncertainty, contributing to market repricing dynamics.
H4 Chart:
M15 Analysis:
-> Swing: Bullish.
-> Internal: Bearish.
Price printed according to my analysis dated 22 October 2025 where I mentioned price to react at either premium of 50% internal EQ, or M15 demand zone, before targeting weak internal low priced at 4,004.280.
Price has printed a bullish CHoCH, however, depth of pullback was insignificant.
Price is now trading within an internal high and fractal low. CHoCH positioning is denoted with a blue horizontal dotted line.
Intraday expectation:
Await for price to print bullish CHoCH to indicate bullish pullback phase.
Note:
Gold remains highly volatile amid the Federal Reserve's continued dovish stance, persistent and escalating geopolitical uncertainties. Traders should implement robust risk management strategies and remain vigilant, as price swings may become more pronounced in this elevated volatility environment.
Additionally, President Trump’s tariff announcements, particularly against China, are expected to further amplify market turbulence, potentially triggering sharp price fluctuations and whipsaws.
M15 Chart:

$BYND: How a 'Special Salmon' Navigates a SqueezeThe Technical Landscape
The NASDAQ:BYND chart is speaking, and it is screaming.
What we are witnessing is a classic, high-velocity short squeeze—a market event driven by pure, raw emotion and mechanical positioning, not by a sudden, fundamental shift in the company's core health. This is a firestorm of short-seller capitulation and retail FOMO. The RSI, our measure of the market's breath, is hyperventilating at a reading above 95. The volume is climactic.
This is the fire. A limitless trader does not chase the fire. We observe it, we respect it, and we wait for it to reveal a new structure.
The Philosophy (The 'Special Salmon' Trap)
The current price action is the classic 'salmon' trap. Traders see the price rocketing and feel the biological, primal urge to swim upstream. They chase the move, fearing they will miss out. But they are swimming directly into the mouths of the bears and early longs who are ecstatic to sell their shares at a 1,000% profit.
That does not mean these waters are prohibited.
It simply means that your traditional salmon has a very low probability of completing their journey here. These rivers are patrolled by special bears. To navigate this, you must be a very self-aware, "special salmon."
This means: You understand this is not a value investment. You understand this is a high-risk, frenzy-driven, price-action gamble. You understand that position sizing is your only true defense. This is a trade for an exceptionally light, almost trivial, amount of capital—an amount you are fully prepared to lose.
An Illustrative Setup (The Patient Plan)
This is a plan of patience. It is not a call to action, but a map for a potential "what if" scenario. We are waiting for the fire to die down and for the price to return to a logical, structural zone of interest. We do not chase; we let the price come to us.
This plan is a high-risk, asymmetric bet on volatility, with a timeframe of days to weeks.
The Entry Zone: We are watching for a deep pullback to the ~ $2.28 zone. This is the area of interest, a potential structural support base. This is where we might consider entering the water. The Risk-Management Zone: The plan's "I am wrong" point is a "fuzzy" zone around ~ $0.43. This is our line in the sand. If this level breaks, the idea is invalid. The Profit Zone: The target is an ambitious, long-term zone around ~ $19.39, representing a recapture of a massive, old structural level and the full potential of this squeeze.
This setup defines the trade: a potential R:R of approximately 9.25.
This is about turning '$10 into approximately $100,' while keeping in mind that the '$10 could easily turn into $0.30.' This is a single piece of the puzzle, an exercise in risk-defined, patient speculation.
Disclaimer: This is not financial advice. It is for educational and informational purposes only. Please conduct your own research and manage your risk accordingly.

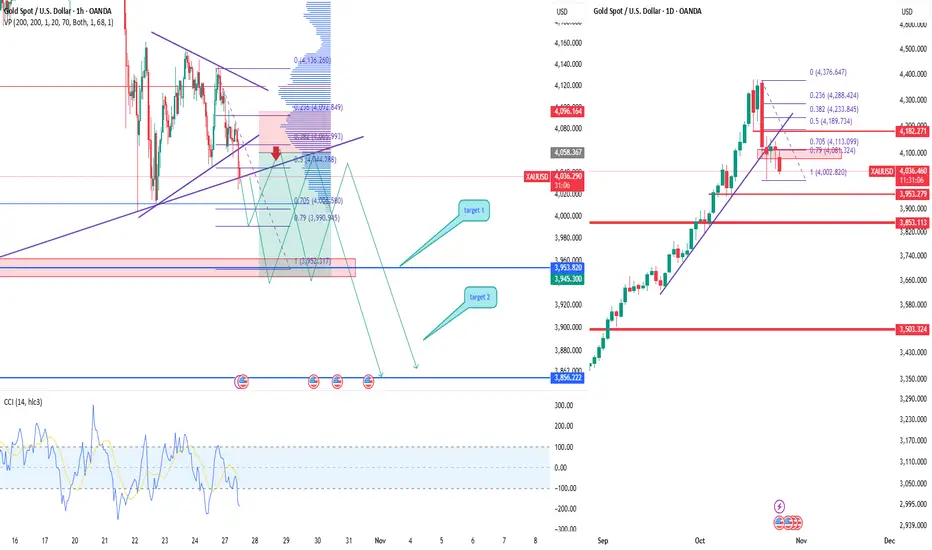
XAUUSD Gold testing support, correction possibleAfter a strong rally, gold entered a correction phase. Price broke the ascending channel and now trades around 4030–4050. The chart structure suggests a potential retest near 4070–4090 before continuation to 3960 (Target 1) and 3856 (Target 2).
CCI confirms weak buying momentum and volume profile shows high liquidity zones above current price — favoring a pullback.
Investors are taking profits after gold’s rally amid softer Fed outlook and possible dollar rebound. While long-term fundamentals stay bullish, short-term correction looks likely.
Sell setup from 4070–4090 zone with targets 3960 and 3856, stop 4110.
Valid while price remains below 4110.
XAU/USD 27 October 2025 Intraday AnalysisH4 Analysis:
-> Swing: Bullish.
-> Internal: Bullish.
Analysis and bias remains the same as analysis dated 20 October 2025.
Price has printed as per previous intraday expectation by printing a bearish CHoCH which indicates, but not confirms, bullish pullback phase initiation.
Price is currently trading within an established internal range, however, I will continue to monitor price with regards to depth of pullback.
Intraday expectation:
Price to continue bearish, react at either discount of 50% internal EQ, or H4 supply zone before targeting weak internal high priced at 4,380. 990.
Note:
The Federal Reserve’s sustained dovish stance, coupled with ongoing geopolitical uncertainties, is likely to prolong heightened volatility in the gold market. Given this elevated risk environment, traders should exercise caution and recalibrate risk management strategies to navigate potential price fluctuations effectively.
Additionally, gold pricing remains sensitive to broader macroeconomic developments, including policy decisions under President Trump. Shifts in geopolitical strategy and economic directives could further amplify uncertainty, contributing to market repricing dynamics.
H4 Chart:
M15 Analysis:
-> Swing: Bullish.
-> Internal: Bearish.
Analysis and bias remains the same as yesterday's analysis dated 22 October 2025.
Price has printed according to my analysis dated 20 October 2025 where I mention that price is to continue bullish, react at either premium of 50% internal EQ, or M15 demand zone, before targeting weak internal low priced at 4,185.910.
Price has printed a bearish iBOS and subsequently a bullish CHoCH to indicate, but not confirm bullish pullback phase initiation.
Price is now trading within an established internal range.
Intraday expectation:
Price to react at either premium of 50% internal EQ, or M15 demand zone, before targeting weak internal low priced at 4,004.280.
Note:
Gold remains highly volatile amid the Federal Reserve's continued dovish stance, persistent and escalating geopolitical uncertainties. Traders should implement robust risk management strategies and remain vigilant, as price swings may become more pronounced in this elevated volatility environment.
Additionally, President Trump’s tariff announcements, particularly against China, are expected to further amplify market turbulence, potentially triggering sharp price fluctuations and whipsaws.
M15 Chart:

BTC SHORT TERM RETRACEMENT 15MIN SETUP 📉 Short-Term Retracement in Play – BTC Update (ICT x SMC x Bill Williams)
We’re currently seeing a short-term bearish retracement after price tapped into a key resistance level. Here’s the confluence behind the move:
🔹 Perspective
Price traded into a premium zone, reacting off a previous swing high liquidity level.
A shift in short-term order flow is forming → lower timeframe shows rejection and displacement.
Clear inefficiency below (FVG) acting as a magnet for a corrective move.
🧩 SMC Confluence
Price tapped into a Supply Zone, causing a rejection wick – ideal for a short-term pullback.
Expectation Order Flow: after BOS on lower TF, price may draw down to mitigate OB + FVG below.
Target: 4H FVG zone for possible bullish reload if structure remains intact.
🐊 Bill Williams Confirmation
Alligator shows teeth separation narrowing → momentum slowing as price pulls back toward the balance zone.
A retracement into the Alligator lines would align with SMC mitigation levels for continuation setups.
✅ Plan
🔥 Trade Idea – SHORT SETUP
Levels
Entry: 115,600 – 115,850 zone
Stop Loss: 116,370
Take Profit 1: 115,000
Take Profit 2: 114,250
Risk-to-Reward: approx. 1:3 – 1:4 depending on entry execution.
This isn’t a higher-timeframe trend reversal — just a healthy retracement before potential continuation.
Watching for reaction at 4H FVG to see if bulls step back in for the next leg.
📍 Short-term shorts valid into imbalance… then we reassess for longs at key mitigation zones.

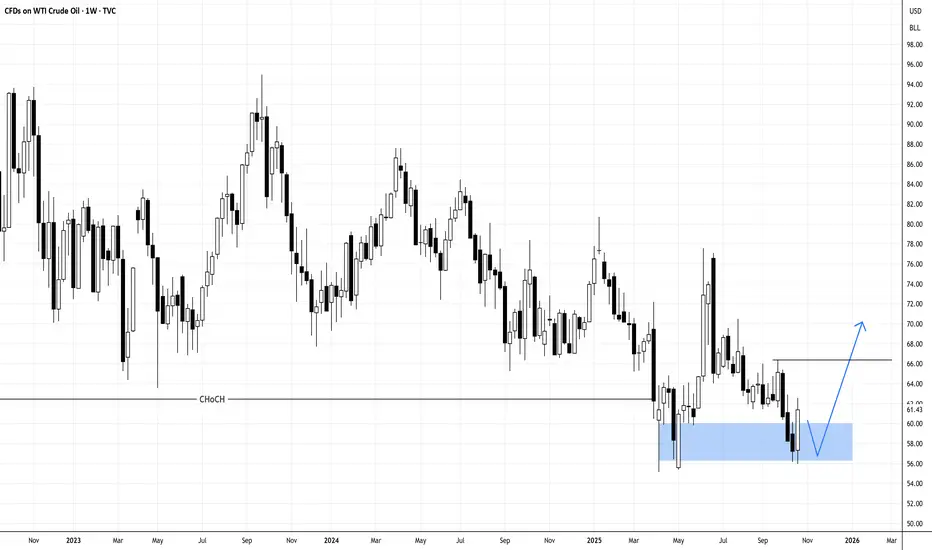
USOIL IN DOUBLE BOTTOM, MAYBE TARGETING ABOVE 66Oil may have found temporary bottom with the weekly double bottom.
N.B!
- USOIL price might not follow the drawn lines . Actual price movements may likely differ from the forecast.
- Let emotions and sentiments work for you
- ALWAYS Use Proper Risk Management In Your Trades
#usoil
#ukoil
ADA PENNANT CONSOLIDATION CHANNELADA is closing a very long consolidation triangle with massive upside potential that I’m guessing will correlate with the government opening back up and the ETFs all getting passed and upcoming rate cuts. 😎😎😎

$ETH cycle extensionPretty similar in terms of sentiments, momentum, price action and timeframe.
Many people are still sold to the idea of having a 4-year cycle, and believe that the top is already in or it must come in the next few months. But what if something similar to the post COVID dump happens and the current cycle does not follow your typical 4-year cycle but extends for another 6 months 🤔?
So far, it seems the macro conditions do support the potential setup with increasing crypto adoption, regulatory clarity and the easing of monetary conditions. In addition, many 4-year cycle believers probably have already derisked and if the market does not collapse like what they expect, then these money on the sideline could potential the narrative of an extended cycle.

SNCR flowing through the channelSNCR, expecting bounce from lower channel line through the upper to 7,60 . Then strong resistance area of 8.60s, if break out and continues for FVG then a new choch/SMC follows by new HHs.

Utilities vs S&P 500 — defensive spread for market extremesWhen markets reach phases of overvaluation and extreme concentration, we believe positioning in the Utilities vs S&P 500 spread (XLU/SPX) can make sense.
Looking back, in every correction of more than 20% in the S&P 500, the Utilities sector has outperformed — by margins ranging from +13% to +68%, depending on the severity of the selloff.
This spread acts as a defensive play, isolating sector risk and reducing exposure to market-wide drawdowns, while still participating in the broader market cycle.
Utilities tend to hold up better when:
Rates stabilize or decline.
Market breadth narrows to a few mega caps.
Risk-off sentiment starts to rise.
📈 We’re watching this spread closely at current levels.

Dxy follow upABCD extension with target PRZ. Pattern is projection alongside previous idea which will be linked below.
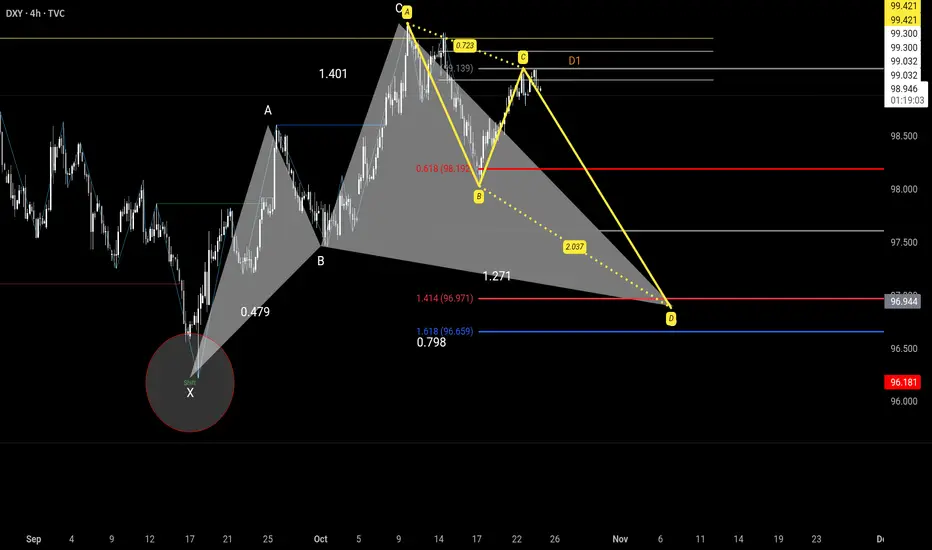
Btc Upside in the near term for bitcoin as dxy falls to bottom of range. Fib extension tools gives possible targets. Still not convinced btc goes vertical from here.

DXYDaily structure pointing to an easing of price action in the near term. 5 bar fractals providing the extremes of the range. The bullish Cypher is obviously incomplete and a guess. But the bottom of the range and the shift in sentiment needs to be revisited before any upside. The Cypher would give us the wyckoff spring and upside taking out highs on the way to 💯.

$GOLD LONG
### 🧠 **Market Context & Liquidity**
- Gold took out some sellside liquidty
- We’re watching for whether buyers hold above the daily open or if we see a pullback into support.
- Key levels to watch:
- **Resistance:** 4,128 – 4,130 (recent high)
- **Support:** 4,107 – 4,112 (consolidation low & potential buy zone)
---
### 🐊 **Bill Williams Alligator Signal**
- The **Alligator** is awake and aligned — jaws above teeth above lips — indicating a **trending market**.
- Price is trading **above the Alligator**, supporting a **bullish bias**.
- Pullbacks into the Alligator (lips/teeth) are potential entries if structure holds.
---
### 🎯 **Gold (GC1!) Trade Plan – Long Setup**
- **Entry Zone:** 4,110 – 4,128 (support + Alligator confluence)
- **Stop Loss:** Below 4,057
- **TP1:** 4,128
- **TP2:** 4,200 4hr fvg (sibi)
---
### ✅ **Confirmation Needed:**
- Bullish reaction off support with volume.
- No loss of 4,107 level.
- Alligator continues pointing upward.
---
**Bottom Line:**
Gold is in a bullish structure above the Alligator.
Look for longs into support with a tight stop.
Trade the pullback — not the breakout.

$AVAXUSD: Price Memory🏛️ Research Notes
Financial markets as complex adaptive systems that spontaneously organize themselves into critical, chaotic, or ordered states.
In this idea I'd like to focus on price memory - concept that the market's current and future price movements are influenced by its own history, rather than being completely random. The EMH argues that prices are a random walk, with no "memory" of the past. My research based on the FMH, explicitly rejects this notion. The very presence of fractal patterns (earlier works) is evidence that price changes are not independent of one another and that the market has a geometric memory of its own behavior .
Let's cut to the chase
Object of observation: LT Compression
I'm concerned with the properties of price dynamics that are preserved under continuous deformation, which allows to validate structure.
Extending the structure to uncover to which extent these recurring processes unfold in respect to historic measurements. (Made the gradient of breakout texture with neutral colors so it's not mistaken with me providing signals)

XAU/USD 23 October 2025 Intraday AnalysisH4 Analysis:
-> Swing: Bullish.
-> Internal: Bullish.
Analysis and bias remains the same as analysis dated 20 October 2025.
Price has printed as per previous intraday expectation by printing a bearish CHoCH which indicates, but not confirms, bullish pullback phase initiation.
Price is currently trading within an established internal range, however, I will continue to monitor price with regards to depth of pullback.
Intraday expectation:
Price to continue bearish, react at either discount of 50% internal EQ, or H4 supply zone before targeting weak internal high priced at 4,380. 990.
Note:
The Federal Reserve’s sustained dovish stance, coupled with ongoing geopolitical uncertainties, is likely to prolong heightened volatility in the gold market. Given this elevated risk environment, traders should exercise caution and recalibrate risk management strategies to navigate potential price fluctuations effectively.
Additionally, gold pricing remains sensitive to broader macroeconomic developments, including policy decisions under President Trump. Shifts in geopolitical strategy and economic directives could further amplify uncertainty, contributing to market repricing dynamics.
H4 Chart:
M15 Analysis:
-> Swing: Bullish.
-> Internal: Bearish.
Analysis and bias remains the same as yesterday's analysis dated 22 October 2025.
Price has printed according to my analysis dated 20 October 2025 where I mention that price is to continue bullish, react at either premium of 50% internal EQ, or M15 demand zone, before targeting weak internal low priced at 4,185.910.
Price has printed a bearish iBOS and subsequently a bullish CHoCH to indicate, but not confirm bullish pullback phase initiation.
Price is now trading within an established internal range.
Intraday expectation:
Price to react at either premium of 50% internal EQ, or M15 demand zone, before targeting weak internal low priced at 4,004.280.
Note:
Gold remains highly volatile amid the Federal Reserve's continued dovish stance, persistent and escalating geopolitical uncertainties. Traders should implement robust risk management strategies and remain vigilant, as price swings may become more pronounced in this elevated volatility environment.
Additionally, President Trump’s tariff announcements, particularly against China, are expected to further amplify market turbulence, potentially triggering sharp price fluctuations and whipsaws.
M15 Chart:

Bitcoin: Transitions ('25 - '26)Research Notes
In this research idea, I'll draw multi-scale interconnections to cover transitions ahead.
Price is at critical zone of compression (Longer Term)
Yellow curve covering local scope expansion, happens to align with that of a bigger scale. The rejection at higher levels makes up double top , after which price has corrected.
The drop justifies the use of linear extension to cover unviolated (yet) boundaries.
Publishing the interactive chart (6h TF) in order to document the intermediate market behavior within price-derived zones.

CORN BULLUsing daily market structure and an H4 pattern, alongside, daily CVD divergence I'm convinced corn breaks up towards 4.5 and beyond. THE BIGGER PICTURE which i will show below shows a rather large bullish bat harmonic. I have been long corn from below 3.8. Jump on don't miss the commodity super show.

$eth 15 min , new york setup 🧠 Session-Based Liquidity & Manipulation
Asia low was swept — liquidity grab confirmed.
Price is now stabilizing above the Alligator, signaling potential reversal.
🐊 Bill Williams Alligator Signal
Alligator is coiling and turning up — bullish awakening in progress.
Price holding above lips/teeth supports long bias.
🎯 Corrected ETHUSD Trade Plan – Long Setup
Entry Zone: 3,846 – 3,850 (retest of Alligator support)
Stop Loss: 3,777 (below recent swing low — as per chart)
TP1: 3,875 (first liquidity above)
TP2: 3,900 (next HTF level & Asia high)
✅ Confirmation Needed:
Bullish candle close above 3,850.
Hold above Alligator lips (~3,840–3,845).
Volume spike on the move up.
Bottom Line:
Asia low taken, manipulation complete.
Alligator supports bullish reversal.
Long above 3,846, stop below 3,777.
— origami_capita133 | TradingView
👉 Like & Follow if this helps your trading. Trade with discipline, not emotion.

XAU/USD 22 October 2025 Intraday AnalysisH4 Analysis:
-> Swing: Bullish.
-> Internal: Bullish.
Analysis and bias remains the same as analysis dated 20 October 2025.
Price has printed as per previous intraday expectation by printing a bearish CHoCH which indicates, but not confirms, bullish pullback phase initiation.
Price is currently trading within an established internal range, however, I will continue to monitor price with regards to depth of pullback.
Intraday expectation:
Price to continue bearish, react at either discount of 50% internal EQ, or H4 supply zone before targeting weak internal high priced at 4,380. 990.
Note:
The Federal Reserve’s sustained dovish stance, coupled with ongoing geopolitical uncertainties, is likely to prolong heightened volatility in the gold market. Given this elevated risk environment, traders should exercise caution and recalibrate risk management strategies to navigate potential price fluctuations effectively.
Additionally, gold pricing remains sensitive to broader macroeconomic developments, including policy decisions under President Trump. Shifts in geopolitical strategy and economic directives could further amplify uncertainty, contributing to market repricing dynamics.
H4 Chart:
M15 Analysis:
-> Swing: Bullish.
-> Internal: Bearish.
Price has printed according to my analysis dated 20 October 2025 where I mention that price is to continue bullish, react at either premium of 50% internal EQ, or M15 demand zone, before targeting weak internal low priced at 4,185.910.
Price has printed a bearish iBOS and subsequently a bullish CHoCH to indicate, but not confirm bullish pullback phase initiation.
Price is now trading within an established internal range.
Intraday expectation:
Price to react at either premium of 50% internal EQ, or M15 demand zone, before targeting weak internal low priced at 4,004.280.
Note:
Gold remains highly volatile amid the Federal Reserve's continued dovish stance, persistent and escalating geopolitical uncertainties. Traders should implement robust risk management strategies and remain vigilant, as price swings may become more pronounced in this elevated volatility environment.
Additionally, President Trump’s tariff announcements, particularly against China, are expected to further amplify market turbulence, potentially triggering sharp price fluctuations and whipsaws.
M15 Chart:

$BTC/USDT LONG 30MIN
📊 **BTC/USDT – Smart Money + Bill Williams Confluence**
**Bias:** Long 🟩
After a clean **sell-side liquidity sweep** below the old low,
Bill Williams’ **Alligator lines** are flattening—indicating consolidation before a potential expansion upward.
🎯 **Setup Details:**
* **Entry:** $108,150
* **Stop Loss:** $107,536
* **Take Profit:** $110,390
* **R:R:** ≈ 3:1
🔹Confluence: MSS + FVG + OB + Bill Williams Alligator reset
🔹Expecting expansion once price closes above $108,700
#BTC #ICTtrading #SmartMoneyConcepts #BillWilliams #CryptoAnalysis #PriceAction
