Nfp news setup Gold is holding above major support and respecting an ascending trendline. A bullish continuation is expected, with a breakout targeting 4590. NFP news may act as the catalyst for upward momentum.
Fundamental Analysis

GOLD: Bullish Wave Structure Points Toward Higher HighsGOLD: Bullish Wave Structure Points Toward Higher Highs
Gold is currently respecting a well-defined bullish structure on the 4 hours time frame.
The 4400 area acted as a key support and triggered a clean reversal.
The market is now developing a clear Elliott Wave sequence. The recent pullback toward the 4,400 support zone appears corrective (wave iv) rather than impulsive, suggesting a bullish continuation movement.
As long as gold holds above the 4,400 support, the bullish scenario remains valid. A quick upside reaction could first target 4,490, followed by 4,518. If bullish momentum accelerates, the higher resistance zone near 4,547 becomes the main upside objective.
You may find more details in the chart!
Thank you and Good Luck!
PS: Please support with a like or comment if you find this analysis useful for your trading day

GOLD - Correction and retest of support on a bullish trend FX:XAUUSD is forming a correction from the resistance level of 4500 and reaching a local low of 4415. Against the backdrop of DXY growth, the correction may continue. The market is awaiting economic news...
Mixed US data: JOLTS job openings fell to 7.146 million. ADP employment rose by 41,000. The ISM services index rose to 54.4, which is higher than expected.
Expectations for two Fed rate cuts in 2026 remain (≈61 bps). The fundamental backdrop is mixed, with additional confirming data needed.
Geopolitics supports demand: the US has confirmed negotiations on the acquisition of Greenland. China has imposed a ban on the export of dual-use goods to Japan. The focus is shifting to Friday's US employment report (NFP).
The correction in gold appears to be temporary amid continuing expectations of Fed policy easing and geopolitical tensions. The NFP report will be the decisive factor in determining the direction — weak data could trigger a new round of growth.
Resistance levels: 4442, 4475, 4497
Support levels: 4427, 4400
As part of the correction, gold may test the support zone of 4425-4400. Overall, the trend is bullish, and the market correction may be temporary. A false breakdown and the bulls holding the price above key zones could trigger growth towards the flat resistance.
Best regards, R. Linda!

Selena | XAUUSD – 30M | Market Structure & Demand ReactionPEPPERSTONE:XAUUSD FOREXCOM:XAUUSD
After rejecting from the upper channel resistance, XAUUSD entered a controlled pullback rather than a breakdown. The correction shows decreasing bearish momentum, suggesting sellers are losing strength while buyers are defending the demand zone. This behavior aligns with a healthy retracement within an overall bullish structure.
Key Scenarios
✅ Bullish Case 🚀
If price holds above the demand zone and shows continuation, upside targets remain active:
🎯 4,460
🎯 4,490
🎯 4,550 (HTF resistance)
❌ Bearish Case 📉
A strong breakdown and close below the demand zone would invalidate the bullish setup and open the door for deeper correction.
Current Levels to Watch
Resistance 🔴: 4,460 – 4,550
Support 🟢: 4,420 – 4,430 (Demand Zone)
⚠️ Disclaimer: This analysis is for educational and informational purposes only. It is not financial advice. Please conduct your own research before trading.

Scaling a small account is not a strategy problem It is a sequencing and behavior problem. Most traders assume that growth comes from new methods or more trades. The data shows that small accounts grow fastest when they remove the hidden tax that drains them: emotional sizing, poor invalidation placement, and trading inside volatility expansion instead of liquidity alignment.
The most common failure point is position size volatility. When volatility expands, candle ranges widen, liquidity thins, and invalidation distance increases. This is the worst moment to increase size, yet this is when most traders do it—after a streak of wins or boredom-induced impulsive entries. A small account does not fail because the market moved against it. It fails because it increased exposure when the market removed fuel.
Professionals scale differently. They anchor size when volatility expands and only scale when volatility compresses, liquidity is swept cleanly, and structure transitions. This shift protects capital durability first so compounding becomes mathematically possible second.
The framework begins with a volatility budget. Every asset has a typical invalidation distance on each timeframe. BTCUSDT and SOLUSDT behave with wider ranges than mid-cap pairs, and their liquidity pockets are tested more aggressively during overlap sessions. Your account must size exposure based on what the market historically allows a setup to absorb without forcing premature liquidation.
Liquidity mapping is the next step. Equal highs, equal lows, and inefficient consolidation clusters are not entry signals. They are incentives. Price moves there to transact, collect stops, and reposition larger capital. The first proof of intention is the sweep. Price breaches liquidity and reclaims back inside the swing. This tells you that breakout traders provided the orders, not continuation. A small account compounds faster when it waits for the sweep to finish rather than entering into it.
From there, structure must transition. In an uptrend, the market protects higher lows. In a downtrend, it protects lower highs. When price violates the last defended point after liquidity is taken, you have a control handover. This is not a guess. It is a behavioral change in price organization. But structure alone is still incomplete. It requires displacement.
Displacement is momentum proving participation. A structural break followed by thin, drifting candles is not authority. A structural break followed by clean directional movement is participation. This shows urgency from the opposing side. This is where narratives change and capital begins positioning for the next impulse.
The retest becomes the execution filter. Price returns to the broken or swept zone, interacts without hesitation, and respects the new bias built from liquidity and structure. The retest reduces invalidation distance, tightens risk, and improves reward asymmetry naturally without needing to increase leverage or complexity. The best retest is not the fastest one. It is the one that proved permission through sequence.
Micro-scaling compounds edge without compounding risk. Extracting 1–3% per trade on confirmed retests with 2.5:1 or better R:R compounds a small account more efficiently than trying to extract 10% during unconfirmed expansion phases. High-quality trades reduce mistake frequency, which matters more than win rate when capital is small and feedback is fast.
Time is also a filter. Crypto liquidity behaves differently by session. The most stable participation for BTC and SOL historically occurs during London–NY overlap, where bid depth is higher, sweeps are cleaner, and structural transitions show more authority. Dead-zone hours widen noise and compress clarity. Scaling requires knowing when participation is probable, not forcing participation when it is absent.
The final rule is process-first validation. A trade that works without a reason is not scale permission. A trade that works because it followed the sequence is. The market does not reward perfection. It rewards traders who stay calibrated to structure, volatility, and liquidity long enough to compound the value of participation when conditions finally agree.
Scaling is not about catching the entire move.
It is about surviving long enough to participate in the right side of the next move with defined risk and conditional exposure. Small accounts grow when traders stop scaling emotion and start scaling conditions.

Selena | BTCUSD – 30M | Demand Holding Inside Ascending StructurBITSTAMP:BTCUSD BINANCE:BTCUSD
Market Overview
After rejecting from the upper channel resistance, BTC corrected toward the mid-range demand area. The current reaction suggests buyers are defending this zone, keeping the higher-timeframe bullish structure intact unless the demand fails decisively.
Key Scenarios
✅ Bullish Case 🚀
If price continues to hold above the demand zone and respects the ascending trendline:
🎯 Target 1: 92,000
🎯 Target 2: 94,000
🎯 Target 3: 95,200
❌ Bearish Case 📉
A clean breakdown and close below 88,500 would invalidate the bullish structure and expose deeper downside toward the lower range lows.
Current Levels to Watch
Resistance 🔴: 92,000 – 94,000 – 95,200
Support 🟢: 89,000 – 88,500
⚠️ Disclaimer: This analysis is for educational and informational purposes only. It is not financial advice. Please conduct your own research before trading.

EURUSD Bearish Bias After Channel BreakQuick Summary
EURUSD is moving very slowly after breaking the bullish price channel, The bearish view remains valid and a retest of 1.17220 is possible before continuation lower
This level aligns with orderflow and a filled liquidity void which supports further downside
Full Analysis
EURUSD is currently showing very slow price action especially after breaking the ascending price channel
Despite this slow movement the bearish outlook remains intact and has not changed
Price may attempt a corrective move higher to retest the 1.17220 level
This area represents a strong reaction zone where price can respond after filling the liquidity void
After this level there are no major levels left for price to retest which increases the probability of bearish continuation
The 1.17220 zone also aligns with a strong orderflow area which can act as a strong supply zone for further downside movement
As long as price remains below the broken channel the expectation stays bearish

A retest framework is a processMost traders know support and resistance, but few have a rule set for when those levels become tradable. In crypto, levels are breached constantly. What matters is not the breach. What matters is what the market accomplishes by breaching it and how it behaves once it returns.
The framework starts by defining a clear swing high and swing low. These are the most recent meaningful extremes where price demonstrably changed direction, not intraday noise. The midpoint between them becomes equilibrium, your objective reference for premium versus discount within that swing. This midpoint is not predictive. It simply organizes the playing field.
Next comes liquidity. Equal highs, equal lows, and inefficient consolidation clusters are not decorations on the chart. They are incentives. Stops pool there. Traders position emotionally there. The market goes there to transact. When price moves into that pocket and leaves a wick that is quickly reclaimed, you have the sweep. This is the first proof that the breakout traders were the liquidity, not the beneficiaries.
A sweep alone is not structure. So the next requirement is transition. In an uptrend, buyers defend higher lows. When the last defended low is violated after a sweep, you get the break of micro-structure. In a downtrend, sellers defend lower highs. When the last supplied high is reclaimed after liquidity is taken below, you have transition in reverse. This is where narrative changes from continuation to rotation.
Then comes displacement. This is the market proving participation through momentum. A structural transition followed by compressed candle ranges or low-volume drift lacks authority. But a transition followed by clean directional movement shows that the opposing side stepped in with urgency. This is not retail FOMO. This is participation.
The retest becomes the execution filter. Price returns to the broken zone or swept liquidity level. It interacts there without hesitation, without sweeping back through the same side, and without expanding candle ranges against the narrative you built. This is where professionals position. Not because it is perfect timing, but because it is permissioned timing. The stop goes beyond the narrative fracture point, not a generic percent. The target goes toward the next liquidity incentive in line, not a vague R:R fantasy.
This sequencing matters even more inside funded evaluations. Prop traders fail most often when they cluster mistakes. A retest framework reduces mistake clustering because it forces the trade to form a story before it forms exposure. It narrows invalidation distance, improves average R:R, and protects daily drawdown math naturally. It also gives you neutrality after streaks. The framework does not amplify confidence.
It anchors confidence to conditions.
The retest framework does not promise that a trade works. It promises that a trade has a reason to work. And having reasons before exposure is the edge that compounds careers in crypto, especially when liquidity and volatility drain fast.

USDCHF: NFP in Focus as Price Pushes Higher From Range SupportUSDCHF: NFP in Focus as Price Pushes Higher From Range Support
The USDCHF has been moving within a range-trading pattern for a considerable time.
Whenever USDCHF tested the 0.7870 support area, it was followed by an aggressive upward wave.
The price tested this area in late December, and USDCHF is now rising further, as this pattern indicates.
The focus today is on the NFP data and according to the data the price will take direction.
However, even if the price moves down before or after the news, the chances are higher that USDCHF will continue the upward movement with a target near 0.8100.
You may find more details in the chart!
Thank you and Good Luck!
PS: Please support with a like or comment if you find this analysis useful for your trading day

GOLD Sell Pattern / NFP Gold at Daily Trendline Resistance – NFP Ahead
Gold is currently testing its daily trendline resistance. With today’s Non-Farm Payrolls (NFP) release on the horizon, market sentiment is cautious. Much of the groundwork has already been laid by the U.S. government, and expectations lean toward positive data. Should the numbers confirm strength, we may see corrective pressure on gold prices as investors adjust positions.

XAUUSD (H1) – Riding the bullish channelpatience before continuation ✨
Market structure
Gold remains in a well-defined ascending channel on the H1 timeframe. Despite recent intraday pullbacks, the overall structure is still bullish with higher highs and higher lows preserved. Current price action shows consolidation inside the channel rather than any sign of trend reversal.
Technical outlook (Lana’s view)
Price is rotating around the midline of the rising channel, indicating healthy digestion after the previous impulsive leg.
The recent pullback appears to be a controlled correction, likely aimed at collecting buy-side liquidity before the next expansion.
Market is still respecting structure and trendline support — no breakdown confirmed so far.
Key levels to watch
Buy-side focus
FVG Buy zone: 4434 – 4437
A clean reaction here could offer a good continuation entry within the trend.
Major buy zone: 4400 – 4404
This is the stronger demand area aligned with channel support and previous structure.
Sell-side reaction (short-term only)
4512 – 4515
This zone aligns with Fibonacci extension and channel resistance, where short-term profit-taking or reactions may appear.
Scenario outlook
As long as price holds above the lower channel boundary, bullish continuation remains the primary scenario.
A pullback into FVG or the lower buy zone followed by confirmation would favor another push toward channel highs and liquidity above.
Only a clean break and acceptance below 4400 would force a reassessment of the bullish bias.
Lana’s trading mindset 💛
No chasing price near resistance.
Let price come back into value zones inside the channel.
Trade reactions, not predictions.
Trend is your friend — until structure says otherwise.
This analysis reflects a personal technical perspective for educational purposes only. Always manage risk carefully.

XAUUSD (H3) – Liam Plan Trendline break confirms the uptrend ✅ | Buy the discount, scalp-sell at ATH
Quick overview
On the H3 chart, the story is clean: price has broken the bearish trendline and held structure after a clear BOS, which keeps the bias bullish for continuation.
But the best execution is still the same: no FOMO. I’d rather buy from discount liquidity zones than chase mid-range candles.
Key Levels (from your chart)
✅ Buy Zone 1 (re-buy): 4434 – 4437
✅ Buy Zone 2 (liquidity imbalance): 4340 – 4343 (deep sweep zone)
✅ ATH Sell scalping: 4560 (main profit-taking / reaction sell)
Technical read (Liam style)
Breaking through the trend confirms uptrend: the trendline break signals buyers are back in control.
4434–4437 is the clean re-entry area: a logical pullback zone with better R:R.
If volatility spikes and price hunts liquidity, 4340–4343 is the “best value” area to look for a strong reaction.
Trading scenarios
✅ Scenario A (priority): BUY the pullback at 4434–4437
Entry: 4434 – 4437
SL: below 4426 (or below the most recent H1/H3 swing low)
TP1: 4485 – 4500
TP2: 4560 (ATH – main target)
Logic: Uptrend confirmation is in place — I only want the pullback entry, not a chase.
✅ Scenario B (deep buy): If price sweeps down into 4340–4343
Entry: 4340 – 4343
SL: below 4330
TP: 4434 → 4500 → 4560
Logic: This is the “sweet spot” if the market does a liquidity reset before pushing higher again.
⚠️ Scenario C (scalp only): SELL reaction at ATH 4560
Entry: 4560 (only if we see clear rejection / weakness)
SL: above the sweep high
TP: 4520 → 4500 (quick scalp)
Note: This is a scalp idea at ATH — not a long-term bearish call while the bullish structure is intact.
Key notes
Avoid entries mid-range. Only execute at 4434–4437 or 4340–4343.
Wait for confirmation on M15–H1 (rejection / engulf / MSS).
Risk management: 1–2% per idea, scale out into ATH.
Are you waiting for the 4434 pullback buy, or hoping for a deeper sweep into 4340 for the cleanest entry? 👀

XAUUSD (H2) – Liam View: Buy the liquidity pullback, re-buy...XAUUSD (H2) – Liam View: Buy the liquidity pullback, re-buy at the 0.618 zone
1) Macro snapshot (Venezuela headlines = faster repricing)
Since Maduro was reportedly detained, Venezuela’s market has reacted aggressively — your note highlights the IBC index surging +74.71% in just two sessions and +156% over 30 days, showing a rapid “repricing” of political risk and expectations.
For gold, this kind of backdrop usually means bigger swings + liquidity sweeps: the market can flip between risk-on bursts and renewed safe-haven demand.
➡️ So the best play today is still level-based execution, not chasing candles.
2) Chart read (H2) – Uptrend intact, but it needs a clean pullback
From your H2 chart:
The broader structure is still bullish, but price is in a short-term pullback after the recent push up.
The key level is the 0.618 Buy Zone: 4414–4417 — a classic re-entry area (liquidity + fib confluence).
Above, we have Buyside Liquidity near the recent highs — that’s the magnet if buyers regain control.
3) Trade plan (clear Entry / SL / TP)
✅ Scenario A (priority): BUY the 0.618 pullback
Buy zone: 4414 – 4417
Stop loss (SL): below 4406 (or safer: below the most recent H2 swing low)
Take profit (TP):
TP1: 4460–4470 (recent rebound high area)
TP2: sweep Buyside Liquidity (above the highs)
TP3: if the breakout holds, continue towards the upper resistance band on your chart
Logic: In a bullish structure, the 0.618 pullback is often the cleanest “re-buy” entry — especially when headlines trigger sharp dips and fast rebounds.
✅ Scenario B: Shallow pullback → buy only with confirmation
If price doesn’t reach 4414–4417 and only dips lightly:
Wait for a lower-TF confirmation (M15/H1 shift / rejection)
Take a smaller continuation buy and aim for a quick 8–12$ move
⚠️ Scenario C (scalp only): SELL after a buyside sweep and rejection
If price runs the highs (buyside liquidity sweep) and then prints a strong rejection:
You can sell scalp back into 4460–4445
SL: above the sweep high
Not a long-term bearish call while the rising structure is still valid.
4) Key note (headline week)
Venezuela headlines can keep volatility elevated, so:
Avoid entering mid-candle
Use zones + confirmation
Reduce size if spreads widen
If I had to pick one clean trade today: wait for the 0.618 buy zone (4414–4417), then buy for a push into buyside liquidity.

H1 Bullish Trend, Will Next Move Possible 4509The "Break and Retest" Play
We are currently seeing a classic technical correction within a strong macro bullish trend. After the aggressive rally earlier this week fueled by geopolitical tensions (Venezuela crisis), the market is now in a "cooling off" phase.
Technical Breakdown
1. The Ascending Channel Breakout
Context: Gold was trading within a well-defined bullish channel (the blue box) until Jan 7th.
The Shift: We’ve seen a decisive break below the channel's lower boundary. In professional terms, this is a Change of Character (CHoCH) on the lower timeframe, shifting the intraday bias from bullish to neutral/corrective.
2. Key Support & Resistance Levels
Support (The Floor): Your grey line at $4,406 is a critical structural level. If price breaches this, we could see a deeper slide toward the psychological $4,380 zone.
The Pivot (The Red Line): The red line at roughly $4,445 is the current "battleground." This acted as recent resistance; flipping this back into support is mandatory for the bulls to regain control.
Target (The Blue Line): Your target at $4,501 aligns with major liquidity. Institutional sellers are likely sitting just above the $4,500 round number.
3. Price Action Projection (The "Z" Pattern)
Your black drawing suggests a bullish continuation via a "Double Bottom" or a "Higher Low" formation at the red support line. This is a high-probability setup if the 1-hour candle closes with a long lower wick (rejection) at that red line.
Fundamental Context (The "Why")
As a pro trader, you cannot ignore the macro drivers hitting the tape right now:
Index Rebalancing: We are currently in the Jan 8–15 window where major commodity indices (like Bloomberg & S&P GSCI) rebalance. This usually creates artificial selling pressure on gold, explaining the current dip.
NFP Uncertainty: Today is Friday. The market is waiting for the US Non-Farm Payrolls (NFP) report. High volatility is expected. If the jobs data comes in stronger than expected, gold may test your $4,406 support level before finding buyers.

SOLANA - retest resistance of the trading range BINANCE:SOLUSDT has been rising since the session opened amid a weak market. The altcoin is showing bullish momentum in a predominantly bearish market, with a focus on the 145.0 zone.
Bitcoin is rebounding from resistance amid a global downtrend. There is currently no bullish potential (across the entire market), which is putting pressure on altcoins overall.
SOL, against the backdrop of a neutral market, is seeking to test the resistance zone of 144.7 - 146.0 - a key liquidity zone that plays an important role for MM in the current circumstances.
A short squeeze and the formation of a reversal pattern could shift the imbalance towards sellers, which in turn could lead to a decline.
Resistance levels: 143.4, 144.7, 146.0
Support levels: 134.3, 127.55
Solana is trading in a neutral trading range of 145.0 - 123.0. The main trend is bearish. The bullish run and retest of resistance can be perceived as a hunt for liquidity. We are interested in the above-mentioned resistance zone and confirmation in the form of a false breakout to enter the market.
Best regards, R. Linda!

ETH — Price Slice. Capital Sector. 3255.91 BPC 5© Bolzen | The Architect | BPC Framework
Bolzen Market Institute
🏷 ETH — Price Slice. Capital Sector.
TradingView Publication Date: 09.01.2026
🏷 3255.91 — price not yet reached at time of publication.
🏷 BPC — The Bolzen Price Covenant — Strength Index: 5
Quantum structure of obligations and capital flow in price formation via energy blocks.
🏷 Vertical chart — Energy Grid Dashboard.
🏷 Static Stream 1: price published in energy-block production sequence.
🏷 The price energy block is already ordered—not by time, but by execution priority. Crucially: block priority dynamically reconfigures in response to hidden energetic impulses, whereas price execution order records their market manifestation. Every price in the dynamic stream is tied to proprietary energy-production metrics inaccessible to the general public. Those who perceive structure before its manifestation do not follow price—they anticipate it.
EΞ2Φ8Ψ45Θ·ζ⁻¹·106Λ732·Ω²
📎 Screenshot:
🏷 When trading from levels, use liquidity zones from BPC 10 and above.
🏷 Bolzen Liquidity Map — ETH (numerical equivalent):
🏷 I. Interactive Reference Guide: BPC — The Bolzen Price Covenant
🏷 P.S. English is not my native language — I offer no apologies for stylistic imperfections. What you see here is not a post. It is a demonstration of another level of preparation: the symbiosis of human intuition and algorithmic precision. Mathematics and aggressive market analysis — against the machine of liquidations.
The persistent ETH and BTC Energy Grid Dashboard remains publicly accessible and is intended for international institutional review.
— The Architect
BPC — The Bolzen Price Covenant

#BTCUSD trade ideaBTC likely completed its bullish cycle.
Correction target: 54K–59K (major demand zone).
If it breaks, next support: 30K+

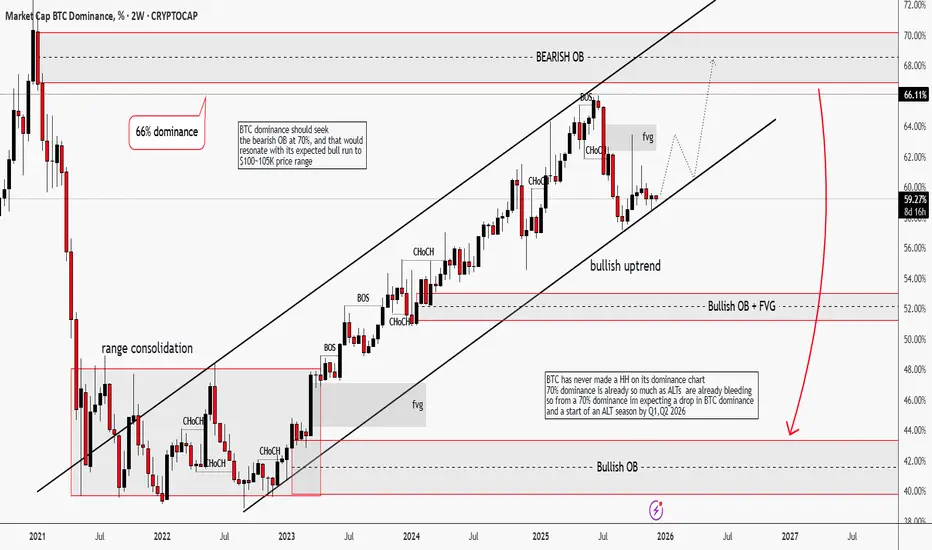
BTC Dominance | Winter is "Almost" ComingHello traders,
Its been a minute since I last checked my wallet, cause I don't love seeing red. Who loves to?
BTC dominance on the 2W timeframe has been in an impulsive bullish uptrend. Structure-wise, it has printed multiple BOS + CHoCH, which tells me that capital are still rotating into Bitcoin, not alts.
What make me believe this further, is that BTC is forming a short-term bullish structure that might target $100-105k price range
Only after BTC dominance reaches 70% area, we might start expecting shift. Distribution on BTC.D and the conditions for an ALT season.
Historically, BTC dominance has struggled to make HH that is why I'm expecting a drop from the previous Bearish OB
TL;DR: BTC dominance shall drop from the range of the bearish OB 70% which shall align with its projected bull run to $100k-105k price range. After that, we can call for ALT season.
Good Luck!
Please drop a like and share your thoughts traders.
EUR/USD – When COT, Seasonality and Price Action Align BearishPrice has completed a bullish impulsive leg and reached a key daily supply zone around 1.1780–1.1800, where a clean and well-structured bearish reaction developed. The break of the ascending channel, followed by a sequence of lower highs and lower lows, confirms a daily structure shift.
Price is now rotating lower toward an initial intermediate demand area at 1.1620–1.1580, a technically relevant zone where a corrective bounce is statistically possible. However, the main liquidity magnet remains the deeper daily demand at 1.1560–1.1500, still unmitigated and representing the primary bearish extension scenario.
The technical bias remains short as long as price stays below the 1.1720–1.1740 resistance area.
2. COT Report – EUR vs USD
On EURO FX futures (CME), Commercials remain heavily net short, consistent with a distribution phase following the recent rally. Non-Commercials are still net long, but without meaningful expansion, a typical configuration near a medium-term top.
On the U.S. Dollar Index, Commercials maintain a structural net long position, while Non-Commercials are gradually reducing short exposure. This positioning supports the view of a USD stabilization phase, aligning with a broader corrective bearish continuation on EUR/USD.
3. Seasonality
Historical seasonality shows that January is on average a weak month for EUR/USD, particularly during the second half of the month. After an initial sideways phase, the pair statistically tends to develop downside pressure, with lows often printed between mid and late January.
This seasonal pattern favors short continuation or sell-on-rallies scenarios, rather than fresh bullish expansions.
4. Retail Sentiment
Retail sentiment shows a majority of long positions (around 54%), while price continues to move lower. This classic price–sentiment divergence reinforces the bearish bias, suggesting the market is moving against the retail crowd, as typically observed during directional corrective phases.

three possible buys Three potential long entries identified. Both 4H and 1H RSI indicate oversold conditions, suggesting favourable risk/reward for at least one setup to materialize.

#BTC Will The Bullish Momentum Continue???BTC is showing signs of strength. We have had a strong push from the lows to the topside of the range. The formation looks clean and the setup is currently bullish. At the time of writing this BTC is re-testing the .5fib zone and holding above. On the hourly tf we are accumulating below the 50ema which is also bullish. I would like to see a weekly close above the PWH @ $91877. Ultimately as long as we continue to hold above 89ish i favor higher prices and expect to see prices recover the 99k AOI. There is a wall of sellers at the 94k that the bulls need to break through with strength to validate this setup. Also short term failure to break above PWH on the weekly closure could resolve with sellers taking control again and would make this move look more like a liquidity grab. We have everything currently aligning for higher prices, but if we get a daily close below 89k then my bias would become neutral and a close below 86.7k would make my bias become bearish.

Elite | XAUUSD – 1H | Market Structure & Recovery ZonePEPPERSTONE:XAUUSD
After rejecting from the previous all-time high region, XAUUSD experienced a sharp corrective move followed by recovery buying pressure. The recovery zone has held firmly, suggesting strong institutional interest. Price action remains constructive as long as the support zone is respected, keeping the bullish continuation scenario valid.
Key Scenarios
✅ Bullish Case 🚀
If price holds above the recovery zone and confirms continuation, upside targets remain:
🎯 4,480
🎯 4,520
🎯 4,550+ (Potential New All-Time High)
❌ Bearish Case 📉
A sustained breakdown and close below the recovery zone would weaken the bullish bias and open the door for deeper correction.
Current Levels to Watch
Resistance 🔴: 4,480 – 4,550
Support 🟢: 4,400 – 4,420 (Recovery / Demand Zone)
⚠️ Disclaimer: This analysis is for educational and informational purposes only. It is not financial advice. Please conduct your own research before trading.

TOP Altcoins for 2026 ~ ALTSHappy New Year 🥂
Here's a quick glance at my TOP 5 alts of choice for 2026, and why.
💭Injective (INJ)
Fast, interoperable DeFi infrastructure. Active development and a clear use-case in scaling decentralized trading.
💭Illuvium (ILV)
Prioritizes high-quality gameplay and steady development, backed by a solid revenue model.
💭Solana
ETH competitor, SOL is approaching some great buy zones that can have big bounces:
💭Origin Protocol (OGN)
Focuses on tokenized commerce and NFT marketplaces, making it easy for creators and brands to build decentralized storefronts.
💭Audius (AUDIO)
Decentralized music-streaming platform giving artists more control and growing consistently in real-world adoption.
Which alts are you watching for this year?
