Gold Forex Trading During Major Economic Events & News Releases
I guess you already noticed how impulsively the markets may react to economic events and news.
In this article, I will teach you a simple strategy to follow during important news release s and how to trade news.
1. Sort out the economic calendar
There are a lot of news in the economic calendar.
They are not equal in their impact.
Most of the economic calendars indicate the potential significance of each event: while some news have low importance, some have medium importance and some are considered to be extremely important.
For example, above is the list of coming UK fundamental news.
You can see that these news have different degree of importance.
My recommendation to you is to sort out the economic calendar in a way, so it would display only the most important news.
Among the news that we discussed above, only one release has high importance.
2. Know on what trading instruments does the news have an effect
While some of the news in the economic calendar may impact many financial markets and trading instruments, some news may affect very particular instruments.
For example, a FED Interest Rate decision may have a very broad effect on financial markets.
At the same time, Interest Rate Decision in Australia may affect only Australia - related instruments.
3. Don't trade one hour before the news and one hour after the release
Once you see the important fundamental news coming, don't trade the trading instruments that can be affected by the new s 1 hour before and after the release.
For example, in 5 minutes we are expecting important UK news - CPI data.
I stopped trading GBP pairs 1 hour before the release of the news, and will resume trading them one hour after the release.
4. Protect your trading positions 5 minutes ahead of the news
If you have an active trading position and related important news are expected, move your stop loss to entry 5 minutes ahead of the release of the news.
For example, I have a short trade on GBPAUD. I see that in 5 minutes important UK data is coming. I will move stop loss to entry 5 minutes ahead of the news and make a position risk-free.
I always say to my students, that news trading is very complicated. Due to a high volatility, it is very hard to make wise decision during the news releases.
The approach that I suggest will help you to avoid all that and trade the markets when they are calm.
❤️Please, support my work with like, thank you!❤️
I am part of Trade Nation's Influencer program and receive a monthly fee for using their TradingView charts in my analysis.
Fundamental-analysis

Fundamental Market Analysis for December 4, 2025 GBPUSDEvent to watch today:
15:30 EET. USD - Unemployment Claims
GBPUSD:
Sterling holds near five-week highs versus the dollar thanks to contrasting rate expectations: markets see an earlier Fed cut, while the Bank of England proceeds more cautiously given sticky services inflation and wages. Improved macro assessments for the UK and firmer global risk appetite support the pound and encourage demand for GBP-denominated assets.
At the same time, the dollar remains under pressure from softer U.S. indicators, redirecting flows toward higher-yielding G10 currencies. U.S. yields have stabilized without clear upside, reducing the dollar’s appeal as a defensive asset.
If this configuration persists, the pound has room for a gradual advance against the dollar. Risks relate to potential upside surprises in U.S. data or remarks from policymakers; however, for now the fundamental picture remains moderately constructive for GBP.
Trading recommendation: BUY 1.33500, SL 1.33150, TP 1.34550

Fundamental Market Analysis for December 3, 2025 EURUSDThe euro holds gains against the dollar as demand for USD as a safe asset eases and markets reassess the Federal Reserve’s rate path toward earlier easing. Signs of slower U.S. manufacturing activity and a partial pullback in Treasury yields reduce the dollar’s premium from the rate differential. Additional support for the euro comes from stronger risk appetite at the start of December and investors’ willingness to lock in dollar profits after a strong year for the European currency.
In the euro area, attention has shifted to inflation and signals from the ECB about keeping current settings while disinflation progresses without threatening growth. Services prices remain resilient, but cooler energy imports and stabilizing producer prices reduce the risk of secondary acceleration. In this environment, the dollar’s premium narrows on expectations of softer U.S. activity and a possible Fed policy turn while financial conditions remain easy.
Risks to long positions stem from an unexpected upside surprise in U.S. labor or inflation data that could briefly revive USD demand. Even so, the current balance of factors—slightly lower U.S. yields, stabilizing European inflation, and a constructive risk tone—supports buying on dips with disciplined risk control.
Trade recommendation: BUY 1.16400, SL 1.16200, TP 1.17000

Metals on the Rise: Is Gold and Copper Ready to Surprise?In November, clients most actively traded metals such as #XAUUSD, #XAGUSD, #CUCUSD, #XPTUSD, and #XAUEUR — these instruments showed the highest share of profitable trades. Today’s review focuses on the outlook for precious metals and copper: investor demand, industrial consumption, mining news, and rate expectations are shaping the sentiment for December and the final stretch of 2025.
Growth Prospects for Metals Through the End of 2025
#XAUUSD — Gold is supported by central bank purchases and heightened demand during periods of uncertainty. The softer the Fed and the lower the yields, the more logical it becomes to buy on pullbacks.
#CUCUSD — Copper: disruptions at mines and rising demand (energy transition, power grids, data centers, transportation) increase the risk of a supply deficit. Against this backdrop, copper pullbacks look like buying opportunities.
#XPTUSD — Platinum: limited supply and stable industrial demand support prices. With a calm news cycle, pullbacks may provide a chance to catch up with more popular metals.
#XAUEUR — Gold in EUR: market volatility and strong demand for safe-haven assets continue to support gold prices in euros. Even at elevated levels, traders still use pullbacks for buying.
#XAGUSD — Silver: industrial demand (solar energy, electronics) combined with gold’s dynamics supports silver. If market sentiment turns, pullbacks may rebound upward.
According to FreshForex analysts , a softer Fed stance, strong safe-haven and industrial demand, and potential supply-side risks create a supportive environment for buyers of gold, silver, platinum, and copper, pointing to gradual price growth. Under these conditions, it makes sense to closely watch pullbacks and key levels for phased position building — while maintaining strict risk control.

Fundamental Market Analysis for December 2, 2025 USDJPYThe yen receives targeted support on expectations that the Bank of Japan may discuss the possibility of a rate increase at an upcoming meeting, while in the U.S. the case for a December Fed rate cut strengthens due to weak manufacturing dynamics. This shift in monetary-policy balances narrows the yield differential in favor of the yen and limits USDJPY’s upside potential despite ongoing volatility in global bonds.
An additional factor comes from Japan’s government-bond market: rising JGB yields to multi-year highs point to normalization in the price backdrop and the regulator’s readiness for a more flexible approach. On the U.S. side, weak survey data for manufacturing and a higher probability of a rate cut weigh on the dollar, while lower real yields diminish interest in dollar safe-haven assets.
Risk factors for the short include verbal interventions that may temporarily influence the exchange rate and a sudden shift in Fed rhetoric toward holding rates without clear forward guidance. Nevertheless, given current expectations for the Fed and cautious “Japanese normalization,” the probability of moderate yen strengthening in the near term is seen as higher than the risk of a strong dollar-positive impulse.
Trade recommendation: SELL 155.650, SL 155.800, TP 154.900

How to Build a Consistent Execution Checklist on TradingViewMost trading mistakes don’t come from bad strategy, they come from inconsistent execution.
An execution checklist removes guesswork and replaces it with structure.
When your actions follow a routine, your results stabilize.
TradingView gives you everything you need to build a checklist that stays visible, actionable, and tied directly to your chart.
1. Define Your Core Conditions
Before any trade, the bigger picture must be clear.
Start your checklist by answering three questions:
What is the higher-timeframe direction
Where is price relative to key levels
Is price approaching with strength or weakness
Use TradingView’s drawing tools to mark support, resistance, value zones, and session highs and lows.
Add a simple text note on the chart listing your core conditions so they are always visible.
If the market context fails this first screen, the trade is already invalid.
2. Build Confirmation Criteria
Once structure is confirmed, you move to evidence.
Mark confirmation areas directly on your chart:
Liquidity pools
Fair value zones or imbalances
Previous session highs and lows
Asian range or New York open
If your strategy uses indicators, document exact conditions:
Moving average position and slope
Volume behavior
VWAP location
Volatility expansion or contraction
Define rules that don’t change based on emotion.
Confirmation should prove your bias, not justify your urge to trade.
3. Validate Risk Before Execution
Every setup must survive a risk checkpoint before it’s allowed to go live.
Your checklist must answer:
Where is my invalidation level
How much capital am I risking
Does this violate any daily limits
Is the reward worth the risk
Use TradingView’s long or short position tool to visualize risk directly on the chart.
Save it as a template so your risk process stays uniform across all trades.
No trade is valid if risk isn’t clean.
4. Create a Pre-Execution Routine
A checklist only works if you actually follow it.
Add a short pre-trade process directly to your chart notes using checkboxes or bullet points:
Example execution checklist:
Market phase confirmed
Level identified
Confirmation present
Risk valid
Entry condition active
Walk through this list before clicking buy or sell.
If one item fails, the trade fails.
Over time, this routine removes emotional impulse completely.
5. Review and Refine Weekly
Your checklist isn’t static, it evolves.
Every week ask:
Where did I break my rules
What conditions led to losses
Which confirmations work best
What rules saved me from bad trades
Use TradingView’s trade replay and journaling features to review execution quality, not just profit.
Consistency improves when your system evolves with you.
Final Thought
A checklist doesn’t restrict your trading, it frees you from emotion.
When your process is clear, your confidence increases.
When your confidence increases, discipline follows.
Good traders make decisions.
Great traders execute procedures.
Stay Green!
Fundamental Market Analysis for December 1, 2025 GBPUSDEvent to watch today:
01.12 17:00 EET. USD - ISM Manufacturing PMI
GBPUSD:
Sterling holds above 1.32 amid a softer dollar and a neutral-to-supportive UK backdrop: the impact of the Autumn budget and the OBR’s assessments is largely priced, while the Bank of England appears less inclined to ease early than the Fed. That divergence in policy expectations works against the dollar and underpins demand for GBP.
Additional support comes from moderately positive signals in UK labor and consumer activity, alongside steady gilt yields. A measured risk appetite and the dollar’s softness after benign U.S. data strengthen the short-term momentum in favor of the pound.
Risks relate to potential surprises in U.S. and UK statistics and any shifts in central-bank messaging. Nevertheless, the present configuration of fundamental factors is favorable for further GBP gains if the external backdrop remains neutral.
Trade recommendation: BUY 1.32300, SL 1.32000, TP 1.33200

Fundamental Market Analysis for November 28, 2025 EURUSDThe euro is fluctuating near 1.16 after a series of mixed signals: in the euro area, focus is on flash inflation readings in Germany and a broader data block, while the ECB maintains a cautious tone ahead of the December meeting. Comments from Governing Council members indicate it is premature to discuss further easing while core price pressure remains above target, and short-term liquidity is reflected in €STR without signs of a sharp loosening in conditions. Against a modest uptick in U.S. Treasury yields, interest in the dollar is supported, which caps the euro’s upside.
In the U.S., after the short holiday week, the policy path is being reassessed: markets are reluctant to bring forward expectations of rapid Fed easing as some recent macro indicators point to resilient consumption and labor demand. That keeps the dollar from weakening further and pushes participants to cautiously take profits on long-euro positions. An additional factor is cross-asset rotation into dollar assets amid ongoing fiscal risks in several EU countries.
The current setup favors a tactical pullback in EURUSD: neutral ECB communication alongside steady U.S. data supports the dollar around 1.16. Against this backdrop, we prefer selling from 1.15950 with a stop at 1.16250 and a target at 1.14950—the idea rests on the balance of fundamental drivers and the likelihood of flows into defensive assets if sentiment deteriorates.
Trade idea: SELL 1.15950, SL 1.16250, TP 1.14950

Fundamental Market Analysis for November 27, 2025 USDJPYThe yen firms on two overlapping forces: markets lean toward a gentler U.S. rate path next year, and Japan preserves the prospect of further normalization of monetary settings supported by wage agreements and stickier domestic prices. As U.S. Treasury yields edge lower, the relative appeal of dollar assets versus the yen decreases, pressuring the pair.
The risk of official comments from Japan’s financial authorities on the exchange rate also discourages aggressive dollar buying at elevated levels. The market remains sensitive to verbal signals and to willingness to prevent excessive volatility. Attention stays on Japanese government bond yields: a narrower U.S.–JGB yield premium reinforces downward pressure on USDJPY.
Holiday-thinned U.S. liquidity and month-end rebalancing can magnify reactions to news. In this setup, the pair retains scope for a corrective pullback if there are no fresh firm signals from the U.S. side and Japanese data remain neutral, with ongoing progress on inflation and wages supporting the yen over the medium term.
Trading recommendation: SELL 156.050, SL 156.350, TP 155.150

US MARKETS CLOSED TODAY - THANKSGIVING🚨 US MARKETS CLOSED TODAY - THANKSGIVING 🦃
Current Price: $4,150 - $4,156 📊
Yesterday's Close: $4,130
Monthly Performance: +3.94% ✅
Yearly Performance: +57.69% 🔥
Status: 🟡 HOLIDAY - THIN TRADING
🎉 MAJOR BULLISH NEWS! DEUTSCHE BANK UPGRADES FORECAST! 📈
BREAKING: Deutsche Bank raised its 2026 gold price forecast to $4,450/oz from $4,000, citing stabilizing investor flows and persistent central bank demand. The bank now expects a $3,950-$4,950 range next year
This is HUGE news for gold bulls! Major institution showing strong confidence in gold's future!
📊 IMPORTANT: TODAY'S MARKET CONDITIONS
🦃 Thanksgiving Holiday Schedule:
Gold will NOT be traded on November 27, 2025 due to U.S. Thanksgiving holiday
What This Means:
❌ US markets CLOSED all day
⚠️ Very thin liquidity globally
⚠️ Wide spreads expected
⚠️ Price gaps possible
✅ Good time to review positions
Friday (Nov 28):
Markets open but shortened hours
Very low volume expected (Black Friday)
Many traders still on holiday
💎 DEUTSCHE BANK FORECAST DETAILS
The Upgrade:
Deutsche Bank's new average forecast for 2026 stands at $4,450/oz, up from previous $4,000/oz. Bank anticipates gold to trade within range of $3,950 to $4,950 per ounce in 2026, with possible high near $4,950/oz - approximately 14% above current December 2026 futures prices
Why They're Bullish:
Key drivers: resilient investor demand, strong central-bank buying, limited supply response. Third-quarter supply-demand data supports continued central bank bid, with inelastic demand from central banks and ETF investment diverting supply from jewelry market. Overall growth in demand outpaces supply
Gold's unusually wide trading range in 2025—the largest since 1980—underpins constructive outlook for 2026
📈 CURRENT TECHNICAL ANALYSIS
Market Structure: BULLISH CONSOLIDATION 🟢
Gold trading near two-week highs above $4,170 after recent rally. Consolidating gains before next move.
Key Development:
Gold shrugging off Tuesday's small dip and pushing to multi-day highs above $4,170 per troy ounce. Move higher comes as US Dollar loses steam, even though US Treasury yields trying to rebound
Support Levels 🔵
Support 1: $4,130 - $4,140 (Yesterday's close - Immediate)
Support 2: $4,059 - $4,100 (Strong zone)
Support 3: $3,977 (55-day SMA)
Support 4: $3,886 (October 28 low)
Support 5: $3,750 (50% Fib retracement)
Resistance Levels 🔴
Resistance 1: $4,170 - $4,173 (Current highs)
Resistance 2: $4,245 (November 13 peak)
Resistance 3: $4,254 - $4,280 (Major barrier)
Resistance 4: $4,380 - $4,381 (All-time high - October 17)
📊 TECHNICAL INDICATORS
RSI: Heading toward 60 (Bullish momentum building) 🟢
ADX: Holding above 19 (Trend slowly gaining strength) ✅
Moving Averages: All pointing UP - Bullish alignment ✅
For now, momentum still leans bullish: Relative Strength Index heading toward 60, and with Average Directional Index holding above 19, underlying trend looks like it's slowly gaining strength
🎯 TRADING STRATEGY FOR THANKSGIVING WEEK
TODAY (Wednesday - Thanksgiving):
⚠️ DO NOT TRADE!
Reasons:
Markets closed
Zero liquidity
No meaningful price discovery
High risk of gaps
Best Action:
Review your positions
Plan for Friday/next week
Take the day off!
FRIDAY (Black Friday - Nov 28):
Trade with EXTREME Caution!
On November 28, XAUUSD may continue to rise, but price reversal still possible. Key support and resistance levels expected at $4,059.90 and $4,254.97
Strategy:
Wait for normal hours to resume
Use smaller position sizes
Expect wider spreads
Watch for gaps from Thursday close
NEXT WEEK (December Trading):
Back to Normal - Key Levels:
BULLISH Scenario (65%):
IF holds above $4,130-$4,140
Target: $4,245 → $4,280 → $4,380
Entry: Pullback to $4,140-$4,150
BEARISH Scenario (35%):
IF breaks below $4,100
Target: $4,060 → $3,977
Entry: Break and retest of $4,100
🌍 FUNDAMENTAL OUTLOOK
BULLISH FACTORS ⬆️⬆️⬆️
✅ Deutsche Bank Upgrade - Major vote of confidence!
✅ Analysts predict gold may reach $4,456-$4,509 by end of November
✅ Central banks purchased 634 tonnes YTD, WGC expects 750-900 tonnes for 2025
✅ Fed Rate Cut Expected - December odds rising
✅ Dollar Weakness - DXY losing momentum
✅ Demand > Supply - Structural bull market
✅ ETF Inflows - First net buying in 4 years
✅ Geopolitical Tensions - Safe-haven support
Key Quote:
Central banks planning record high gold allocations. Gold positioned as "ultimate protection against black swan tail risk events." ETFs returned to net accumulation in 2025 after four years of outflows
Risk Factors ⬇️
⚠️ Profit Taking - After 57% yearly gain
⚠️ Technical Overbought - Short-term
⚠️ Holiday Volatility - Thin markets
⚠️ Strong US Data - Could delay Fed cuts
💡 WEEK RECAP & OUTLOOK
This Week's Performance:
Current XAU/USD exchange rate: $4,155.98. Over past year, XAU/USD changed by 57.69%, trading within 52-week range of $2,583.49 to $4,381.60
Gold rose to $4,138.45 on November 25, up 0.07% from previous day. Over past month, gold's price risen 3.94%, up 57.22% compared to same time last year
November Performance:
✅ Recovered from $3,886 low
✅ Now at $4,150+ (Multi-week highs)
✅ +3.94% for the month
✅ On track for analysts' $4,456-$4,509 target
🔮 FORECAST & TARGETS
End of November (3 Days):
Expected: $4,200-$4,300 range
Target hit probability: 70%
December 2025:
Range: $4,150-$4,400
Target: Retest all-time high $4,381
2026 Targets (Deutsche Bank):
Average: $4,450/oz
Range: $3,950-$4,950
Potential High: $4,950 (+19% from current)
Long-term (Other Analysts):
Some forecasts: $5,000+ by late 2026
Ultra-bullish: $6,000+ by 2027-2028
🏆 PROFESSIONAL ANALYSIS SUMMARY
Gold is in a STRONG POSITION entering the holiday period. The Deutsche Bank upgrade is a major institutional endorsement of the bull market.
The Big Picture:
Technical: Bullish trend intact, consolidating at highs
Fundamental: Demand > Supply, Central bank buying strong
Sentiment: Major banks turning more bullish
Positioning: Healthy after recent consolidation
Key Insight:
Gold's upward trajectory is structurally supported rather than merely cyclical
This means the rally has LEGS - it's not just speculation, it's backed by real supply/demand fundamentals!
💪 TRADING PSYCHOLOGY - HOLIDAY EDITION
Take a Break!
Markets are closed, you should be too! Use today to:
Spend time with family 🦃
Review your trading journal
Plan for December
Recharge your mental energy
Remember: The best trade is sometimes NO trade!
🎯 POST-HOLIDAY TRADING PLAN
Friday (Nov 28):
⚠️ Avoid trading (thin liquidity)
Watch for any gaps
Let market settle
Monday (Dec 2):
Resume normal trading
Watch $4,140 support
Target $4,245 if bullish
Key Levels to Watch:
Above $4,170: Bullish → Target $4,245+
Below $4,130: Caution → Support at $4,100
📊 SUPPORT/RESISTANCE SUMMARY
Critical Support: $4,130-$4,140
Strong Support: $4,100, $3,977
Weak Resistance: $4,170, $4,200
Strong Resistance: $4,245, $4,280, $4,380
Breakout Level: $4,245 (Opens $4,380 retest)
Breakdown Level: $4,100 (Triggers correction)
🔔 THANKSGIVING MESSAGE
Happy Thanksgiving! 🦃
Whether you're trading gold or not, take time today to be grateful. The markets will be here tomorrow, next week, and next year. But today is for family, friends, and reflection.
Three Things to Be Grateful For in Trading:
Opportunity - Markets give us chances every day
Learning - Every trade teaches us something
Community - We're all in this together!
Enjoy your day! 🙏
⚠️ FINAL REMINDERS
For Today:
Markets CLOSED ❌
No trading possible
Relax and recharge 🦃
For Friday:
Shortened hours
Very low volume
Trade with extreme caution
Smaller positions
For Next Week:
U.S. third-quarter GDP data may influence gold prices
Back to normal volume
December rate decision approaching
Year-end positioning begins
📈 YEAR-END OUTLOOK
December Catalysts:
Fed rate decision (Dec 17-18)
Year-end positioning
Q4 GDP data
Holiday season (thin trading Dec 24-Jan 1)
2026 Setup:
With Deutsche Bank's $4,450 target and bullish structure, gold entering 2026 with strong momentum!
🦃 Happy Thanksgiving from the Trading Desk!
📱 Enjoy the holiday - markets resume Friday
💎 Stay blessed and grateful
🙏 See you next week for December trading!
#Gold #XAUUSD #Thanksgiving #DeutscheBank #BullMarket #GoldForecast #HappyThanksgiving #MarketHoliday #2026Outlook #TradingBreak

Fundamental Market Analysis for November 26, 2025 GBPUSDOn Wednesday, 26 November 2025, GBP/USD is holding above 1.31000 ahead of the UK’s Autumn Budget announcement. In recent sessions, the pair has been fluctuating around the month’s recent highs but has not formed a sustainable upside impulse: UK government bond yields are drifting lower and market participants prefer to reduce risk until there is more clarity on the spending and tax details of the budget. Against this backdrop, the short‑term balance of factors is tilted against the pound, given the currency’s high sensitivity to fiscal decisions and their impact on business activity.
October data point to slowing consumer inflation in the UK and further easing of price pressures in the services sector. Combined with signs of cooling demand, this strengthens expectations of a Bank of England rate cut as early as December. Potential fiscal consolidation that the Treasury may outline today would further restrain domestic demand and growth prospects, which typically reduces the pound’s premium and leaves it more vulnerable to a correction when the external backdrop is neutral.
At the same time, the US retains a relative advantage in terms of growth and yields, while caution ahead of a series of US releases supports the dollar. In such conditions, there remains a risk of a pullback in the pound from elevated levels: a sustained move below the area of recent highs could bring renewed interest in selling. Given the current news configuration, a short setup from 1.32000 looks justified, with moderate risk limits and a target return to the 1.31100 area.
Trading idea: SELL 1.32000, SL 1.32200, TP 1.31100

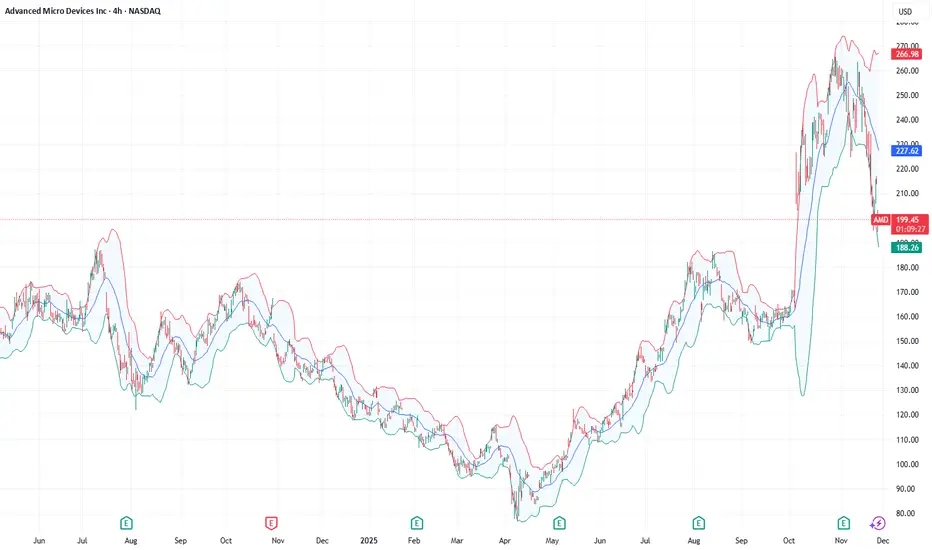
Tech giants and a crypto exchange under pressure!Recently, the stocks of Advanced Micro Devices (#AMD), Coinbase Global Inc. (#Coinbase), Oracle Corp. (#Oracle), NVIDIA Corp. (#NVIDIA), and Arm Holdings plc (#Arm) have come under pressure amid a reassessment of artificial intelligence (AI) valuations and growing caution toward risk assets. Investors are reacting nervously to the cost of capital, the pace of AI monetization, and the resilience of demand within adjacent ecosystems.
5 Factors Behind the Decline:
#AMD (−10.33%) — profit-taking after a strong rally and growing doubts about the scalability of server GPUs. Additional pressure comes from margin risks driven by aggressive capital spending and competition in high-performance GPU accelerators.
#Coinbase (−10.31%) — a weakening crypto market reduces trading volumes and fee revenue. Regulatory risks and volatile client flows deepen the valuation discounts.
#Oracle (−10.29%) — concerns over rising debt levels amid heavy investments in cloud and AI infrastructure. The market fears shrinking free cash flow and pressure on valuation multiples if growth slows.
#NVIDIA (−4.08%) — “overvaluation + maxed-out expectations”: even strong earnings reports fail to calm concerns about cyclical demand in data centers. Added to this are risks of margin normalization and potential inventory build-ups among customers.
#Arm (−3.02%) — high sensitivity to sell-offs in the “AI sector,” especially given its premium valuation. Investors question how quickly the royalty-based model can translate into stable accelerated growth.
If concerns about AI-related spending and uncertainty around interest rates persist, stocks inflated by AI and crypto market expectations may continue to fall. Further capital outflows or rising borrowing costs would serve as triggers for additional downside.
FreshForex analysts see potential for a correction in #AMD, #NVIDIA, #Arm, #Oracle, and #Coinbase due to slowing AI infrastructure growth and persistently high capital costs. For #Coinbase , elevated crypto market volatility is an additional pressure factor. The current market situation creates conditions for developing scenarios for asset price declines.
Fundamental Market Analysis for November 25, 2025 EURUSDEvent to watch today:
15:30 EET. USD - Producer Price Index
EURUSD:
The euro holds just above 1.15000 as the market ramps up expectations of an imminent Fed rate cut. The drop in long-dated U.S. yields and a rebound in risk appetite reduce the premium for holding the dollar and support the euro. Rate futures indicate a high probability of a policy adjustment in the coming weeks, narrowing the yield differential.
On the European side, the picture appears calmer: there are signs of stabilization in business activity, and the ECB is essentially taking a prolonged pause. Tame inflation and a moderate labor market reduce the risk of further easing, which lowers pressure on euro funding costs and supports investor interest in the region’s debt—therefore backing the single currency.
In the U.S., the focus is on household spending and the PCE inflation gauge: softer readings would reinforce a repricing of the Fed’s path. If the opposite occurs, the dollar may firm temporarily, but without a stark shift in the data the balance of factors still favors a gradual rise in EURUSD.
Trade recommendation: BUY 1.15150, SL 1.14950, TP 1.15750

Fundamental Market Analysis for November 24, 2025 USDJPYThe pair holds above 156 amid a calm dollar, but the news flow from Japan raises reversal risks: the Ministry of Finance has stepped up warnings about readiness for currency actions if yen weakening accelerates, and this week’s liquidity may be thinner than usual. That restrains further upside at sensitive levels.
An additional factor is the signal that the Bank of Japan could consider steps toward normalization in the near term amid sustained wage and price growth. The yield gap in favor of the US remains significant, but the policy-market price of intervention risk for long USD/JPY positions has increased.
Given this, selling from 156.60 with protection at 157.000 and a target at 155.400 is preferable: stronger verbal signals from authorities and the possibility of changes in the central bank’s stance may trigger demand for the yen during another bout of dollar volatility.
Trading recommendation: SELL 156.600, SL 157.000, TP 155.400

BTC/USDT 1W chart review📉 1. Market structure – trend and break
• The chart shows a black upward trend line that has led the market since 2023.
• This line has been clearly broken, which means:
✔ weakening of the structure
✔ the first serious threat to the upward trend
✔ possible move towards lower support levels
A breakout of the weekly trendline usually ends a medium-term upward trend.
⸻
📉 2. Current price
BTC is around USDT 87,770 and the weekly candle is heavily bearish.
This means that buyers do not react to the first support.
⸻
🟥 3. Most important support levels
1) 92,086 USDT – local resistance zone (previously support)
• Price has broken this support from above → now acts as resistance.
• To return to growth, BTC would have to close the week above this zone.
2) 84,583 USDT – first major support
• Price is just above the zone.
• If this fails → there will be an increased chance of continued declines.
3) 74,324 USDT – key macro support (MAIN LEVEL)
This is the most important level of the chart.
• This is the level where demand must occur if BTC is to maintain its long-term structure.
• Breaking this barrier will open the way to declines even to around 60-65k.
⸻
🟩 4. Resistance levels
1) USDT 92,086
Closest resistance – key to recovery.
2) USDT 100,794
Big weekly resistance that stopped the market earlier.
Only a breakout → continuation of the bull market.
⸻
📊 5. Stochastic (week) – very important
At the bottom you can see Stochastic sliding down, almost at the value of 0-20 (oversold).
Interpretation:
• There is no buy signal yet because the lines have not turned upwards.
• Weekly momentum is still down, so the pressure on support continues.
📈 7. Scenarios
Bullish (less likely for now)
1. Maintaining 84.5k
2. Stochastic weekly turns upwards
3. Price returns above 92k
➡️ Target: 100.7k
Bearish (more likely)
1. Breakthrough 84.5k
2. Retest from the bottom
3. Drop to 74.3k
➡️ If 74k breaks → 65-68k

TSLA: Fundamentals Are Collapsing While Valuation Stays in OrbitTesla is trading near multi-month highs… but the fundamentals tell a very different story.
EPS has dropped by 50%, revenue growth has almost stalled, and yet the stock still carries a Forward P/E of 164.
This combination — slowing growth and extreme valuation — looks like the definition of an institutional bubble setup.
🧮 Fundamental Context
Over the past few years, Tesla’s growth has slowed dramatically:
Revenue rose from 31B → 53B → 81B → 96B → 97B — barely any increase.
EPS climbed from 0.2 → 1.6 → 3.6 → 4.3 — and then fell by half.
Quarter-over-quarter metrics remain negative, with no visible recovery trend.
Meanwhile, the Forward P/E of 164 implies double-digit expansion ahead — which clearly isn’t happening.
The fundamentals simply do not justify this kind of valuation.
Right now, Tesla’s numbers resemble the early phase of a valuation compression cycle — where prices eventually catch up with reality.
📉 Technical Structure
Technically, Tesla has been moving in a broad sideways range, forming what looks like a long-term Wave 4 structure.
We’re currently inside the “B” leg, which could already be complete or near completion.
Once that wave ends, the next expected move is a Wave C decline.
Key levels to watch:
📍 Upper resistance zone: $400 – $550
📍 Primary cluster: around $250
📍 Support zone: $150 – $200
The chart shows clear volume concentration around $250 — once that level breaks, the next liquidity pocket sits between $150 and $200.
That’s where a potential bottoming cluster could form before the final upward leg.
⚠️ Market Outlook
While other FANG names maintain solid balance sheets and stable earnings, Tesla’s fundamentals are deteriorating sharply.
Yes, the stock may still see short-term pumps driven by sentiment or Musk’s fan base — but markets always return to fundamentals.
And those fundamentals are pointing downward.
📊 Summary
EPS and revenue both trending lower 📉
Forward P/E at 164 — completely disconnected from growth metrics
Technical range suggests potential decline toward $200–$150
Current price action likely part of a larger corrective structure
Long-term investors should exercise extreme caution ⚠️
Tesla isn’t a short-term “growth story” anymore — it’s a valuation risk story.
Until earnings stabilize and margins recover, this stock looks massively overpriced.

NVDA Head and Shoulders- Dec Rate Cuts has changed setupNvidia’s setup has shifted. With the Fed signaling a likely rate cut on December 10th, the market will start baking that optimism into asset prices ahead of time. When monetary conditions ease, high-valuation tech often gets an extra tailwind, which means the expected head-and-shoulders pattern on NVDA may fail to play out cleanly. The chart might still roll over, but the macro backdrop now works against a decisive breakdown. Short positions here demand caution.
Original post
Nvidia’s bear case rests on one core idea: the stock price assumes a flawless, world-eating AI future, and markets almost never deliver on “perfection narratives.” NVDA trades at extreme valuation multiples for a hardware-driven, highly cyclical business. Those multiples only hold if AI infrastructure spending keeps compounding at its current breathtaking pace for years. But that demand is dangerously concentrated in a handful of hyperscalers who are spending now and rationalizing later. Michael Burry’s recent argument sharpens this point: he claims true end-demand for AI horsepower is vastly overstated, and that much of the current GPU frenzy is a self-reinforcing loop of capital, hype, and accounting gimmicks rather than broad, organic need. If boards pause to question real ROI, or if the circular funding loop breaks Nvidia’s revenue curve can flatten quickly, dragging the valuation down with it.
Competition, long dismissed by NVIDIA bulls, is another structural headwind. AMD is now shipping accelerators that hyperscalers are actually integrating, and every major cloud provider is building in-house silicon to reduce dependence on NVDA’s margins. Even if Nvidia maintains leadership, it doesn’t need to lose the crown to lose the multiple, slight shifts in workload allocation or a handful of missed design wins are enough to pressure margins. And Burry’s critique deepens this point: he argues Nvidia’s reported profitability is flattered by depreciation assumptions and massive stock-based compensation that buybacks have failed to offset, meaning the “true” economic profit is less bulletproof than headlines suggest. Add to that the fact that U.S. export controls have effectively erased the China data-center market, once 20–25% of revenues and expectations of a seamless global TAM look increasingly unrealistic.
Technically, NVDA is doing exactly what a euphoric, overowned stock does when gravity starts tugging: momentum is fading, the price is slipping under short-term moving averages, and reactions to spectacular earnings have been strangely sluggish. That’s often the early signature of distribution rather than accumulation. And this lines up directly with Burry’s broader thesis: when a narrative becomes crowded and reflexive, the slightest wobble triggers violent air pockets. NVDA has become the ultimate proxy for the AI boom, the most crowded long in the market, meaning it’s the first thing funds sell when risk appetite cools, and the last thing buyers chase during corrections.
Put simply, Nvidia is a phenomenal company priced as if nothing can ever go wrong, while Burry is arguing that much of what looks “perfect” is not what it seems. The bear case isn’t that Nvidia collapses. It’s that the AI boom normalizes, competition accelerates, accounting realities catch up, margins slip toward something earthbound, and investors recalibrate how much they’re willing to pay. In that world, NVDA doesn’t need bad news to fall. It only needs the news to arrive slightly less euphoric than the fantasies currently baked into the price.
#NVDA #Bearish #HeadandShoulders #MichaelBurry

LINK TECHNICAL ANALYSIS — 1D📊
1. MARKET STRUCTURE
Long-term trend
The price is currently approaching this line, but has not yet tested it directly.
This is a key support level for the entire LINK market.
2. SUPPLY & DEMAND ZONE
Demand Zone — $9.6 – $4.8
The large red area. This is
a historical accumulation zone,
an area where LINK has been repeatedly defended,
an area to which the price has returned with each major dump.
Supply Zone — $15 – $20
The green area from which:
the price has been rejected repeatedly,
this is the selling wall from 2021,
a key target for bulls after the rebound.
3. CRITICAL LEVELS
Very important support
Type Level Description
Trendline ~11.5–12.2 USD We are very close to a test.
Horizontal 9.63 USD First major historical support.
Horizontal 4.84 USD Final low (strongest demand).
If the trendline breaks, the → ** LINK will almost certainly fall to 9.63**, and if that breaks too, → 4.8 USD is very likely.
4. MOMENTUM – STOCH RSI
On the Stoch RSI chart:
is extremely oversold,
similar to previous lows (2023, 2024),
signaling the possibility of a rebound within a few days/weeks.
5. PRICE SCENARIOS
🟢 BULLISH (bounce)
Condition: Maintaining the trendline
Expected movements:
Bounce around 11.5–12.5
Target 1: USD 15
Target 2: USD 18–20
Possible breakout → USD 22–24
This scenario is realistic if Bitcoin doesn't make another strong dump.
🔴 BEARISH (falling)
Condition: Breakout of the trendline with a daily candle below ~11.5
Expected movements:
A quick drop to USD 9.63
This could result in:
a bounce to ~12
or a continuation of the decline
If 9.63 falls → a practically certain target of USD 4.8
This level represents a significant historical accumulation and will not fall without a fight.
➤ Price is currently hanging by a thread.
The trendline is one of the most important support levels on the LINK chart.
Momentum is oversold → signal for a short squeeze/bounce.
But the local structure remains bearish.
➤ If the trendline holds → a thick long swing.
➤ If it collapses → we fall to 9.63 and possibly 4.8.

LYFT: The Hidden Gem in My October Top 3 PicksAs I’ve mentioned in my recent videos, LYFT is one of my top 3 priority stocks for October — and for good reason.
The fundamentals have exploded while the price is still lagging far behind.
🔸 Fundamentals
EPS growth has been massive .
– In March, EPS was up +128% YoY,
– and by June, it jumped to +234% YoY.
EPS has finally moved into positive territory , which is a strong signal.
Revenue continues to rise steadily, and EPS literally took off while the price hasn’t followed yet.
To put it in perspective — when LYFT traded around $60, EPS was negative .
Now, EPS is many times higher, but the stock still trades far below those levels.
Even emission has stopped increasing (we saw –0.25% in June 2025), and the forward P/E is only 15.3 ,
which is extremely low for this kind of EPS acceleration.
→ In short: LYFT looks deeply undervalued from a fundamental standpoint.
🔸 Technical Picture
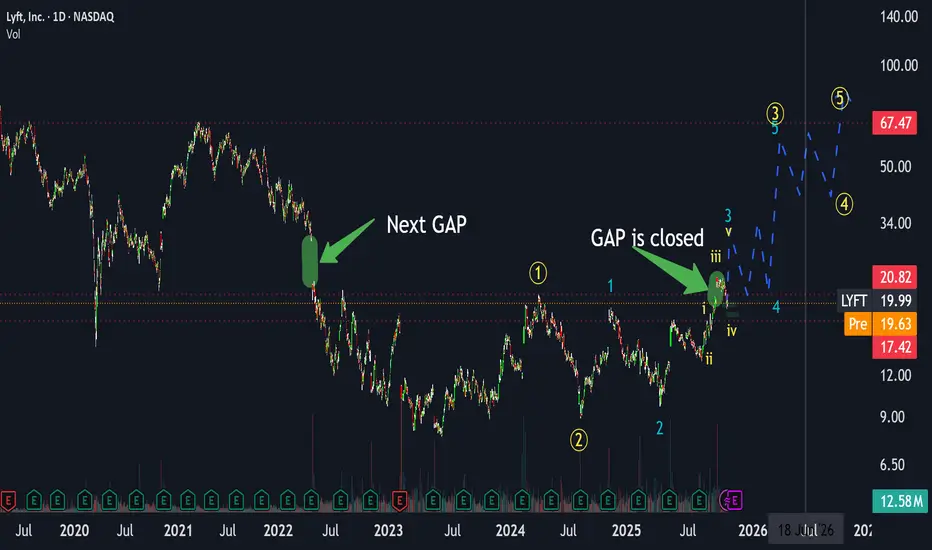
Technically, LYFT has just closed a local gap , exactly as expected.
We are currently finishing the fourth sub-wave of the third global wave .
This means the fifth wave is coming next, and the current target around $70 represents only the peak of the third sub-wave — there is still additional upside expected beyond $70.
In the short term, we could see a retest around $18 ,
followed by the next major move — closing the May 2022 gap near $30 , forming the third wave of this cycle.
After that, some consolidation is likely in the $20–30 range,
followed by the next impulse targeting $50–70 .
This will be the fourth wave pullback, eventually leading into the fifth wave breakout above $70 ,
with potential for even higher upside as the global third wave continues.
Summary
Overall, LYFT shows a perfect mix of improving fundamentals and bullish technical structure.
As I’ve said in my latest videos, this stock could take off soon —
and it remains one of my Top 3 picks for October .
Call to Action
If you enjoy this type of analysis or would like me to review other tickers, tap on rocket 🚀 and leave a ticker in the comments .
I’ll make sure to cover your suggestions in upcoming posts soon!
(Full breakdown and context discussed in my recent videos — you can find them via my profile.)
CAD/JPY – Wedge Breakout Pattern (21.11.2025)📝 Setup Overview OANDA:CADJPY
CAD/JPY has broken below a rising wedge structure, signaling weakening bullish momentum. After multiple rejections at the resistance zone, price is now losing steam below the Ichimoku cloud, showing early bearish pressure.A clean breakout + retest scenario opens the door for downside continuation toward the next demand zones.
📌 Trading Plan📍 Entry Idea:
Look for bearish continuation below the wedge support + cloud rejection.
🎯 Targets (Support Levels):
1st Support: 111.022
2nd Support: 110.561
🛑 Resistance Zone:
112.014 – 112.294
This zone continues to act as a strong supply area where sellers took control repeatedly.
📉 Today’s Fundamentals – Bearish CAD Bias
1️⃣ Crude Oil Pullback → Weakens CAD
Canada’s economy is heavily tied to oil prices. Today’s dip in crude oil puts pressure on the CAD, giving JPY an advantage.
2️⃣ Safe-Haven Demand Supports JPY
With global markets showing risk-off sentiment (concerns over slowing global growth + uncertain central bank guidance), investors favor safe-haven currencies like the Japanese Yen.
3️⃣ BoC Policy Tone Still Cautious
Recent Bank of Canada communications show limited confidence in economic momentum.
Markets expect slower growth → bearish CAD outlook.
➡️ Combination of oil weakness + JPY strength + wedge breakdown = bearish continuation setup.
🔖 Hashtags
#CADJPY #ForexAnalysis #PriceAction #WedgeBreakout #Ichimoku #FXTrading #TechnicalAnalysis #FundamentalAnalysis #SmartMoney #TradingViewCommunity #Kabhi_TA_Trading
⚠️ Disclaimer
This analysis is for educational purposes only.
Not financial advice. Always manage your risk and trade based on your plan.
💬 Support the Work
If you found this analysis helpful, please LIKE & COMMENT on the post ❤️
Your support motivates more high-quality setups daily!

Fundamental Market Analysis for November 21, 2025 GBPUSDThe pound remains under pressure after weak inflation data in the UK: headline CPI fell to 3.6% y/y and core to 3.4%, which has strengthened expectations of a Bank of England rate cut as early as December. Against this backdrop, the dollar retains the upper hand and the US dollar index is holding around 100. The combination of soft price dynamics and a cautious central bank shifts the balance of risks against GBP, limiting investors’ interest in the pound. There are signs of a cooling labour market: unemployment at 5% and wage growth at 4.2% y/y.
Fiscal policy remains a key driver: markets are awaiting the Autumn Budget Statement on 26 November, assessing the room for stimulus and potential borrowing plans. Earlier Treasury data pointed to moderate borrowing volumes, but weak growth dynamics constrain room for manoeuvre. At the same time, demand and labour market conditions in the US remain resilient, supporting the dollar and keeping GBP/USD near the lower end of its recent range. The market is looking for clearer guidance from the Treasury and the Bank of England on the policy path and timing.
Base case: with inflation easing and employment cooling, it is easier for the Bank of England to start a rate-cutting cycle than to tighten conditions further. This narrows the attractiveness of the pound relative to the dollar, which is supported by higher yields and robust US data. The scenario is to sell from 1.31000 with risk control. A turning point is possible if UK data surprise to the upside or the budget contains strong measures to support demand and productivity. Additional focus should be on Bank of England commentary.
Trade recommendation: SELL 1.31000, SL 1.31500, TP 1.30000

EUR/CAD - Bearish Flag (20.11.2025)🧠 Setup Overview TICKMILL:EURCAD
EUR/CAD is forming a clean Bearish Flag Pattern after a strong impulsive drop.
Price is trading below the EMA, inside a rising corrective channel — a classic continuation structure. With cloud resistance above and repeated rejections from the upper flag boundary, bearish momentum is building. A confirmed breakdown below the lower trendline could trigger the next bearish leg.
📊 Trading Plan🔻 Sell Bias (Primary Scenario)
Watch for a candle break & retest below the flag
Enter short after confirmation
🎯 Targets:
1st Support: 1.6137
2nd Support: 1.6109
❌ Invalidation:
A strong candle close above 1.6230 cancels the bearish view
⚡ Fundamental Outlook – Today (20 Nov 2025)
CAD Fundamentals
1️⃣ Canadian Dollar strengthened as crude oil prices saw a mild rebound, supporting CAD (commodity-linked currency).
2️⃣ Bank of Canada remains cautious, but no new signs of easing have emerged — giving CAD some underlying firmness.
EUR Fundamentals
3️⃣ Euro under pressure due to rate-cut expectations in early 2026 as European economic data remains soft, especially in manufacturing.
4️⃣ Risk-off sentiment pushes flows toward safer currencies, indirectly affecting EUR negatively.
➡️ Fundamentals support a continuation move lower for EUR/CAD.
#EURCAD #Forex #BearishFlag #PriceAction #TechnicalAnalysis #EUR #CAD #ForexTrader #TradingSetup #KABHI_TA_TRADING #ChartsDontLieTradersDontQuit #TradingViewCommunity #SupportAndResistance #BreakoutStrategy
⚠️ Disclaimer
This analysis is for educational purposes only.
Not financial advice — always use proper risk management.
💬 Support My Work ❤️
If this setup helps you:👍 LIKE the post💬 COMMENT your view🔔 FOLLOW for daily setups
Your support motivates me to keep posting high-quality analysis!

ETH/USDT 1W review1. Broken uptrend
The black upward trend line has been clearly broken down.
➡️ This is a signal of a change in the market structure from uptrend → downtrend.
⸻
2. The current candle is under the important support of USD 3,070
You marked the ~3070 level as previous support.
Now the price is clearly below it, which suggests:
• breaking support,
• a retest from below may occur,
• continuation of declines is likely.
⸻
3. Another important support on the chart
I see strong levels:
🔴 #1 Support: $2,830 - $2,900 (current price)
This is the zone where the price is trying to hold – but it looks like there is a weak reaction.
🔴 Backer #2: $2,147
This is a wide zone where the upward impulse previously began.
➡️ If ETH drops below 2800-2830, the next logical target is 2150-2200.
⸻
4. RSI (1W) shows a downward trend
• RSI is around 40, which is close to the oversold zone.
• The RSI trend has been down for months.
• No bullish divergence (no trend reversal signal).
➡️ This supports the narrative of further declines.
⸻
5. Candle structure - clear downward momentum
Some previous candles:
• large red bodies,
• no aggressive buying,
• reflections are weak,
• The weekly candle currently looks bearish.
⸻
📊 Technical Summary
Based on the chart:
Short-term and medium-term trends: downward
The price broke key supports
Most likely scenario:
➡️ Continued declines to USD 2,150-2,200
if the 2830 level is broken and the weekly candle closes below.
⸻
📈 When would things look like they would turn around?
Only if:
✔️ Price will return above 3070
✔️ And will maintain a weekly close above this level
✔️ RSI will bounce up and divergence will appear
Then we can talk about a greater chance of returning to 3,500 and beyond.
