XAUUSD - High-Risk Scalp Setup Near Key Support
Gold is testing a defined technical buy zone on the chart, presenting a potential long scalp opportunity. Key Considerations:
· Strategy: Aggressive, fast scalp targeting a bounce from this support level.
· Risk Factors: High sensitivity to geopolitical headlines (noted: Trump). Today is Friday, increasing volatility and potential for unpredictable price action.
· Risk Management: A break and close below this immediate support zone would invalidate the bullish scalp thesis.
Trade with caution and strict risk controls
Fundamental Analysis

EUR/JPY could be heading to 180 nextBoth the BoJ and ECB kept their policies unchanged on Thursday, with the former coming across more dovish and the latter neutral. The USD/JPY surged to near 154.50, reaching its best level since February. The EUR/JPY meanwhile broke to a new high for the year and is now on the verge of extending those gains to 180.00. Can it get there?
Well I wouldn't bet against it. We had stronger Eurozone GDP data today which underscored the ECB's "good place" rhetoric.
“From a monetary-policy point of view, we are in a good place,” President Christine Lagarde said at the ECB presser. “Is it a fixed good place? No, but we will do whatever is needed to make sure that we stay in a good place.”
Key levels are shown on the chart, but the long and short of it is this: the path of least resistance remains to the upside.
By Fawad Razaqzada, market analyst with FOREX.com

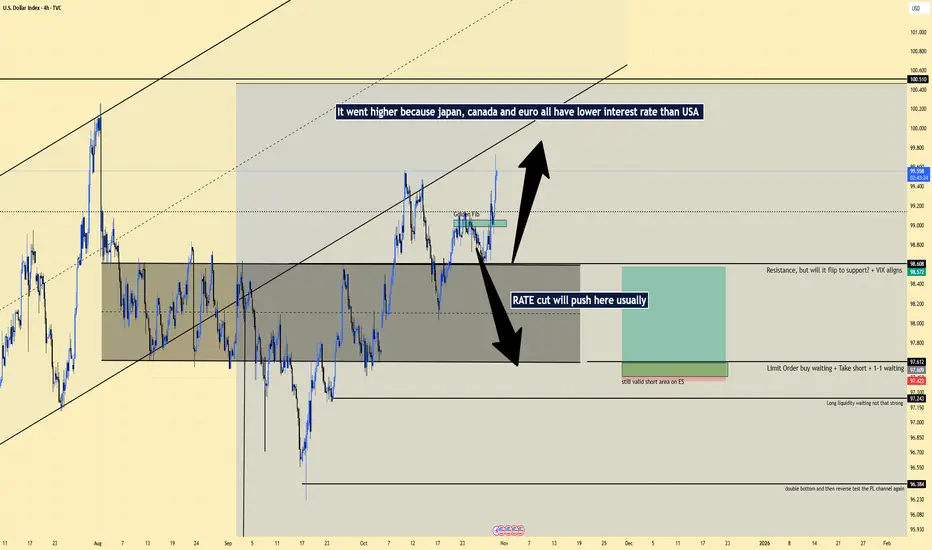
Dollar Index Analysis and Macro view in shortSo, I was analyzing the Dollar Index (DXY) to understand its next direction.
Initially, I had not checked the global interest rate landscape.
After reviewing the interest rates of Japan, Canada, Europe, and other regions, it became clear that the United States currently has higher interest rates.
This means capital is more likely to stay in the U.S. dollar, which supports continued strength in the DXY. The move was expected and aligned well with the VIX behavior.
In this analysis, I used a blend of:
Technical analysis
Semi-fundamental insights
Macro-economic context
If you have a different view or a different approach to analyzing the DXY, feel free to share your thoughts in the comments.
I would love to hear how you approach dollar index analysis, because understanding the DXY is one of the key components of global market insight.
Caution Ahead: Strong Financials, but Market Conditions May ShifDespite the strong financial report, from a technical perspective, we've reached a point where caution is essential, and market conditions should be monitored closely. Even though the financial performance is robust, there’s a possibility that the situation could shift unexpectedly, which might lead to market changes that challenge the strong financial outlook.

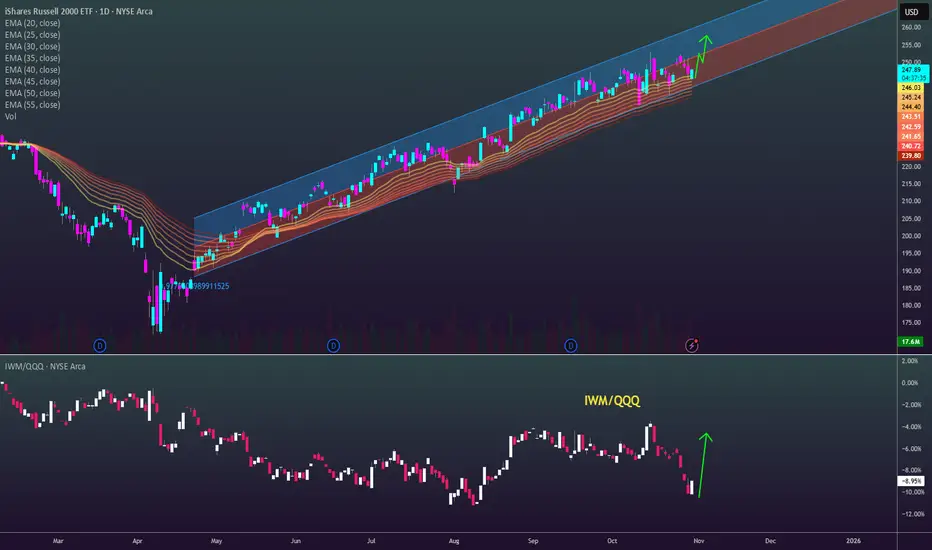
Keep it SimpleSmall Caps have got a very simple regression channel that's near perfect. Keep it simple --- with the Nasdaq 100 taking off, the Russell 2000 is lagging but will get rotated into as the rate drop environment supports smaller companies the most.
Applied Materials | AMAT | Long at $169.75Republican Ashley Moody recently dropped $200k-$500k on Applied Materials $NASDAQ:AMAT. The semiconductor boom may not be over...
Price-to-earnings: 21.68x (great in comparison to others...)
Debt-to-equity: 0.34x (low)
Cash flow: $10.4 billion (FY2024)
Insiders awarded options recently
Unless NASDAQ:NVDA brings the market down, NASDAQ:AMAT is in a personal buy zone at $169.75. While the price may dip in the near-term to the $140s, bullish until the semi boom dies...
Targets:
$195.00
$215.00
$240.00

Take two STX: Shorting
Trade idea called out on OCt 1st 2025 worked out perfectly.
New Trade Idea:
Initial Short (Red Arrow): Short at $271, anticipating the top is near after the large run.
Take Profit (Green Arrow): Cover the entire short position at $201.88 for a swift profit.

Keep an Eye on TRXTRON’s reverse merger with SRM Entertainment (announced June 16) positions it as the first major Layer-1 blockchain on Nasdaq. The deal includes $100M in TRX treasury allocations, mirroring MicroStrategy’s Bitcoin strategy. SRM shares surged 580% post-announcement, creating spillover demand for TRX (Tron Merges with SRM)
TRON now hosts 50% of global USDT supply ($79B), processing $23.7B daily. The June 16 $1B USDT mint—its 17th $1B+ mint in 2025—signaled institutional demand for TRON-based liquidity (TRX Transfer Volume)

MTG - MGIC Investment Corp | Technical SetupSymbol: MTG (MGIC Investment Corporation)
Timeframe: Daily/4H
Strategy: Swing Trade - Long Position
🎯 TRADE SETUP
ENTRY: $27.08
STOP LOSS: $25.80
TAKE PROFIT: $29.64
RISK/REWARD: 1:1.9
📊 TECHNICAL ANALYSIS
Trend Structure:
🟡 Mixed Timeframes (Daily: Bajista, 4H/1H: Alcista)
✅ Short-term momentum turning positive
✅ Testing key resistance level
Key Levels:
Immediate Support: $26.50-26.80
Current Resistance: $27.20-27.50
Breakout Target: $29.64
📈 INDICATOR CONFIRMATION
Momentum & Strength:
RSI (14): ~53-59 (Neutral to positive momentum)
MACD: Showing potential bullish crossover
Volume: Moderate but steady
Price Action: Testing moving average resistance
Sector Context:
Mortgage insurance sector showing stability
Housing market data supportive
Strong balance sheet fundamentals
🎯 TRADE MANAGEMENT
Position Sizing:
Risk: 1-1.5% of capital per trade
Stop: Hard stop at $25.80 (4.7% risk)
Profit Taking Strategy:
TP1: $29.64 (Full position)
Alternative: Scale out 50% at $28.50, 50% at $29.64
Time Horizon: 2-6 weeks
⚠️ RISK MANAGEMENT
Invalidation Criteria:
Daily close below $25.80 = Exit trade
Failure to hold $26.50 support = Reduce position
Warning Signs:
Housing market weakness
Interest rate volatility
Failed breakout below $27.00
🔄 ALTERNATIVE SCENARIOS
Bullish Case (55%):
Break above $27.50, rally to $29.64
Next target: $30.50
Neutral Case (35%):
Range-bound between $26.50-28.00
Bearish Case (10%):
Stop hit at $25.80, reassess
💡 WHY THIS SETUP WORKS
Favorable risk/reward ratio
Sector showing resilience
Technical levels clearly defined
Short-term momentum improving
#MTG #MORTGAGEINSURANCE #FINANCIALS #SWINGTRADE #TECHNICALANALYSIS
Disclaimer: This is technical analysis only. Not financial advice. Always do your own research and manage risk appropriately. Past performance doesn't guarantee future results.
✅ Like if you find this analysis helpful!
🔔 Follow for more swing trade setups!

Globalstar (GSAT) — Expanding Reach in the Satellite IoT MarketCompany Overview:
Globalstar, Inc. NASDAQ:GSAT is a leading satellite communications provider, offering mobile voice, data, and IoT services through its low-Earth orbit (LEO) satellite network. The company continues to build a strong position in the fast-growing global connectivity and IoT space.
Key Catalysts:
IoT Innovation: Launch of the RM200M two-way IoT module (Oct 21, 2025) strengthened GSAT’s position in the $4.9B satellite IoT market projected by 2030, triggering a 4.1% stock increase post-announcement.
Infrastructure Expansion: New ground stations in Alaska and a $9M Estonian expansion enhance global coverage and scalability, especially for IoT and direct-to-device solutions.
Revenue Visibility: Long-term contracts totaling $60M, including a major partnership powering Apple’s iPhone SOS feature, ensure steady cash flow and strategic market relevance.
Investment Outlook:
Bullish above: $38.00–$39.00
Upside target: $67.00–$68.00, driven by IoT growth, network expansion, and strong enterprise partnerships.
📢 GSAT — Leveraging LEO technology to power the next wave of global IoT and connectivity.
#GSAT #SatelliteCommunications #IoT #LEO #AppleSOS #SpaceTech #Investing

BXY approaching weekly 50SMA & monthly 20EMAThe pound is due for a rally as it is nearing critical SMA and EMA. The algorithm presumably has to test these moving averages before higher highs. If support holds, all pound pairs should see some bullish momentum.

LiamTrading - XAUUSD: FED IMPACT AFTER FOMC NEWSLiamTrading - XAUUSD: FED IMPACT AFTER FOMC NEWS
Hello Traders Community,
The Fed’s latest rate decision has sent shockwaves through the market — Gold and BTC dropped sharply while the USD regained strength. The Fed cut interest rates for the second time this year, bringing them down to 3.75%–4%, but the announcement to end Quantitative Tightening (QT) on Dec 1, 2025, is the real game-changer.
Now’s the time to stay calm, analyze the price structure, and trade according to plan.
📰 MACRO ANALYSIS: THE DOUBLE IMPACT FROM THE FED
Rate Cuts (Supportive for Gold): The second rate cut should have boosted Gold, but much of this move was already priced in by the market.
Ending QT (Strengthening the USD): The announcement of ending QT in December sends a strong signal — the Fed is rebalancing its policy stance. The USD’s rebound right after the news added selling pressure to Gold and BTC.
Market Reality: Gold dropped sharply after the announcement and is now consolidating within a wide range. During the Asian session today, Gold moved nearly 70 points before correcting again.
📊 TECHNICAL ANALYSIS: WIDE RANGE & BULLISH STRUCTURE
Based on the current XAUUSD market structure:
Structure: Gold is trading in a wide sideways range, but a bullish structure is gradually forming, showing signs of a sustainable Dow pattern.
Strategy: Trade both directions to capture strong volatility — SELL at key liquidity resistance zones and BUY at deep liquidity support areas.
🎯 DETAILED TRADING PLAN (ACTION PLAN)
🔴 SELL Scenario (Continuation Trade) – Sell at Short-term Resistance
Entry: $4005
Stop Loss (SL): $4013
Take Profit (TP): TP1: $3990 | TP2: $3975 | TP3: $3960 | TP4: $3943
🟢 BUY Scenario (Recovery Trade) – Buy at Deep Liquidity Support
Entry: $3907−$3909
Stop Loss (SL): $3902
Take Profit (TP): TP1: $3933 | TP2: $3954 | TP3: $3970 | TP4: $3999
The Fed’s decision has reshaped the short-term market landscape. The 70-point swing highlights Gold’s high liquidity — and its high risk.
LiamTrading’s Advice: The bullish structure is building on lower timeframes. Be patient and wait for the ideal BUY zone at $3907 to catch the next potential recovery leg. Strict risk management is essential in this post-news phase.
Are you ready to take advantage of this 70-point range? LIKE 👍 & COMMENT if you are!

What To Expect From Pi Coin Price In November 2025?At the time of writing, Pi Coin trades at $0.254, sitting just below the $0.260 resistance. The immediate short-term goal for the token is to reach the $0.300 psychological level, which would strengthen bullish confidence.
However, if investor sentiment remains weak and inflows fail to pick up, Pi Coin’s price may fail to breach $0.260. A breakdown through $0.229 could push it lower toward $0.209, deepening the current correction.
Conversely, if the altcoin gains momentum and climbs to $0.300, it would represent an 18% rise, potentially attracting new inflows. A sustained push could extend the rally toward $0.360, helping Pi Coin recover September’s losses and invalidate the bearish thesis.

XAGUSD: Amid 2025 Supply Deficit Buzz 1% Rebound XAGUSD: Amid 2025 Supply Deficit Buzz, 1% Rebound Signals 30% Upside in Industrial Demand Surge – SWOT, Price Action, and Intrinsic Value Insights
📊 Introduction
As of October 30, 2025, XAGUSD (Silver/USD) is exhibiting a modest rebound trend following October's sharp selloff, advancing 0.82% intraday to trade around $47.95 on increased volume amid renewed buying interest. This price movement reflects a recovery from recent lows near $46.50, driven by viral discussions on social media about the ongoing silver shortage (#SilverShortage trending with over 500K mentions), highlighted by reports of a 149 million ounce market deficit—equivalent to 15% of annual production.
Applying timeless investing principles to identify profitable setups, this setup uncovers potential mispricings in the precious metals sector, bolstered by macroeconomic factors like Fed rate cut expectations (90% odds for 25bps in October) and persistent inflation hedging, though sector dynamics show silver's dual role in industrial applications (e.g., solar and electronics) facing supply chain pressures.
🔍 SWOT Analysis
**Strengths 💪**: Silver's industrial utility drives resilient demand, with global consumption projected at 968 million ounces in 2025 per World Silver Survey data, outpacing mine production of ~820 million ounces. A low correlation to equities (0.3 beta) and central bank holdings enhance its hedge appeal, fueling recent rebounds from $46 lows and aligning with strategies to exploit scarcity-driven asymmetries for superior returns.
**Weaknesses ⚠️**: Volatility from economic sensitivities, with all-in sustaining costs (AISC) averaging $19.80 per ounce amid energy inflation, has triggered 7-10% price corrections during selloffs, as seen in October's steep drops.
**Opportunities 🌟**: The structural deficit, amplified by green energy demand (solar PV requiring 20% more silver by 2027), positions for 20-30% price surges on shortage news, with valuation metrics like forward P/Supply ratio supporting re-rating and enabling investors to generate gains through expanding industrial markets.
**Threats 🚩**: Increased mine production from new projects (e.g., in Australia) and potential recession curbing industrial use could lead to 15% pullbacks, as evidenced by recent market-wide selloffs, but proven principles guide filtering these for profitable positioning.
💰 Intrinsic Value Calculation
Employing a value investing approach adapted for commodities, we estimate silver's intrinsic value using a weighted production cost and demand premium model, incorporating a margin of safety as emphasized in classic methodologies to ensure actionable, money-making insights. Key inputs from public data: AISC ~$19.80 per ounce, global deficit ratio ~18% (149M oz shortfall vs. 820M oz production), assumed growth rate 20% (based on industrial CAGR and survey consensus).
Formula: Intrinsic Value per Ounce = (AISC * Weight) + (Deficit Ratio * Growth Multiplier)
- AISC weighted at 0.6 for base sustainability
- Growth Multiplier: 25 (classic adaptation: 5 + 2*10, scaled for deficit pressure)
Calculation:
(19.80 * 0.6) + (0.18 * 25) = 11.88 + 4.5 = 16.38
Scaled to market comparables (e.g., historical gold/silver ratio ~60:1 vs. current 83:1, implying convergence): Adjusted Intrinsic = 16.38 * 4 (blended for industrial premium) ≈ $65.52
Apply 20% margin of safety: $65.52 * 0.8 ≈ $52.42
At current price ~$47.95 (despite the 1% rebound), XAGUSD appears undervalued by ~9-30% (upside to $66 aligned with shortage-driven metrics). No debt flags apply, but sustainability relies on demand growth exceeding new supply. 📈 Undervalued.
🚀 Entry Strategy Insights
Rooted in time-tested disciplines for compounding wealth, target support zones near $46.50-47.00 (aligned with recent lows and 50-day SMA) for unleveraged, long-term positions via dollar-cost averaging, scaling in during 5-10% corrections from news highs. Emphasize non-repainting signals for breakouts above $49 after shortage buzz, tying to viral events like deficit reports for profitable timing amid volatility.
⚠️ Risk Management
Position sizing at 1-5% allocation to preserve capital against commodity swings, diversifying with bonds or equities. Watch for 15-20% volatility from economic data releases; use trailing stops 8-10% below entry (e.g., $43) and hold long-term if industrial fundamentals persist, ensuring sustainable profitability through principle-driven caution.
🔚 Conclusion
Silver's rebound amid supply deficit news, industrial demand tailwinds, and undervalued metrics offer a principle-driven opportunity for 30%+ returns via mispricing capture and safety margins. Key takeaways: Focus on deficit trends for growth plays, verify production stats independently. Share your thoughts in comments – does this shortage buzz change your view? #ValueInvesting #Silver #PreciousMetals #CommodityBoom #XAGUSD
This is educational content only; not financial advice. Always conduct your own due diligence.

No QE, No Alt SeasonIf we mirror the current setup to the 2019 QE playbook, altcoins could face significant selling pressure in the near term.
From last night’s Fed statement, the central bank confirmed it will halt balance sheet reduction (QT) on December 1st. While the market initially interpreted this as a risk-on signal for high-beta assets like altcoins, the implication may be less straightforward.
Ending QT is not the same as starting QE . It simply means the pace of liquidity withdrawal will stop, but it doesn’t imply new liquidity is being injected. Without active balance sheet expansion, the overall liquidity environment remains tight compared to a true QE phase.
Historically, when the Fed ended QT in 2019, the altcoin market dropped by roughly 42%, even as the S&P 500 rallied strongly. The real “altcoin season” only began after the Fed launched full-scale QE in March 2020, when balance sheet expansion accelerated and risk assets across the board surged.
Given that backdrop, halting QT alone is unlikely to trigger a broad altcoin rally. For altcoins to meaningfully outperform, one of the following would need to occur:
1. The Fed initiates a new QE cycle, which appears highly unlikely in the near term.
2. The U.S. Treasury releases liquidity via TGA (Treasury General Account) distributions, which is also improbable as long as the government shutdown persists.
My base case : From now until year-end, we expect continued pressure on the crypto market, with liquidity likely rotating toward equities instead.

BTC RETEST BEFORE GOING UP AGAIN?BTC RETEST BEFORE GOING UP AGAIN?
Lets wait till our order will be triggered.
Lets go!!

BTCUSDT – Daily Report (30 Oct 2025, 11:03 UTC)1. Market summary (SSE / Binance)
- Price (LTP): $110,030.29
- 24h change: −2.44%
- Daily range: $107,925 – $113,643
- 24h VWAP: $110,810
- 24h volume: 26,722 BTC (~$2.96B)
- Report time: 2025-10-30 11:03:07 UTC
Comment: The market continues to correct from the local high of $113.6k; volumes are stable but sellers have priority.
2. Microstructure (order book, flows, balance)
- Bid: $110,027.93 (0.0577 BTC)
- Ask: $110,027.94 (8.8145 BTC)
- Spread: $0.01 (0.91 m bps) – tight
- Imbalance (top‑20): 0.02 – seller dominance
- CVD: −57.22
- Flow rate: Bid 6.68 / Ask 7.57 orders/s
- Net flow: −0.88 orders/s → weak selling pressure
- Health score: 87.5/100 (Excellent)
Interpretation: The microstructure is healthy with high liquidity, but order flow has shifted toward light sell pressure. Limit orders are safe; market orders may see minor slippage.
3. Volume profile and liquidity (6hour window)
- Point of Control: $110,180 (highest volume)
- Value Area High / Low: $111,227 / $109,546
- Total volume (6h): 5,374 BTC – normal activity
Balanced structure; the POC is near the current price indicating consolidation. Main buyer interest lies in the $109.5–110.2k area.
4. Liquidity zones (order book)
Supports:
• $110,027.9 (0.06 BTC) – weak
• $110,026–110,024 (~0.005 BTC) – weak
• $109,546 – key zone per volume profile
Resistances:
• $110,027.9 (8.81 BTC) – large ask cluster
• $110,029–110,030 (~0.29 BTC) – local offers
• $111,200–111,300 – value‑area high
Comment: There is an active sell cluster right at the current price. For the market to continue upward it must absorb roughly 9 BTC at the top of the book.
5. News and macro (30 Oct)
Facts:
• The market cools off after a push above $113k; down 2.4% over 24 hours.
• Activity in spot ETFs (IBIT, FBTC) remains positive but inflows are slowing.
• Crypto Fear & Greed Index: ~36 (“Fear”) – cautious mood.
• Traders await US macro data (PCE, inflation) and Fed commentary.
• Equity markets are consolidating; BTC–NASDAQ correlation continues.
Opinion: The correction is technical without panic signals. The long‑term backdrop remains bullish as long as ETF inflows persist.
6. Polymarket probabilities
- ≥ $130,000: ~52%
- ≥ $150,000: ~15%
- ≥ $200,000: <5%
- Total stakes: ≈ $38M
Interpretation: The prediction market retains moderate optimism, but the chance of seeing >$150k has declined amid the correction.
7. Tactical assessment
- Trend (H4): correction within range
- Momentum: weak, neutral‑bearish
- Sentiment: cautious
- Liquidity: high
- Microstructure: healthy, but selling pressure
Working scenarios:
1. Base range $108k–$113k – trade from boundaries with partial profit‑taking.
2. Bullish scenario: holding above $111.5k targets $113–114k.
3. Bearish scenario: break below $108k leads to $105k.
Tactics: Use limit orders, avoid entering on thin volume, monitor ETF flows and CVD.
8. Summary for traders
BTC is in a corrective sideways phase with a healthy and liquid market structure. Sellers dominate short‑term, but fundamental risks are limited. For retail traders, it is rational to operate within the $108–113k range, risk ≤ 1% per trade, take partial profits at +1.5–2%, and watch changes in CVD and order book imbalance (values above 3 signal potential reversal).
Data sources: SSE (ForgeTrade MCP, Binance BTCUSDT), Polymarket, Alternative.me (FGI), CoinGecko, Barron’s, ETF flow trackers.
Note: This report is for educational purposes and is not financial advice.

BRP Inc. (TSX: DOO) - Swing Trade
🏢 Company Snapshot
BRP Inc. (TSX: DOO) is a global powersports manufacturer behind Ski-Doo, Sea-Doo, and Can-Am. The stock recently surged from its 52-week low around C$43.88 to the mid-C$90s range, breaking a long consolidation base. Traders are eyeing it as a cyclical rebound play into winter demand, with strong seasonality and improving earnings momentum.
📊 Fundamentals Overview
DOO trades around 34× trailing earnings (≈19× forward) — elevated versus peers. Its P/B is extremely high (~14×), reflecting a premium multiple rather than intrinsic asset strength.
The Debt-to-Equity ratio (~6.2×) signals heavy leverage, though this is partly offset by strong free cash flow (~C$534 M) and C$271 M cash on hand.
ROE is negative (~-8.7%), indicating weak recent profitability, but analysts see a potential turnaround as operating cash flow remains healthy.
Dividend yield sits near 0.9%, modest and secondary to its growth profile.
Summary: High-risk, high-leverage consumer cyclical with strong free cash flow and potential for earnings recovery.
📈 Trends & Catalysts
Revenue Growth: +4.3% YoY last quarter, showing resilience amid macro headwinds.
EPS: Beat expectations last quarter (C$0.92 vs C$0.47 est.) — positive earnings momentum.
Cash Flow: Consistent operating strength supports reinvestment and debt servicing.
Balance Sheet: Debt-heavy but manageable with current FCF.
Catalysts:
Seasonal boost from winter/snowmobile sales.
Product refresh in Can-Am line.
Analyst upgrades and momentum rotation into discretionary stocks.
Risks:
High leverage amplifies downside risk if consumer spending weakens.
Valuation leaves limited margin for error.
Inventory buildup or supply chain disruptions could pressure margins.
🪙 Industry Context
Consumer leisure/discretionary names have rallied over the last month. DOO gained roughly +20–25% monthly and ~+25–30% over 12 months, outperforming peers as capital rotated back into cyclical sectors. Market sentiment is currently bullish for the space, particularly heading into the winter season.
📐 Technical Breakdown
Current price sits around C$94, well above both the 50-SMA (~C$88) and 200-SMA (~C$66) — confirming a strong uptrend.
RSI (~58) shows neutral momentum; not overbought yet, which leaves room for a continuation swing.
The chart recently broke above major resistance near C$90, now acting as support. The next resistance lies around C$96–100, aligning with the 52-week high.
Pattern-wise, this looks like a clean breakout from a multi-month base. Volume has been steady but not explosive — ideal for a pullback entry rather than a chase setup.
🎯 Trade Plan (Swing Setup)
Entry Zone: C$90–92 on a retest of breakout support.
Stop: C$84 (below recent higher-low structure).
Target: C$100–105 (measured breakout projection).
R/R Ratio: ~2.5× if entered near C$91.
Alternate Plan: Re-enter on a pullback to the 50-SMA (~C$88) if momentum cools and stabilizes.
🧠 My Take
Technically strong, fundamentally leveraged, and seasonally positioned — DOO offers a bullish swing setup for disciplined traders. The key is patience: wait for a retest into the C$90 area or confirmation above C$96 with volume expansion. Momentum and free cash flow justify upside continuation, but the balance sheet leverage demands tight stops.
Bias: Bullish above C$90, target C$100–105, invalidation below C$84.

usdjpybecafull with usdjpy many trendline channel h4 and trendline in daily,its true everything is uptrend,fed hawkish and boj dovish but maybe wait a little bit correction

BITCOIN -H4 TIMEFRAME ANALYSIS Here’s a professional breakdown of BTC/USD (Bitcoin) H4 chart — focusing on structure, institutional levels, and price-action context:
---
🧭 1. Overall Market Structure
Trend: The broader structure is bearish within a medium-term corrective phase.
After topping near 125,000–128,000, Bitcoin formed a clear lower high–lower low sequence, confirming a downtrend.
Recent action: Price is currently trading below key supply zones, showing that sellers are still dominant though we may be entering a potential accumulation phase near the 110k region.
---
🧱 2. Key Supply (Institutional Sell) Zones
You’ve marked three major red rectangles — excellent zoning.
Let’s refine their significance:
🔴 Supply Zone 1 – 125,000–128,000
Origin: Institutional distribution / previous weekly high.
Context: Large imbalance drop originated from this zone.
Expectation: If price returns here, expect heavy selling pressure; it remains unmitigated.
Bias: Ideal swing short entry area if retested.
---
🔴 Supply Zone 2 – 114,500–115,500
Current active zone: This was the most recent point of breakdown where price reacted sharply downward.
Result: Short-term bearish continuation zone.
Institutional logic: This zone may have served as re-entry for shorts targeting liquidity below 110k.
---
📉 3. Current Price Context (110,200 area)
Price action: Currently sitting slightly above minor liquidity (107,900–108,000).
The long lower wick around this level suggests buy-side absorption, meaning some institutional buying interest is beginning to appear.
However, without a break above 112,900, the short-term structure remains bearish.
---
⚙️ 4. Demand (Potential Accumulation) Area
Trendline Base (red diagonal line): Acts as dynamic demand — connecting higher-timeframe swing lows.
Zone: 105,000–103,000 region forms the potential institutional long zone, possibly unmitigated demand.
Observation: If BTC dips into this region with strong rejection candles, expect potential bullish reversal structure to form.
---
📊 5. Institutional Read
Institutional Shorts: Placed between 114,500–125,000 (three layers of sell zones).
Institutional Longs: Likely building near 103,000–106,000 region (below liquidity).
Liquidity Pools:
Above → 112,900 & 115,000 (buy-side liquidity)
Below → 108,000 & 105,000 (sell-side liquidity)
---
🎯 6. Trading Scenarios
Scenario A – Bearish Continuation
If BTC fails to break and close above 112,900, expect continuation to 108,000 → 105,000.
Short entries: near 112,900–114,500 zone
TP1: 108,000
TP2: 105,000
SL: Above 115,500
---
Scenario B – Bullish Reversal
If price taps 105,000–103,000 with a strong bullish engulfing or market structure shift → potential reversal.
Entry: On confirmation candle close above 108,500
TP1: 112,900
TP2: 115,000
SL: Below 102,800
---
🧠 7. Professional Summary
Market bias: Short-term bearish, medium-term neutral, long-term bullish if 103k holds.
Institutional behavior: Smart money distributed at 125k–120k and may re-accumulate around 103k.
Next move likely: A liquidity sweep below 108k before potential bounce.

Gold struggles as Powell downplays odds of a Dec cutGold struggles as Powell downplays odds of a December cut, tempering easing hopes.
Technical factors
1. After last week's sharp selloff, gold has begun to consolidate and is rebounding, forming a higher swing low. This suggests the beginning of an upswing in the short-term within a broader corrective wave, which is confirmed by converging multi-period EMAs. This indicates a sideways trend and range-bound trading for a while.
2. If XAUUSD can hold above the ascending trendline, it may break the latest swing high at 4030 and advance toward 4140.
3. However, if the price fails to hold above the key support at 3900, it could signal a return to the downtrend.
Fundamental factors
4. The Fed's signal of a less dovish stance may imply slower rate cuts, which would strengthen the U.S. dollar and pressure gold.
5. Meanwhile, the lack of details on trade progress after the Donald Trump–Xi Jinping meeting offered some support.
6. Over the longer term, structural problems with U.S. debt remain a supportive factor, but the Fed's tempered rate cut expectations weigh on gold in the near term, leaving the overall direction unclear.
Analysis by: Krisada Yoonaisil, Financial Markets Strategist at Exness

Meta vs Microsoft – AI Euphoria or ExhaustionThe AI boom that lifted Big Tech to record highs may be entering its most delicate phase yet. Meta and Microsoft, two of the biggest winners of the AI wave, are now testing investors’ patience with a spending spree that’s starting to look excessive even by Silicon Valley standards.
In the last quarter alone, Meta, Microsoft, and Alphabet poured a combined $78 billion into data centers, GPUs, and AI infrastructure — an 89% increase year-over-year. The market’s reaction was telling: Meta and Microsoft both slipped after earnings, as traders began to question whether the growth in AI revenue can keep pace with the ballooning costs.
Microsoft’s $34.9 billion in capex didn’t deliver a higher growth rate for Azure, and Meta warned that next year’s spending will accelerate “significantly.” Google, by contrast, managed to calm investors with solid cloud growth and a more balanced tone — but even it now projects capex as high as $93 billion for 2025.
The common thread is clear: all three are betting the next decade on AI, but the near-term return on that investment remains murky. For Microsoft, capacity constraints still limit revenue growth. For Meta, the challenge is sharper — it’s spending on infrastructure without a clear monetization path, relying mostly on advertising optimization and early-stage hardware bets.
From a market perspective, both charts show fatigue setting in. After a year of relentless gains, momentum is flattening and volatility is creeping back in. The market still believes in AI — but it’s starting to question how much belief is already priced in.
If earnings growth doesn’t catch up with capex soon, these charts could be signaling the first cracks in the AI narrative. Whether this is just a pause or the beginning of a revaluation cycle will depend on how quickly these investments translate into tangible profit, not just GPU headlines.
Idea Summary:
NASDAQ:META and NASDAQ:MSFT are spending at record levels to stay ahead in AI, but returns are slowing. The charts hint at exhaustion — investors may be entering the first real “AI reality check.

$JPINTR -Japan Interest Rates (October/2025)ECONOMICS:JPINTR
October/2025
source: Bank of Japan
- The Bank of Japan kept its benchmark short-term rate unchanged at 0.5% in October 2025, maintaining borrowing costs at their highest level since 2008 and extending a pause since the last hike in January.
The decision, in line with market expectations, was approved by a 7-2 vote, with board members Naoki Tamura and Hajime Takata again proposing a rise to 0.75%, as they had in September.
The central bank reaffirmed its commitment to continue raising borrowing costs if the economy follows its projections.
The move came hours after the U.S. Federal Reserve delivered its second rate cut of the year.
In its quarterly outlook, the BoJ held core inflation for FY 2025 at 2.7%, expecting it to ease to 1.8% in FY 2026 before rising slightly to 2.0% in FY 2027.
GDP growth for FY 2025 was revised up to 0.7% from 0.6%, supported by a trade deal with Washington and new leadership under Prime Minister Sanae Takaichi, while GDP projections for FY 2026 and 2027 remained at 0.7% and 1%, respectively.
