Pour Yourself A "Cup" of Cola, Grab A Share of KONYSE:KO has made a 61.8% Fibonacci Retracement of the Low @ $60.62 to the High @ $74.38 and begun to form what looks to be a Cup and Handle Pattern!!
On Wednesday, Price on NYSE:KO managed to Confirm the Pattern by reaching the Equal High of $71.61, completing the "Cup".
Now based on the Cup and Handle Pattern, we want to see Price make a Retracement to form the "Handle" of the Pattern and currently Price on NYSE:KO is falling. We can expect Price will Close the Gap from Last Week and find Support at the 50% Fibonacci Level @ $68.48.
Once the Retracement is successful, we should see Price move up to Complete the "Handle" and Pattern altogether!
Fundamentally, NYSE:KO CFO, John Murphy, plans to make changes to products with affordability in todays economy in mind for both High and Low income earners.
www.tradingview.com
NYSE:KO also posted greater than forecasted Earnings for Q3 this year!
www.tradingview.com
If Technicals and Fundamentals can align, NYSE:KO may be a great company to get stock in soon!
Fundamental Analysis

[EURNZD] Trade ideaLong opportunity on this pair after FOMC the move should be clean. Targeting the previous high and probably even higher next ...
Great Trade !

Gold Price Analysis – Will Bears Drag XAUUSD Below 3900?Gold continues to trade within a clear downward structure facing consistent resistance near the 4040–4060 zone while maintaining pressure below key descending trendlines. Price recently confirmed another Change of Character (ChoCH) near the 3972 level suggesting bearish continuation. The projection shows potential short-term pullbacks toward 3980–4000 followed by a deeper drop toward targets at 3901 and 3857.
Unless bulls reclaim the 4063–4128 resistance the overall bias remains bearish with expectations of further downside toward the $3,816–$3,850 support range.
Regarding the Fed meeting tomorrow markets widely expect a 25 bps rate cut which is already priced in. The real impact will come from the Fed speech if the Fed hints at further easing (a dovish stance) gold may bounce higher as the dollar weakens. But if the Fed sounds cautious or signals a pause gold could drop sharply as yields and dollar strength return. Overall trend remains bearish traders should stay alert to post Fed volatility as it could temporarily disrupt or confirm the next major move.
🔴 Sell Zone:
The main sell zone is between 4150-4200 which aligns with the upper resistance range and the top boundary of the descending channel. This area has repeatedly acted as a rejection point where sellers step in aggressively. If price retraces into this zone and forms bearish confirmation candles it becomes a strong region to look for short entries.
⚡ Sell Trigger Area:
The sell trigger area lies around 4000 which is a key psychological and structural level. A confirmed break and candle close below 4000 would likely trigger renewed bearish momentum opening the way toward 3901-3857 as next downside targets. This break would confirm continuation of the bearish wave and strengthen the short bias.
Note
Please risk management in trading is a Key so use your money accordingly. If you like the idea then please like and boost. Thank you and Good Luck!

BXY approaching weekly 50SMA & monthly 20EMAThe pound is due for a rally as it is nearing critical SMA and EMA. The algorithm presumably has to test these moving averages before higher highs. If support holds, all pound pairs should see some bullish momentum.

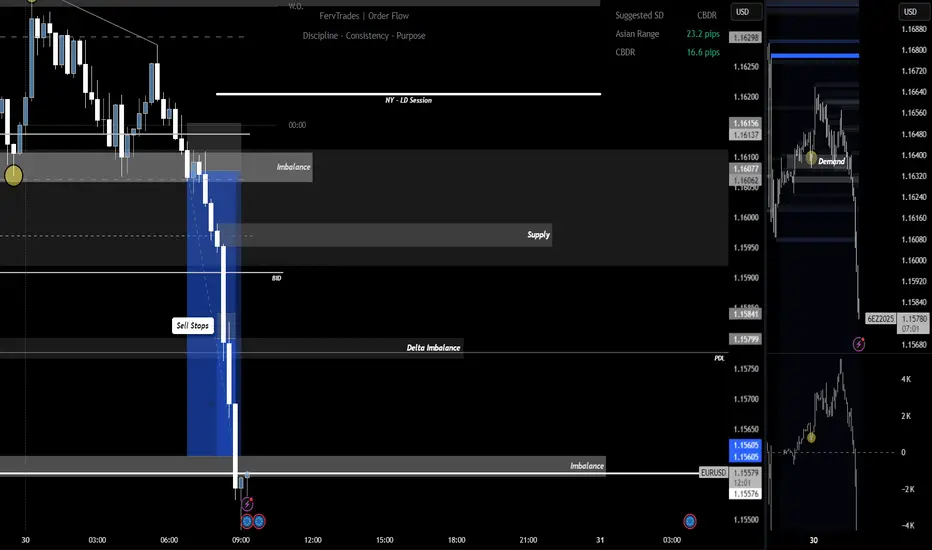
The Value of Comparing Futures and CFD DataComparing futures and CFD (Contract for Difference) data is critical for serious traders, especially when executing and validating trades like shorts.
Futures Data:
Why Compare Futures and CFD Data?
True Market Sentiment: Futures contracts (such as the 6E - Euro FX futures) are traded on centralized exchanges, reflecting authentic supply, demand, institutional volume, and order flow. CFDs, on the other hand, are broker-issued products that mirror price but may not fully represent actual market transactions or sentiment.
Volume Profile Analysis: Futures charts (e.g., shown in 6E1 image) provide reliable volume by price (VBP) and order flow, helping traders pinpoint genuine support/resistance, point of control, and liquidity zones. CFD platforms often lack transparent volume data.
Validating Signals: If both CFD (EURUSD) and futures (6EZ2025) show confluence such as downside imbalances, sell stops being triggered, and volume confirming breakouts the setup is reinforced and less likely to be a broker-induced anomaly.
Avoiding Broker Manipulation: CFDs may show price spikes or "stop hunts" not reflected in the real futures market, leading to false signals. Comparing both datasets helps filter out noise and manipulation.
Why the Short Trade is Valid
Order Flow Confirmation: Both charts highlight heavy sell-side activity. The futures chart shows a breakdown below key value areas with volume shifting lower, confirming institutional selling and bearish momentum.
Imbalance and Sell Stops: On the EURUSD CFD chart, a clear delta imbalance and a cascade of sell stops below a key level indicate aggressive shorting and stop-loss liquidity being absorbed, reinforcing bearish bias.
Confluence Across Markets: The simultaneous confirmation futures breaking down with volume, CFD reflecting price action and order flow provides confidence in the short setup's validity. Such dual confirmation reduces risk and signals a higher likelihood of follow-through.
In summary:
Comparing CFD price action with real futures order flow and volume enables traders to validate setups, spot manipulation, and execute trades with increased conviction. For this short trade, the confluence across both datasets confirms genuine sell-side momentum and a valid trading opportunity.
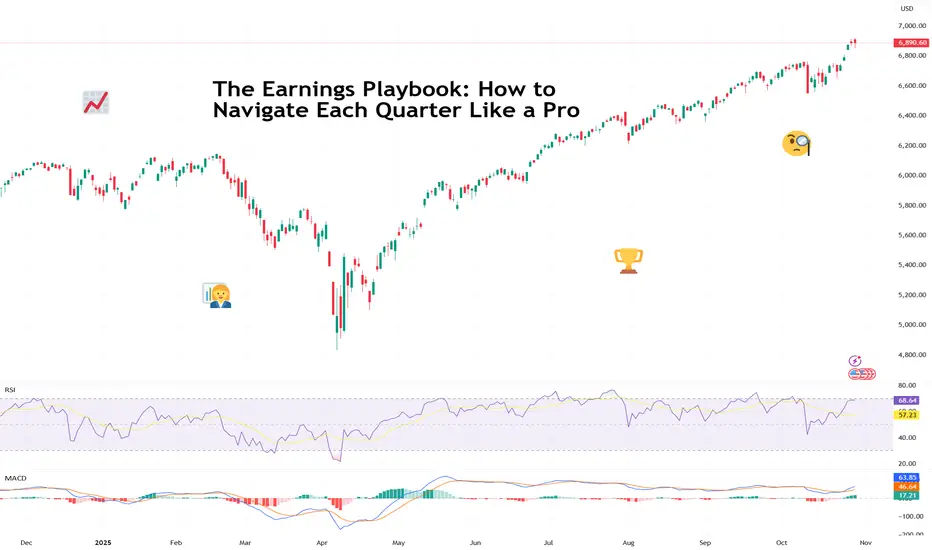
The Earnings Playbook: How to Navigate Each Quarter Like a ProTraders are in the heat of the earnings season and euphoria is sweeping every corner of the market.
The charts twitch, traders stop talking about the Fed for five minutes ( not this week, though ), and online forums turn into a parade of watch-me-trade sessions.
It’s that glorious stretch when companies pop open the books and reveal what’s really been happening behind the scenes.
For professional investors, it’s data heaven. For retail traders, it’s emotional cardio. Stocks can rise 20% on a single upbeat forecast — or plummet before your coffee cools. The trick isn’t just to survive it. It’s to navigate it like a pro.
💼 Know the Seasons (and the Mood Swings)
Earnings season comes four times a year — January, April, July, and October — and each has its own flavor.
Q1 (April): That’s the hangover quarter. Holiday sales meet new-year cost cuts. Traders recalibrate expectations and reality collides with ambition.
Q2 (July): The mid-year checkup. CEOs brag about “momentum,” analysts start sharpening their red pencils. Markets get twitchy.
Q3 (October): The credibility test. Guidance revisions and cautious tones dominate. If the year’s been good, this is where the victory laps start.
Q4 (January): The scoreboard reveal. Everyone tallies their annual wins and losses, and traders begin to bet on who carries the next year’s momentum.
Each cycle has a similar rhythm: hype, reaction, digestion, and speculation. Think of it like a four-act play.
📊 Mind the Gap
One thing to keep in mind whenever you find yourself in the earnings bonanza: the actual numbers matter less than the narrative. ( Looking at you, Oracle NYSE:ORCL )
A company can beat on revenue, miss on profit, and still rally — if the CEO sells a compelling story about the next quarter. Conversely, it can post record earnings and tank because analysts wanted even more.
The pros know to look beyond the headline EPS. They dig into guidance, margins, and segment performance. Is revenue growing because of genuine demand, or just creative accounting? Are margins improving, or did the company quietly cut R&D?
Markets don’t price what’s happened — they price what’s next. That’s especially true for growth stocks like t echnology companies .
🎯 Don’t Chase the Knee-Jerk
Every earnings season has its share of instant overreactions — the “up 10% at open, down 8% by lunch” kind of chaos. That’s when seasoned traders sit back and let volatility do the heavy lifting.
Smart money avoids buying into the frenzy or shorting into despair. Instead, they wait for the second move — when dust settles, algorithms calm down, and humans return to their desks.
🧠 Build Your Own Playbook
To trade earnings season like a pro, you need a plan. Here’s how the veterans prep:
Start early. Check the earnings calendar and mark high-impact names in your portfolio or watchlist.
Study the setup. Look at how the stock’s performed heading into earnings. A big pre-report rally can mean expectations are too high.
Focus on guidance. Earnings beats are old news — future commentary moves markets.
Use position sizing. Never bet the farm on one report. Even the best setups can go sideways.
Don’t forget the macro. Rate cuts, inflation prints, or a stray tweet from the US President can overshadow the best earnings beat.
🕹️ The Big Picture: Earnings as Market GPS
Earnings season is the market’s health check because it tells you which sectors are thriving, which are limping, and how CEOs feel about the future (watch the language: “headwinds” and “volatility” are polite ways of saying buckle up).
Taken together, earnings trends shape the broader narrative — from interest rate expectations to sector rotations. In other words, earnings season is where short-term trading meets long-term investing.
Now go and prepare for the next batch of earnings — Big Tech is on deck this week with Apple NASDAQ:AAPL and Amazon NASDAQ:AMZN reporting today.
Off to you : What’s your strategy this earnings season? Buying the hype or waiting to buy the dip? Share your thoughts in the comments!

GBPCAD: Inflation Diverges Between UK and CanadaGBPCAD: Inflation Diverges Between UK and Canada
On Friday, October 17, 2025, GBPCAD formed a false bullish rally, which became evident once the pair resumed its downward movement after confirming a higher high.
The decline accelerated after the Bank of Canada reported a rise in core CPI inflation to 2.8%, up from 2.6% in August.
Today, the Bank of England released its CPI data, showing a slowdown to +3.8% year-on-year, below expectations of +4.0%.
These inflation readings have shifted market sentiment and expectations regarding the next moves from both central banks, putting additional pressure on GBPCAD.
The pair may pause temporarily as traders digest the data, but the downtrend is likely to continue, with potential targets at 1.8560 and 1.8420.
You may find more details in the chart!
Thank you and Good Luck!
❤️PS: Please support with a like or comment if you find this analysis useful for your trading day❤️

LiamTrading - XAUUSD: FED IMPACT AFTER FOMC NEWSLiamTrading - XAUUSD: FED IMPACT AFTER FOMC NEWS
Hello Traders Community,
The Fed’s latest rate decision has sent shockwaves through the market — Gold and BTC dropped sharply while the USD regained strength. The Fed cut interest rates for the second time this year, bringing them down to 3.75%–4%, but the announcement to end Quantitative Tightening (QT) on Dec 1, 2025, is the real game-changer.
Now’s the time to stay calm, analyze the price structure, and trade according to plan.
📰 MACRO ANALYSIS: THE DOUBLE IMPACT FROM THE FED
Rate Cuts (Supportive for Gold): The second rate cut should have boosted Gold, but much of this move was already priced in by the market.
Ending QT (Strengthening the USD): The announcement of ending QT in December sends a strong signal — the Fed is rebalancing its policy stance. The USD’s rebound right after the news added selling pressure to Gold and BTC.
Market Reality: Gold dropped sharply after the announcement and is now consolidating within a wide range. During the Asian session today, Gold moved nearly 70 points before correcting again.
📊 TECHNICAL ANALYSIS: WIDE RANGE & BULLISH STRUCTURE
Based on the current XAUUSD market structure:
Structure: Gold is trading in a wide sideways range, but a bullish structure is gradually forming, showing signs of a sustainable Dow pattern.
Strategy: Trade both directions to capture strong volatility — SELL at key liquidity resistance zones and BUY at deep liquidity support areas.
🎯 DETAILED TRADING PLAN (ACTION PLAN)
🔴 SELL Scenario (Continuation Trade) – Sell at Short-term Resistance
Entry: $4005
Stop Loss (SL): $4013
Take Profit (TP): TP1: $3990 | TP2: $3975 | TP3: $3960 | TP4: $3943
🟢 BUY Scenario (Recovery Trade) – Buy at Deep Liquidity Support
Entry: $3907−$3909
Stop Loss (SL): $3902
Take Profit (TP): TP1: $3933 | TP2: $3954 | TP3: $3970 | TP4: $3999
The Fed’s decision has reshaped the short-term market landscape. The 70-point swing highlights Gold’s high liquidity — and its high risk.
LiamTrading’s Advice: The bullish structure is building on lower timeframes. Be patient and wait for the ideal BUY zone at $3907 to catch the next potential recovery leg. Strict risk management is essential in this post-news phase.
Are you ready to take advantage of this 70-point range? LIKE 👍 & COMMENT if you are!

Will XRP Form a Death Cross or Repeat July 2025 Rally?At the time of writing, XRP trades at $2.55, holding slightly above the crucial $2.54 support level. The altcoin needs renewed bullish activity to break through resistance at $2.64, which would confirm upward momentum.
If the Death Cross materializes, XRP could face a short-term correction, possibly dropping toward $2.35 or lower. Such a decline might trigger short-lived selling as traders react to the technical setup.
Conversely, if investor maturity continues to grow, XRP could replicate its July 2025 breakout. A successful push above $2.64 could propel the token toward $2.75 and potentially $2.85. This would invalidate the bearish outlook and reigniting bullish sentiment

What To Expect From Pi Coin Price In November 2025?At the time of writing, Pi Coin trades at $0.254, sitting just below the $0.260 resistance. The immediate short-term goal for the token is to reach the $0.300 psychological level, which would strengthen bullish confidence.
However, if investor sentiment remains weak and inflows fail to pick up, Pi Coin’s price may fail to breach $0.260. A breakdown through $0.229 could push it lower toward $0.209, deepening the current correction.
Conversely, if the altcoin gains momentum and climbs to $0.300, it would represent an 18% rise, potentially attracting new inflows. A sustained push could extend the rally toward $0.360, helping Pi Coin recover September’s losses and invalidate the bearish thesis.

XAGUSD: Amid 2025 Supply Deficit Buzz 1% Rebound XAGUSD: Amid 2025 Supply Deficit Buzz, 1% Rebound Signals 30% Upside in Industrial Demand Surge – SWOT, Price Action, and Intrinsic Value Insights
📊 Introduction
As of October 30, 2025, XAGUSD (Silver/USD) is exhibiting a modest rebound trend following October's sharp selloff, advancing 0.82% intraday to trade around $47.95 on increased volume amid renewed buying interest. This price movement reflects a recovery from recent lows near $46.50, driven by viral discussions on social media about the ongoing silver shortage (#SilverShortage trending with over 500K mentions), highlighted by reports of a 149 million ounce market deficit—equivalent to 15% of annual production.
Applying timeless investing principles to identify profitable setups, this setup uncovers potential mispricings in the precious metals sector, bolstered by macroeconomic factors like Fed rate cut expectations (90% odds for 25bps in October) and persistent inflation hedging, though sector dynamics show silver's dual role in industrial applications (e.g., solar and electronics) facing supply chain pressures.
🔍 SWOT Analysis
**Strengths 💪**: Silver's industrial utility drives resilient demand, with global consumption projected at 968 million ounces in 2025 per World Silver Survey data, outpacing mine production of ~820 million ounces. A low correlation to equities (0.3 beta) and central bank holdings enhance its hedge appeal, fueling recent rebounds from $46 lows and aligning with strategies to exploit scarcity-driven asymmetries for superior returns.
**Weaknesses ⚠️**: Volatility from economic sensitivities, with all-in sustaining costs (AISC) averaging $19.80 per ounce amid energy inflation, has triggered 7-10% price corrections during selloffs, as seen in October's steep drops.
**Opportunities 🌟**: The structural deficit, amplified by green energy demand (solar PV requiring 20% more silver by 2027), positions for 20-30% price surges on shortage news, with valuation metrics like forward P/Supply ratio supporting re-rating and enabling investors to generate gains through expanding industrial markets.
**Threats 🚩**: Increased mine production from new projects (e.g., in Australia) and potential recession curbing industrial use could lead to 15% pullbacks, as evidenced by recent market-wide selloffs, but proven principles guide filtering these for profitable positioning.
💰 Intrinsic Value Calculation
Employing a value investing approach adapted for commodities, we estimate silver's intrinsic value using a weighted production cost and demand premium model, incorporating a margin of safety as emphasized in classic methodologies to ensure actionable, money-making insights. Key inputs from public data: AISC ~$19.80 per ounce, global deficit ratio ~18% (149M oz shortfall vs. 820M oz production), assumed growth rate 20% (based on industrial CAGR and survey consensus).
Formula: Intrinsic Value per Ounce = (AISC * Weight) + (Deficit Ratio * Growth Multiplier)
- AISC weighted at 0.6 for base sustainability
- Growth Multiplier: 25 (classic adaptation: 5 + 2*10, scaled for deficit pressure)
Calculation:
(19.80 * 0.6) + (0.18 * 25) = 11.88 + 4.5 = 16.38
Scaled to market comparables (e.g., historical gold/silver ratio ~60:1 vs. current 83:1, implying convergence): Adjusted Intrinsic = 16.38 * 4 (blended for industrial premium) ≈ $65.52
Apply 20% margin of safety: $65.52 * 0.8 ≈ $52.42
At current price ~$47.95 (despite the 1% rebound), XAGUSD appears undervalued by ~9-30% (upside to $66 aligned with shortage-driven metrics). No debt flags apply, but sustainability relies on demand growth exceeding new supply. 📈 Undervalued.
🚀 Entry Strategy Insights
Rooted in time-tested disciplines for compounding wealth, target support zones near $46.50-47.00 (aligned with recent lows and 50-day SMA) for unleveraged, long-term positions via dollar-cost averaging, scaling in during 5-10% corrections from news highs. Emphasize non-repainting signals for breakouts above $49 after shortage buzz, tying to viral events like deficit reports for profitable timing amid volatility.
⚠️ Risk Management
Position sizing at 1-5% allocation to preserve capital against commodity swings, diversifying with bonds or equities. Watch for 15-20% volatility from economic data releases; use trailing stops 8-10% below entry (e.g., $43) and hold long-term if industrial fundamentals persist, ensuring sustainable profitability through principle-driven caution.
🔚 Conclusion
Silver's rebound amid supply deficit news, industrial demand tailwinds, and undervalued metrics offer a principle-driven opportunity for 30%+ returns via mispricing capture and safety margins. Key takeaways: Focus on deficit trends for growth plays, verify production stats independently. Share your thoughts in comments – does this shortage buzz change your view? #ValueInvesting #Silver #PreciousMetals #CommodityBoom #XAGUSD
This is educational content only; not financial advice. Always conduct your own due diligence.

USD/JPY Upside Potential Buy SetupUSD/JPY is positioned near 153.600, showing signs of upside potential as the yen softens and the dollar remains robust. Momentum could carry the pair toward the next resistance zone if support holds and sentiment remains favorable.
Key Levels:
Buy Entry: 153.600
Take Profit: 154.017
Stop Loss: 153.250
Reasoning:
Technically, the pair is forming a base around 153.600, with recent consolidations hinting at a breakout toward 154.017.
Fundamentally, the yen continues to face pressure while the Bank of Japan remains cautious and the U.S. Federal Reserve maintains policy divergence—supporting dollar-yen strength. Recent comments from finance officials in the U.S. and Japan also suggest that exchange rates reflect fundamentals, reducing immediate intervention risk.
Disclaimer:
This analysis is for educational purposes only and does not constitute financial advice.

No QE, No Alt SeasonIf we mirror the current setup to the 2019 QE playbook, altcoins could face significant selling pressure in the near term.
From last night’s Fed statement, the central bank confirmed it will halt balance sheet reduction (QT) on December 1st. While the market initially interpreted this as a risk-on signal for high-beta assets like altcoins, the implication may be less straightforward.
Ending QT is not the same as starting QE . It simply means the pace of liquidity withdrawal will stop, but it doesn’t imply new liquidity is being injected. Without active balance sheet expansion, the overall liquidity environment remains tight compared to a true QE phase.
Historically, when the Fed ended QT in 2019, the altcoin market dropped by roughly 42%, even as the S&P 500 rallied strongly. The real “altcoin season” only began after the Fed launched full-scale QE in March 2020, when balance sheet expansion accelerated and risk assets across the board surged.
Given that backdrop, halting QT alone is unlikely to trigger a broad altcoin rally. For altcoins to meaningfully outperform, one of the following would need to occur:
1. The Fed initiates a new QE cycle, which appears highly unlikely in the near term.
2. The U.S. Treasury releases liquidity via TGA (Treasury General Account) distributions, which is also improbable as long as the government shutdown persists.
My base case : From now until year-end, we expect continued pressure on the crypto market, with liquidity likely rotating toward equities instead.

BTC RETEST BEFORE GOING UP AGAIN?BTC RETEST BEFORE GOING UP AGAIN?
Lets wait till our order will be triggered.
Lets go!!

#XRPUSDT: Swing Buy At 2.60, Possible Target At 3.50! We have strong bullish confirmation in smaller time frames that we can take a swing buy entry on XRPUSDT. There is a single major target at 3.50 but the price could move beyond that region. Please like and comment on the next cryptocurrency pair you would like us to analyse.
Team Setupsfx

EURUSD Finds Its Footing Bulls Step Back In.EURUSD continues to recover from its support zone after a clean rebound, showing signs of a short-term bullish correction. The pair formed a Fair Value Gap (FVG) and now aims to retest the resistance area as buyers step in above key intraday support.
Key Levels:
Buy Entry: 1.16150
Take Profit: 1.16450
Stop Loss: 1.15990
Reasoning:
Technically, the market has confirmed a break of structure followed by strong rejection from the support zone, forming higher lows that signal bullish intent. The FVG area supports the idea of a potential push toward resistance.
Fundamentally, slight weakness in the U.S. dollar and improving Euro sentiment ahead of upcoming data favor a short term upside move.
Disclaimer:
This analysis is for educational purposes only and not financial advice. Always manage risk before executing any trade.

XAUUSD 15m | Liquidity Sweep → Demand Zone → Bullish ContinuatioAfter a clean liquidity sweep below the previous low (marked with the $ sign), price reacted strongly from a demand zone, showing a shift in market structure to the upside.
We’ve since seen a bullish displacement that created a Fair Value Gap (FVG) and a clear retest zone where price is now reacting.
This setup aligns with a short-term bullish bias, aiming for a continuation toward higher liquidity resting above recent swing highs.
⸻
📊 Setup Breakdown:
• Pair: XAUUSD
• Timeframe: 15m
• Bias: Bullish
• Entry: ~3970
• Stop-Loss: 3883.9
• Target: 4151
• Risk-to-Reward: ~1:4
⸻
🔍 Confluences:
• Liquidity sweep below equal lows
• Strong bullish displacement and market structure shift
• Price mitigating demand zone / FVG
• Clean imbalance above targeting liquidity at 4,150
⸻
🧠 Trade Idea:
Looking for continuation toward 4,150 as long as 3,913 holds. Any deeper retrace into the demand zone is still valid as long as structure remains intact.
⸻
#XAUUSD #Gold #SmartMoney #PriceAction #LiquiditySweep #FVG #TradingView #ICTConcepts

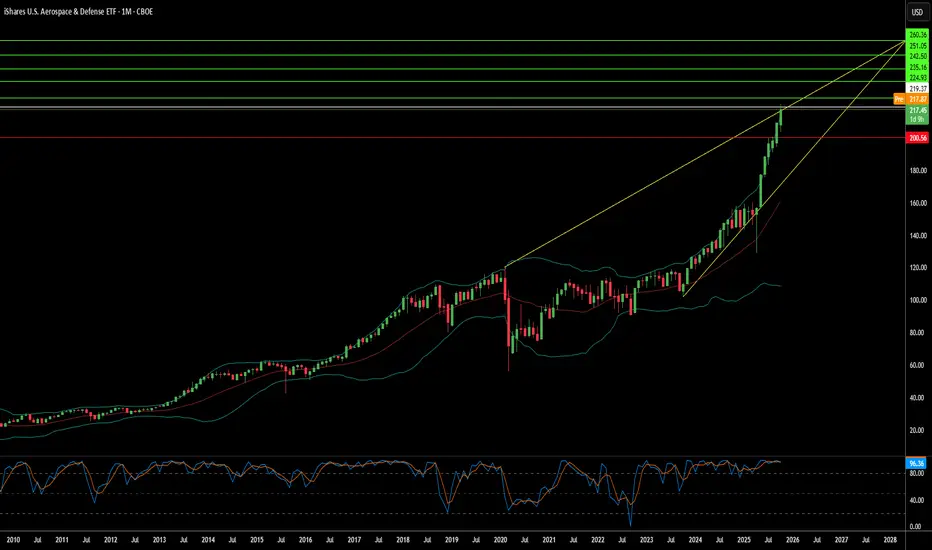
Can Instability Be an Asset Class?Aerospace and Defense (A&D) ETFs have shown remarkable performance in 2025, with funds like XAR achieving a 49.11% year-to-date return. This surge follows President Trump's October 2025 directive to resume U.S. nuclear weapons testing after a 33-year moratorium, a decisive policy shift responding to recent Russian weapons demonstrations. The move signals the formalization of Great Power Competition into a sustained, technology-intensive arms race, transforming A&D spending from discretionary to structurally mandatory. Investors now view defense appropriations as a guaranteed source of funding, creating what analysts call a permanent "instability premium" on sector valuations.
The financial fundamentals supporting this outlook are substantial. The FY2026 defense budget allocates $87 billion for nuclear modernization alone, a 26% increase in funding for critical programs like the B-21 bomber, Sentinel ICBM, and Columbia-class submarines. Major contractors are reporting exceptional results: Lockheed Martin established a record $179 billion backlog while raising its 2025 outlook, effectively creating multi-year revenue certainty that functions like a long-duration bond. In 2023, global military spending reached $2.443 trillion, with NATO allies driving over $170 billion in U.S. foreign military sales, which extended revenue visibility beyond domestic congressional cycles.
Technological competition is accelerating investments in hypersonics, digital engineering, and modernized command-and-control systems. The shift toward AI-driven warfare, resilient space-based architectures, and advanced manufacturing processes (exemplified by Lockheed's digital twin technology for the Precision Strike Missile program) is transforming defense contracting into a hybrid hardware-software model with sustained high-margin revenue streams. The modernization of Nuclear Command, Control, and Communications (NC3) systems and implementation of Joint All-Domain Command and Control (JADC2) strategy require continuous, multi-decade investments in cybersecurity and advanced integration capabilities.
The investment thesis reflects structural certainty: legally mandated nuclear modernization programs are immune to typical budget cuts, contractors hold unprecedented backlogs, and technological superiority demands perpetual high-margin research and development. The resumption of nuclear testing, driven by strategic signaling rather than technical necessity, has created a self-fulfilling cycle that guarantees future expenditures. With geopolitical escalation, macroeconomic certainty through front-loaded appropriations, and rapid technological innovation converging simultaneously, the A&D sector has emerged as an essential component of institutional portfolios, supported by what analysts characterize as "geopolitics guaranteeing profits."
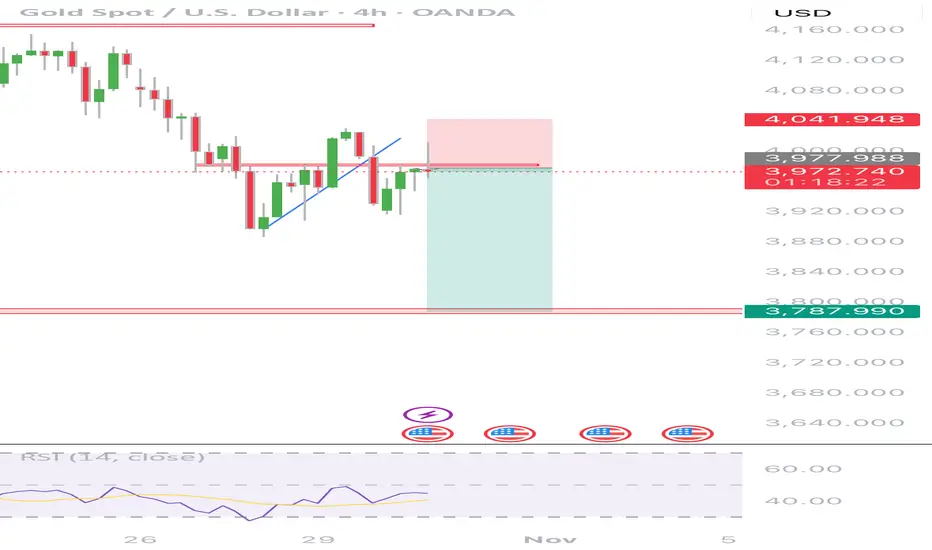
Gold 4-Hour Timeframe Analysis(Nuclear testing Resumed)Gold appears to be setting up for another potential short opportunity. Despite yesterday’s rate-cut announcement, price action showed limited bullish momentum, even after Chair Powell signaled the likelihood of an additional cut in December. This lack of upside response suggests continued bearish sentiment.
Additionally, geopolitical risk remains elevated. Reports indicate former President Trump may push to resume nuclear testing, in response to President Putin’s recent strategic posturing and threats involving advanced weapons systems. While such developments typically support safe-haven assets, gold has yet to reflect meaningful bullish follow-through following these headlines.
Overall, current structural behavior on the 4-hour chart continues to favor bearish movement unless a significant shift in fundamentals or market sentiment emerges
Zoom out $DOGE Dogecoin long-term structure intact.
Multi year accumulation completing.
Momentum is building quietly, just like before every explosion.
The next bull wave isn’t a dream, it’s a realite.

Gold 30 Mints Resistance Rejection SetupGold is showing signs of weakness after retesting the 30-minute resistance area, following a clear break of structure. The market currently respects the lower high formation, suggesting a potential short-term correction toward the support zone as sellers regain control.
Key Levels:
Sell Entry: 3980
Take Profit: 3950
Stop Loss: 4000
Reasoning:
Technically, the price has completed a structure break and is now retesting previous resistance, turning it into a new supply zone. Candlestick behavior shows bearish pressure, supporting a short setup.
Fundamentally, stronger U.S. dollar sentiment and cautious risk tone before upcoming U.S. data keep gold under pressure.
Disclaimer:
This analysis is for educational purposes only and not financial advice. Always manage risk and follow your own trading plan before executing any trade.

Stronger dollar, ETF outflows: buy only confirmed dips__________________________________________________________________________________
Market Overview
__________________________________________________________________________________
BTC is consolidating after a reject below 115–116k, holding above 111.7k/110k in a corrective pullback within a still-up 12H/1D trend. Near-term macro flows (firmer USD, ETF outflows) cap bounces for now.
Momentum: Mildly bearish/corrective 📉 — pullback from 115–116k; upside capped until 114.6k is reclaimed.
Key levels:
- Resistances (HTF/4H) : 112.7k–114.6k (4H/1D supply), 115.4k–115.6k (1D pivot), 119.9k–120.45k (HTF).
- Supports (HTF/LTF) : 111.7k (HTF pivot), 110k (intraday shelf), 108.5k–107.4k (HTF + ISPD 30m zone).
Volumes: Very high on 1H/30m during the selloff; 1D volumes normal.
Multi-timeframe signals: 1D/12H Up; 6H/4H/1H/30m corrective; 2H basing — 111.7k/110k defense is key; a firm reclaim above 112.7k would aid bulls.
Risk On / Risk Off Indicator: NEUTRAL SELL — aligns with near-term hesitation and favors confirmed signals at support.
__________________________________________________________________________________
Trading Playbook
__________________________________________________________________________________
Primary trend constructive but capped by 114.6–116k; favor confirmed buy-the-dip and tactical sells on clear rejections.
Global bias: Cautious neutral-sell; tactical invalidation on a clean reclaim/close > 114.6k.
Opportunities:
- Buy: Confirmed bounce at 111.7k/110k (wick + 2H/4H close), target 112.7k then 114.6k.
- Deep buy: 108.5k–107.4k with 12H/1D bullish rejection; add above 112.7k.
- Tactical sell: Rejection at 112.7k–114.6k with rising sell volume, target 111.7k then 110k.
Risk zones / invalidations: Acceptance below 107.4k opens 105k then 102.7–102.9k; daily close > 115.6k invalidates shorts and unlocks 120k.
Macro catalysts (Twitter, Perplexity, news):
- Fed: 25 bps cut, QT ends Dec 1; near-term hawkish tone, firmer DXY.
- US BTC ETFs: notable daily outflow — headwind for follow-through.
- Synchronized light easing (HKMA, Saudi) + Eurozone GDP beat — mixed macro signal.
Action plan:
- Entry: 108.5k–107.4k on a strong 12H/1D bullish rejection.
- Stop: ~0.8–1.0% below 107.2k (or confirmed close below the floor).
- TP1: 111.7k; TP2: 112.7k–113.0k; TP3: 114.6k; Approx R/R: ~2.0–3.0R depending on execution.
__________________________________________________________________________________
Multi-Timeframe Insights
__________________________________________________________________________________
HTFs (12H/1D) remain up, while LTFs correct and probe nearby supports.
1D/12H: Uptrend with controlled pullback; 114.5–116k acts as ceiling; 111.7k is the key hold.
6H/4H/1H/30m: Corrective pressure, sellers active into 112.7k–114.6k; a flush to 108.5k–107.4k can offer better asymmetry.
2H: Attempting to base above 110k; a firm reclaim over 112.7k would improve MTF confluence.
Major signals: LTF very high sell volume vs normal 1D — wait for clean confirmations before adding risk.
__________________________________________________________________________________
Macro & On-Chain Drivers
__________________________________________________________________________________
Macro tilts cautiously risk-off near term (firmer dollar, ETF outflows) even as medium-term policy shifts are supportive.
Macro events: Fed -25 bps and QT to end Dec 1, near-term hawkish tone; DXY firmer; light synchronized easing (HKMA, Saudi) and better Eurozone GDP.
Bitcoin analysis: US ETF net outflows weigh on rallies; ~111.2k support watched and ~120k pivot as the gateway to 130k+ if reclaimed.
On-chain data: Elevated LTH distribution, STH stress; reclaiming ~113k STH cost basis would aid momentum.
Expected impact: Confirms a “buy dips on confirmation” bias while keeping size conservative until USD/flows improve.
__________________________________________________________________________________
Key Takeaways
__________________________________________________________________________________
Corrective consolidation below 114.6–116k with 111.7k/110k as first defense.
- Overall trend: HTF bullish, short-term neutral/bearish.
- Top setup: Confirmed dip-buy at 108.5k–107.4k, add on reclaim > 112.7k.
- Key macro factor: Firmer DXY and ETF outflows cap upside momentum.
Patience and disciplined execution on clean signals — that’s how to win this range.
