$ORDI/USDT pessimistic outlook, I do not invest anymore.I have invested and made good money trading SEED_DONKEYDAN_MARKET_CAP:ORDI for a while. I have ridden the rise and sold at $69, missing the peak and feeling bad at the time.
Now my sentiment about SEED_DONKEYDAN_MARKET_CAP:ORDI is very bearish, and I will explain why I will stop trading it. Here are several events that have happened and are red flags:
1. SEED_DONKEYDAN_MARKET_CAP:ORDI was created in March 2023 by Domo, an enigmatic blockchain analyst; he just posted it on Github, and it was adopted by the team developing Bitcoin code. Binance launched it nobody knows why,
2. SEED_DONKEYDAN_MARKET_CAP:ORDI does not have a proper website. The founder didn't make money out of it and is not supporting it.
3. SEED_DONKEYDAN_MARKET_CAP:ORDI does not have an identified legal entity, no budget, no tokenomics, no roadmap, and no ecosystem.
4. SEED_DONKEYDAN_MARKET_CAP:ORDI now has RUNE (not the Thorchain CRYPTOCAP:RUNE ), which has a questionable name and seems to be a modification of BRC-20 to make money out of it. I personally think that it is shady.
So SEED_DONKEYDAN_MARKET_CAP:ORDI is a VERY HIGH investment risk, manipulated by Binance, with no team, and no future, to be honest. Worse, RUNE seems to be a takeover by Casey Rodarmor, a Bitcoin dev, and the name he has chosen is not compatible with any exchange because it already exists with a top 50 token that is older and succesful!
What the hell is going on?
I think that $95 is the all-time high for this coin for its lifetime, which will dump into oblivion before the end of this bull run, with no fundamental attached to it, I do not see what can save it.
Of course, I might be wrong; some magic could happen, and some pump might occur, but the signs of imminent death are already showing. It has dumped 66%, one of the worst performances of all the top 100 cryptos since its ATH. It is not recovering.
Conclusion: Be very careful with this coin. It has been short-lived and is probably in the process of dying.
Fundamental Analysis

Swing Long for DuluthPenny stocks aren't usually my style, but I'm feeling rather burly about this setup. Free-swinging longs and free-swinging flannel!

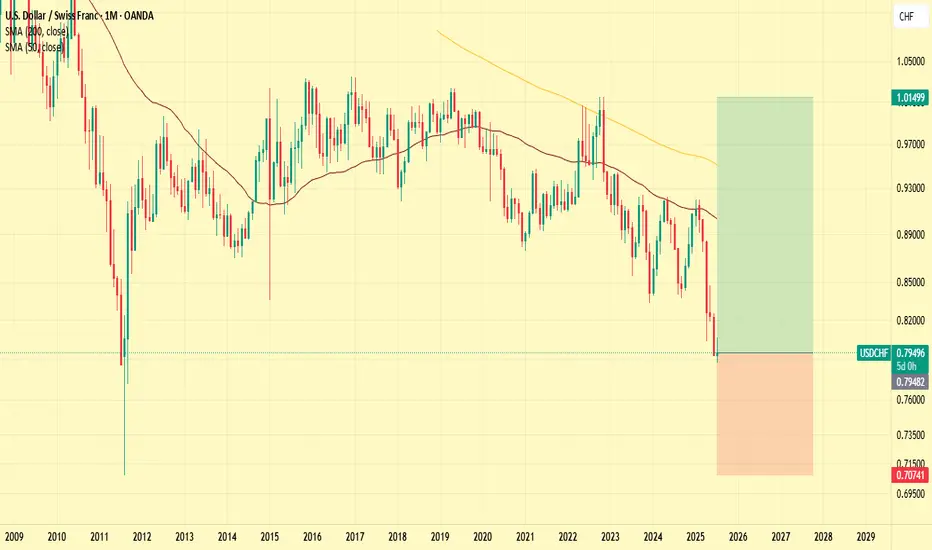
US Dollar Strength To Return In Full ForceThe mighty Dollar will once again prevail in the long term across all major pairs. It's status as the world reserve currency is far from removed.
[AUDCAD] Trade ideaAdding small size on this trade already in profit, I am playing the same scenario and for me this level is the one to reverse long otherwise my play is compromised.
Great Trade !

AUDCHF SHORTI believe there is now enough structural shift to confirm a movement to the down side for this pair.
This publication is for educational purposes only.

BTCUSD.P Overall Weekly Trend: The most recent weekly analysis points towards a correction or consolidation phase following a significant prior move. Many technical ratings for the 1-week timeframe show a Sell signal.

$INTC - Best in the sector against Trump tariffsIntel is a semiconductor technology giant, renowned for its x86 processors that dominate the CPU segment, top revenue in Q2 2025 came from PC chips (Client Computing Group, ~$7.9B) and server/AI chips (Data Center & AI, ~$3.9B) . Other revenue includes foundry services ($4.4B) and legacy businesses ($1.1B).
But, for the last 4 years the company has experienced one disaster after another:
- Loss of Market Share & Intensified Competition vs AMDs Ryzen and NVIDIA AI GPUs has been major drivers for last 4 years of decline.
- Gross margin dropped to around 38–39% in 2024—a steep fall from pre‑pandemic levels above 60%, while NVIDIA maintained margins above 75%.
- Intel perpetually lagged in transitioning to advanced nodes (7 nm, 5 nm), resulting in costly delays and reduced competitiveness .
- Credit rating downgrade: In August 2025, Fitch downgraded Intel’s credit rating from BBB+ to BBB (negative outlook) due to weak demand and deteriorating profitability . S&P had already downgraded Intel to BB+, and Moody's also cut its rating in 2024 .
Recent events and price action show its time for a buy at these prices.
- Spin-off of Network & Edge (NEX) group: Intel announced the spin-off of its Network and Edge Group (NEX) into an independent entity focused on critical communications and networks, seeking external investors while retaining a major stake .
- Workforce reduction and factory cancellations: Intel confirmed layoffs of ~24,000 employees (~15% of workforce) and cancellation of chip plant projects in Germany and Poland . New CEO Lip-Bu Tan plans to cut the headcount to ~75,000 by year-end 2025 .
- Executive departures and internal reorganization: Three corporate VPs (Kaizad Mistry, Ryan Russell, Gary Patton) announced retirement from manufacturing operations amid deep restructuring . Intel also cut its manufacturing capacity planning and engineering teams as part of an efficiency-driven reorganization .
- Recent key products/services: Intel launched new Xeon 6 CPUs for AI workloads (e.g. Xeon 6776P) and is preparing Panther Lake CPUs (PCs) for 2025 . It also began 18A node production in Arizona and sold part of its Mobileye stake (~$922M) to boost liquidity .
Price/sales: Intel (0.80), AMD (10.3), NVIDIA (29.6), QCOM (3.68)
Wrap-Up
Intel's last four years have been marked by a series of structural, competitive, and strategic challenges—ranging from manufacturing delays to margin erosion and intense pressure from rivals like AMD and NVIDIA. Yet, the tide may be turning. With decisive actions like major cost-cutting initiatives, new AI-focused products, and progress in advanced node production, Intel is signaling a strategic pivot. Trading at a deep discount relative to peers based on the price-to-sales ratio, the stock reflects much of the past negativity. For investors seeking a long-term turnaround play in the semiconductor sector, now could be the moment to re-evaluate Intel’s potential.
Let’s see if this chip giant can turn the corner. Cheers!
Pablin


Silver (XAGUSD): Possible buy setup, refinedSilver (XAGUSD): Possible buy setup, refined. Price took more liquidity before going bullish.
Cheers

EURNZD Strong Bearish ViewCurrently EURNZD is moving at Supply zone so there are high chances that once bearish impulse is coming in EURNZD very soon .

Gold (XAUUSD): Possible sell setupGold (XAUUSD): Possible sell setup. Wait for a clear breakout, with additional confirmation.
Cheers

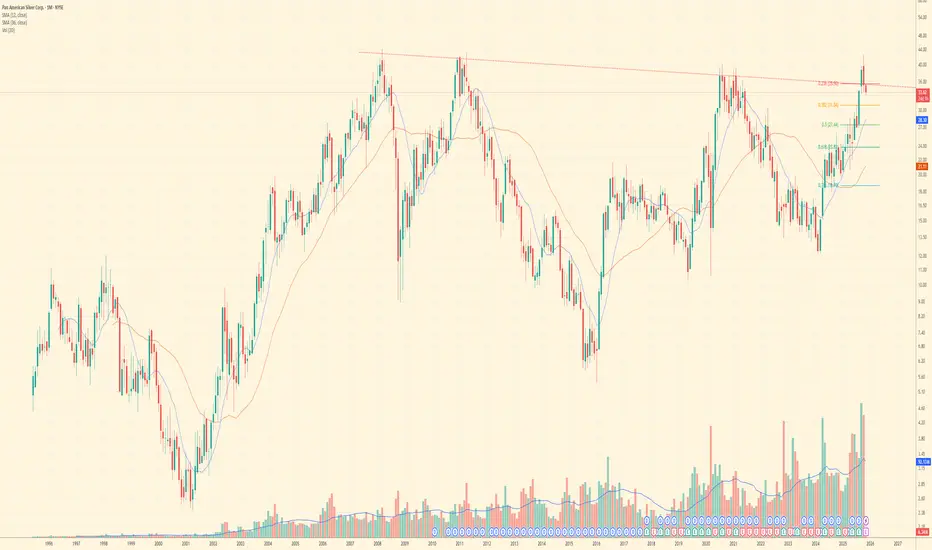
Did PAAS confirm breakout?PAAS is at a crucial inflection point.
- Long-Term Breakout: Price recently broke out above the multi-year descending trendline (red dashed line) with strong volume.
- Price Target: A confirmed breakout opens the door for a potential double in price, aiming towards the all-time highs and beyond ($70.00+).
This technical signal is strongly backed by the company's recent performance:
- Silver Rally: Spot silver trading above $42/oz, driven by industrial (solar) and investment demand.
- Financial Strength: PAAS reported $1B+ cash and a 20% dividend increase tied to net cash.
- Growth Driver: The low-cost Juanicipio asset will boost silver production by 34% and significantly lower all-in sustaining costs next year.
The combination of a strong technical setup and robust fundamental catalysts makes PAAS a prime breakout candidate. Watch the closing price carefully!
Disclaimer: This is not financial advice. Trade responsibly.
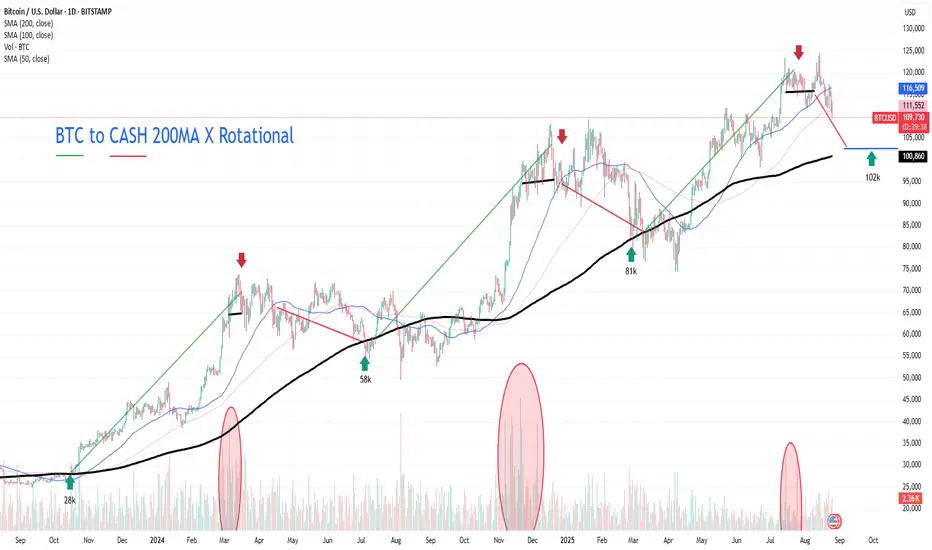
Bitcoin to revisit the 200 Moving Average?It has previously exhibited a tendency to revisit the Mean, then consolidating around it before moving to new pivot highs. These have been at approximately equally spaced price intervals.
There is currently evidence of large investors rotating out of BTC into ETH and/or Alt coins.
XAU/USDTrade idea / technical scenario
Gold is currently at the upper boundary of the descending channel formed since 22 October. If it fails to break above the channel, the bias is toward a pull-back. A potential target zone to the downside is around 4.019-4.020 (mid-channel level) and—if momentum accelerates—the imbalance (FVG) zone near 3.943 could come into play.
In short: at the top of the channel → failure to break → short/neutral bias → target 4 019-4 020 first, then 3 943.
Key fundamental reasons suggesting a bearish tilt today
1. Stronger U.S. Dollar & rising yields
Gold is priced in USD, so when the dollar strengthens, gold becomes more expensive for foreign buyers and tends to face headwinds.
Also, higher interest rates (or expectations of fewer cuts) increase the opportunity cost of holding non-yielding assets like gold.
2. Reduced safe-haven/contextual demand
Some of gold’s recent strength has come from risk/uncertainty premia (geopolitical tensions, trade issues). But if sentiment improves (e.g., easing US-China trade concerns) that support can fade.
One article cites that easing US-China tensions and a stronger dollar have helped trigger downside moves in gold.
3. Profit-taking after sharp rally / some valuation caution
Gold has rallied strongly in recent months; with steep gains, some pull-back or consolidation is normal. Markets may now be looking for new catalysts, and if those are absent or weak, the default can be consolidation or decline.
4. Fundamental drivers are already largely priced in
For example, expectations of rate cuts by the Federal Reserve may already be baked into gold’s advance. With little new upside surprise, the metal may lose momentum in the short term.
Also, many of the tail-risk narratives (currency debasement, inflation hedge, geopolitical safe-haven) are well‐known and reflected in price—so without fresh risk events, the boost may be muted.
--
Summary / trading justification
Given that technical bias (top of descending channel) aligns with fundamental pressures (stronger dollar, less safe-haven demand, profit-taking after rally), the scenario you outline—failure to break the channel leads to decline toward 4.019-4.020 then possibly 3.943—makes sense.
Of course, if gold does break above the channel convincingly, it would invalidate the bearish bias and shift the view. So it’s prudent to treat the bearish view as conditional on the channel holding.

GBPAUD A perfect Bearish Flag A bearish flag is a technical analysis pattern in trading that indicates a potential continuation of a downtrend. It's characterized by:
Key Features1. Downtrend: A prior downward trend in price.
2. Flag formation: A consolidation period with a slight upward trend, forming a flag shape.
3. Volume: Typically, volume decreases during the flag formation.
Interpretation1. Bearish signal: The bearish flag suggests the downtrend is likely to continue.
2. Breakout: A break below the flag's support level can confirm the continuation of the downtrend.
Trading Strategies1. Short selling: Traders may consider short selling after a break below the flag's support level.
2. Stop-loss: Setting a stop-loss above the flag's resistance level can help limit losses.
Important Notes1. Confirmation: Wait for confirmation of the breakout before entering a trade.
2. Risk management: Always use proper risk management techniques.
⚠️ Disclaimer:
This setup is shared for educational purposes only. It is not financial advice. Always do your own analysis and apply proper risk management before trading any setup.

Sell CHF at 0.80900 P Line + SHIs a combination of a P Line + SH so will trace down have put the TP at 30 pips and SL at 10pips but it may bounce off the MH barrier so may take out profit earlier my entry is at 0.80900 however I did not adjust it on the chart

Maximum profit: Top 5 indices of OctoberIn October, client activity peaked around #SP500, #NQ100, #DAX30, #FTSE100, and #NIKKEI . These five indices not only showed the highest share of profitable trades but also delivered the best returns across all index instruments. Strong corporate earnings, steady demand, and a positive news backdrop continue to support their growth potential.
Growth outlook for key indices through the end of 2025:
• #SP500: New record highs, solid earnings from major players, and expectations of a Fed rate cut support buying the dip with moderate risk.
• #NQ100: Tech demand remains strong as firms invest in data centers and AI infrastructure. If earnings stay on track, there’s still room to grow.
• #DAX30: After hitting new all-time highs in 2025, the German index benefits from improved global trade sentiment and stable EU data. Exporters thrive on robust external demand.
• #FTSE100: The UK market remains near its highs, supported by strong performance in key sectors and commodities. Year-end liquidity may further reinforce the uptrend.
• #NIKKEI: Japan’s index keeps climbing, helped by a weak yen boosting exports and a predictable monetary environment. Further gains are possible if global conditions remain calm.
FreshForex analysts believe short-term index performance hinges on three main factors: current earnings season results, inflation trends, and central bank decisions. Risk management and awareness of the macro calendar remain essential.

Report 4/11/25My take
By Thursday, Nov 6, Tesla shareholders are widely expected to approve a record incentive plan for Elon Musk that hard-wires governance around a “physical-AI” vision (robotaxis + humanoid robots) that still contributes almost nothing to current cash flow. Street frameworks now ascribe the majority of TSLA’s value to those options (Robotaxi ~45%, Optimus ~19%), with autos/FSD/energy the minority. The market’s message: governance clarity > near-term delivery softness. Around that, Big Tech just drew a bright line between asset-heavy AI (Meta, Alphabet) and asset-lighter cash return (Apple), while cloud scale (Microsoft, AWS) remains the only place AI capex throws off immediate P&L. Macro remains risk-supportive: a fragile U.S.–China truce shaved tail risks; September CPI printed 3.0% y/y; labor demand is eroding slowly rather than breaking; tariffs haven’t been the inflation doomsday nor a manufacturing panacea; and the Fed’s bias is to cushion jobs.
Bottom line for the next 1–4 weeks: constructive equities, a heavy-ish dollar, oil with a floor (China stockpiling), gold supported on dips, and U.S. duration underpinned by the Fed’s growth-risk focus. TSLA trades on path-dependence headlines (vote, autonomy milestones) more than quarterly units.
What happened
Tesla’s governance and the “optionality premium.”
The Nov 6 vote would lift Musk’s potential stake toward ~25% upon hitting extremely ambitious hurdles (including ~$8.5T market value within ~10 years). Bulls argue Musk’s speed, data advantage, and “touching the physical world” moat justify paying now for AI scale later; bears see a long monetization runway with FSD still supervised and Robotaxi “in park.” Either way, approval reduces overhangs (control/retention), which usually compresses risk premia short term even if fundamentals haven’t changed.
AI spending bifurcation.
Meta’s rising capex/depreciation turned it into a show-me stock; Alphabet is spending even more but can rent out capacity via Cloud; Apple stays asset-light and keeps the cash-return flywheel spinning. Microsoft and AWS are the current “AI rainmakers,” monetizing AI demand through cloud—and the OpenAI–Amazon multiyear compute pact reinforces AWS’s backlog and narrative.
Banks leaning into returns.
Bank of America’s investor day (Wed, Nov 5) will likely pivot rhetoric from “responsible growth” to “more growth” with a higher ROTCE target (16–18%). In a soft-landing tape with Fed cuts still in play, that’s a tailwind for large-cap financials and the Dow, provided investors buy the bridge from talk to delivery.
Macro backdrop.
A partial U.S.–China detente (tariffs eased at the margin, rare-earth curbs delayed, soybean purchases back) removed worst-case escalation—for now. CPI at 3.0% and the Fed’s emphasis on employment risks (Gov. Cook) keep cuts live. Tariff pass-through has been muted (firms eating a chunk via margins and rerouting), reducing the odds of a policy-error inflation spike. China’s aggressive crude stockpiling plus Russia-flow workarounds put a floor under oil—limiting downside even in oversupplied quarters.
Cross-asset impact
S&P 500 (SPX).
Bias remains upward with a “breadth-with-quality” tilt. Cloud/platform names with direct AI monetization (and discipline on capex) should out-earn pure spenders; financials benefit if BofA’s playbook catalyzes a sector rerate; cyclicals get a small boost from trade calm. Watch: any hawkish inflection from the Fed or a re-flare in tariffs would hit multiples first.
Dow Jones (DJI).
Constructive. Banks + industrials + energy benefit from (i) ROTCE rhetoric, (ii) tariff de-escalation optics, (iii) a firmer crude floor. Downside risk: fresh U.S.–Canada tariff noise would nick North American industrials/autos sentiment.
DXY (U.S. Dollar Index).
Leaning softer into year-end as the Fed prioritizes labor risks and trade frictions cool. The path isn’t linear—enforcement shocks (Russia energy, export bans) can create tactical USD squeezes—but base case is a 97–100 range with a drift lower on any dovish Fed signaling.
USDJPY.
Still elevated on policy divergence and higher oil, with 151–155 the volatility zone. A softer broad USD from trade calm + Fed cuts could cap upside, but without a BOJ policy shift or stealth action, dips are shallow. Event risk: rapid yen spikes if authorities lean harder near 153–155.
XAUUSD (Gold).
Supported on dips. Central-bank demand + sanctions/geopolitical hedging offset drag from positive real yields. Improved risk mood can stall upside tactically; structurally the bid persists. Expect a choppy but rising channel if DXY eases and policy uncertainty (tariffs, elections, sanctions) lingers.
Crude (Brent).
Range with a floor. China’s stockpiling and episodic sanctions headlines keep $63–$70 plausible near term; sustained upside requires tougher enforcement that truly crimps Russian flows/financing. Macro risk-on + trade de-escalation argue against a collapse toward low-$50s unless China slows buying.
Tesla: how to think about risk/reward into and after the vote
Into Nov 6: Approval removes a governance overhang; shares tend to trade with an “execution optionality” premium when control/continuity is secured.
Near term (0–6 months): Fundamentals remain EV-demand sensitive (post-credit pull-forward) and FSD is still supervised; the stock trades on catalysts—pilot Robotaxi progress, Optimus milestones, AI data-center scaling, and regulatory signposts.
Medium term (6–24 months): Multiple durability depends on converting narrative power into cash-flow line-items: real autonomy miles under permissive regimes, unit economics for robots, and take-rates that move revenue/GM. Without that, the equity re-anchors to autos/energy cash generation.
Strategy notes & positioning ideas
Equities: Favor quality cloud/platforms with visible AI monetization; barbell with selective financials (ROTCE momentum) and international value where USD softness helps.
Rates/FX: Modest long in belly duration still works while the Fed leans growth-risk; fade USD strength on enforcement headlines; respect yen intervention risk above ~153.
Commodities: Brent call spreads over puts while China is stockpiling; keep strategic gold as policy/geopolitical hedge.
TSLA: Treat post-vote strength as path-dependent: add only against concrete autonomy/robot milestones, reduce on governance pass-through without operating proof.

BTC: 103.9k–103.1k cluster on watch, 109k is key__________________________________________________________________________________
Market Overview
__________________________________________________________________________________
BTC is in a corrective drift into a dense multi‑TF demand zone as the macro regime stays risk‑off. Buyers defend the upper cluster, but bounces keep stalling beneath the first supply shelf.
Momentum: 📉 Bearish-corrective — intraday pressure persists with rejections below 104.8k–105.6k.
Key levels:
• Resistances (HTF/1D–12H): 104.8k–105.6k (breakdown shelf), 109.0k (must reclaim), 111.8k–114.6k (1D supply stairs).
• Supports (12H/6H/4H/1D): 103.9k–103.1k (multi‑TF cluster), 102.93k–102.75k (AGG/1H), 102.23k (1D floor).
Volumes: Normal to moderate on 1H–4H (🔎 act as an amplifier, no major catalyst yet).
Multi-timeframe signals: 1D/12H still Up, while 6H/4H/2H/1H/30m/15m are Down; average tilt remains lower while below 105.6k and 109k.
Risk On / Risk Off Indicator: neutral sell — confirms the risk‑off tilt and tempers dip‑buying near supports.
__________________________________________________________________________________
Trading Playbook
__________________________________________________________________________________
Strategic stance: HTFs are still up but the regime is risk‑off — favor confirmed tactical buys at demand and sell rejections under supply shelves.
Global bias: Neutral‑sell while < 109k; tactical invalidation if we close ≥ 109k with confirmation.
Opportunities:
• Tactical buy: fade into 103.9k–103.1k on a ≥2H reversal, first target the 104.8k–105.6k shelf.
• Breakout buy: add on reclaim/hold > 104.8k–105.6k with a 4H close; target 107.4k then 109k.
• Tactical sell: fade rejections at 104.8k–105.6k (and/or 109k) with rising sell volume.
Risk zones / invalidations: A sustained close < 102.93k (AGG) invalidates the bounce and opens 102.23k; failure to reclaim 109k keeps sellers in control.
Macro catalysts (Twitter, Perplexity, news):
• US spot ETFs: 4‑day outflow streak, 7‑day average negative — headwind for dip‑buys.
• Fed/liquidity vs growth: Fed injections vs growth/credit stress — sticky risk‑off regime.
• ISM contraction and softer USD expectations — could ease pressure if flows improve.
Action plan:
• Long (cluster): Entry 103.9k→103.1k on ≥2H reversal / Stop < 102.93k / TP1 103.9k–104.2k, TP2 104.8k–105.6k, TP3 107.4k / R:R ~1.5–2.2.
• Short (rejection): Entry 104.8k–105.6k on rejection / Stop > 105.6k / TP1 103.9k, TP2 103.3k–103.1k, TP3 102.93k / R:R ~1.6–2.0.
__________________________________________________________________________________
Multi-Timeframe Insights
__________________________________________________________________________________
HTFs (1D/12H) still support buy‑the‑dip, while LTFs argue for patience and favor rejection sells.
1D/12H: Structure remains constructive; testing a stacked demand zone at 103.9k–103.1k; clean rejection wicks or bullish closes can trigger tactical longs.
6H/4H/2H/1H/30m/15m: Downtrends with lower highs; repeated failures beneath 104.8k–105.6k; a reclaim/hold above this shelf is needed to ease pressure.
Major divergences: HTF Up vs LTF Down — dip‑buys at Cluster A/B (103.9k→102.9k) need confirmation; a failure below 102.93k opens extension to 102.23k.
__________________________________________________________________________________
Macro & On-Chain Drivers
__________________________________________________________________________________
Macro is mixed: liquidity support versus growth/credit stress and negative ETF flows, sustaining a risk‑off regime.
Macro events: ISM manufacturing in contraction; Fed injecting liquidity while bank reserves slide; USD seen softer, but geopolitics keeps risk premia elevated — a choppy backdrop for crypto beta.
Bitcoin analysis: Lost ~109k as a cost‑basis/pivot; key demand 103.5k→100k with a ~99k shelf; high squeeze risk on a 109k reclaim and hold.
On-chain data: Rising CEX balances, elevated LTH distribution, Fear sentiment — nearby supply capping bounces until flows flip.
Expected impact: Conservative technical bias below 109k; look for confirmed bounces at 103.9k–103.1k, else room toward 102.23k then 98.9k.
__________________________________________________________________________________
Key Takeaways
__________________________________________________________________________________
Controlled correction testing a multi‑TF demand zone just below clear overhead supply.
- General trend: short‑term neutral‑bearish within an HTF uptrend.
- Most relevant setup: confirmed tactical buy in 103.9k–103.1k with fast profit‑taking below 104.8k–105.6k.
- One key macro factor: persistent spot ETF outflows enforce a risk‑off regime; wait for confirmations before sizing up.
Stay nimble: watch the 103.9k→102.9k reaction and keep risk tight until 109k is reclaimed. ⚠️

GBPAUD November 2025 fundamental analysisBritish Pound (GBP): Stagflation Amid Rate Cuts and Fiscal Concerns
Monetary Policy Trajectory
The Bank of England faces mounting pressure to deliver another rate cut in November, with markets pricing in approximately 75% probability of a 25 basis point reduction. This follows September's inflation reading of 3.8% year-on-year (below the 4.0% consensus) and a surprise uptick in unemployment to 4.5%. Current projections suggest interest rates will decline to around 3.75% by the close of 2025, with two additional reductions anticipated in 2026, eventually bringing rates to approximately 3.25% over the medium term.
Economic Challenges
The UK confronts what economists describe as "the most stagflationary economy in the developed world"—a brutal combination of high inflation, weak growth, and rising unemployment. The upcoming Autumn Budget on November 26 represents a critical inflection point, with Finance Minister Rachel Reeves under pressure to balance fiscal responsibility against growth imperatives.
Services inflation remains elevated at 4.7%, while core CPI sits at 3.5%, both above the BoE's comfort zone. The labor market is softening, which could prompt the BoE to ease despite persistent inflation concerns. However, some MPC members have expressed caution about reducing rates too rapidly, creating policy uncertainty.
November Outlook: Bearish
The pound's trajectory is decidedly negative for November. The expected BoE rate cut, combined with fiscal tightening signals from the Autumn Budget, creates a challenging environment. GBP/USD forecasts suggest range-bound trading between 1.32-1.38, with downside risks predominating. Against the euro, the pound has already weakened to 0.8765, approaching key support levels. Analysts at RBC Brewin Dolphin note that much of the pound's recent upward movement is actually "more to do with underlying dollar weakness than faith in sterling itself".
Australian Dollar (AUD): Inflation Surprise Supports Hold
Reserve Bank of Australia Stance
The Australian Dollar received a powerful boost from the September quarter inflation data released on October 29, which delivered a significant upside surprise. Headline CPI accelerated to 1.3% quarter-on-quarter and 3.2% year-on-year, well above the RBA's 2-3% target midpoint. More importantly, the RBA's preferred trimmed mean measure climbed 1.0% quarterly (beating 0.8% expectations and the RBA's August forecast of 0.6%), pushing the annual rate to 3.0%—the first uptick since December 2022.
RBA Governor Michele Bullock had explicitly stated earlier in the week that a 0.9% quarterly rise in trimmed mean inflation would be viewed as a "material miss". At 1.0%, the threshold was decisively crossed. Bullock also described the labor market as "a little tight" despite unemployment rising to 4.5%, and emphasized the RBA's unwillingness to "leap at a single number".
Rate Cut Expectations Pushed Back
The inflation surprise has dramatically reshaped rate cut expectations. The November 4 meeting confirmed the decision to hold rates steady for the moment, and the first 25 basis point cut has been delayed from February 2026 to May 2026. This represents a stark shift from earlier expectations for near-term easing. The RBA cash rate remains at 3.60%, providing a substantial yield advantage over other major central banks.
November Outlook: Very Bullish
The Australian Dollar is the clear standout for November strength. AUD/USD surged to a three-week high of 0.6607 following the inflation data, and technical analysis suggests further upside potential toward 0.6706. The currency benefits from multiple tailwinds: delayed rate cuts relative to other central banks, particularly the Fed; buoyant risk sentiment following the preliminary US-China trade framework; and strong commodity prices, including copper near three-month highs. Against the weaker commodity currencies like CAD and NZD, the Australian Dollar is exceptionally well-positioned.
Verdict
Considering the fundamental economic pressures on the UK and relative strength of the Australian economy, the GBP/AUD pair in November 2025 is more likely to be a SELL opportunity, as the Australian Dollar is expected to outperform the British Pound given the current outlook on inflation, interest rates, and fiscal policy.

EURAUD November 2025 fundamental analysisEuro (EUR): Neutral to Bullish as ECB Signals End of Cuts
Monetary Policy Stance
The European Central Bank kept its key interest rates unchanged at its September meeting, with the deposit rate remaining at 2.00%. This marks the second consecutive hold following the June cut, and ECB President Christine Lagarde made clear the central bank is "in a good place" and "comfortable" with current policy settings. Critically, the ECB provided no forward guidance on future moves, and market pricing assigns less than 50% probability to any further cuts through 2026.
Economic Backdrop
Eurozone inflation remains close to the ECB's 2% target, with headline inflation at 2.1% and core inflation at 2.3% as of August 2025. The ECB's updated projections show inflation averaging 2.1% in 2025, 1.7% in 2026, and 1.9% in 2027—slightly below the 2% medium-term target. Growth forecasts have been revised higher to 1.2% for 2025 (from 0.9% in June), though the 2026 projection was trimmed slightly to 1.0%.
Lagarde characterized the inflation risks as "more balanced" compared to June, and notably stated that "the disinflationary phase is over". This hawkish tone suggests the ECB has completed its rate-cutting cycle and will maintain restrictive policy for an extended period.
November Outlook: Neutral to Bullish
The Euro is positioned to gain against currencies whose central banks continue easing, particularly the US Dollar, British Pound, and commodity currencies. The October 30 ECB decision confirmed the hold, reinforcing the euro's positive momentum. EUR/USD forecasts for year-end range from 1.15 to 1.20, with the consensus around 1.16-1.17. The euro's relative strength is underpinned by narrowing rate differentials with the Fed and stabilizing eurozone growth dynamics.
Australian Dollar (AUD): Inflation Surprise Supports Hold
Reserve Bank of Australia Stance
The Australian Dollar received a powerful boost from the September quarter inflation data released on October 29, which delivered a significant upside surprise. Headline CPI accelerated to 1.3% quarter-on-quarter and 3.2% year-on-year, well above the RBA's 2-3% target midpoint. More importantly, the RBA's preferred trimmed mean measure climbed 1.0% quarterly (beating 0.8% expectations and the RBA's August forecast of 0.6%), pushing the annual rate to 3.0%—the first uptick since December 2022.
RBA Governor Michele Bullock had explicitly stated earlier in the week that a 0.9% quarterly rise in trimmed mean inflation would be viewed as a "material miss". At 1.0%, the threshold was decisively crossed. Bullock also described the labor market as "a little tight" despite unemployment rising to 4.5%, and emphasized the RBA's unwillingness to "leap at a single number".
Rate Cut Expectations Pushed Back
The inflation surprise has dramatically reshaped rate cut expectations. The November 4 meeting confirmed the decision to hold rates steady for the moment, and the first 25 basis point cut has been delayed from February 2026 to May 2026. This represents a stark shift from earlier expectations for near-term easing. The RBA cash rate remains at 3.60%, providing a substantial yield advantage over other major central banks.
November Outlook: Very Bullish
The Australian Dollar is the clear standout for November strength. AUD/USD surged to a three-week high of 0.6607 following the inflation data, and technical analysis suggests further upside potential toward 0.6706. The currency benefits from multiple tailwinds: delayed rate cuts relative to other central banks, particularly the Fed; buoyant risk sentiment following the preliminary US-China trade framework; and strong commodity prices, including copper near three-month highs. Against the weaker commodity currencies like CAD and NZD, the Australian Dollar is exceptionally well-positioned.
Verdict
The EUR is in a comfortable position altogether, however, AUD seems unstoppable at the moment. This development is expected to continue in November leading to a SELL recommendation for EUR/AUD.

USDJPY November 2025 fundamental analysisUnited States Dollar (USD): Cautious Strength Amid Economic Resilience
Monetary Policy: Fed's Hawkish Pause in Easing Cycle
The Federal Reserve delivered its second consecutive 25 basis point rate cut in October 2025, bringing the federal funds rate to a range of 3.75-4.00%, the lowest since 2022. However, the tone accompanying this decision was notably cautious. Fed Chair Jerome Powell emphasized that a December rate cut is "not a foregone conclusion," effectively pushing back against market expectations that had priced in an 87.7% probability of another 25bps reduction in October and 62% odds for December.
This hawkish messaging reflects the Fed's assessment of persistently elevated inflation, which has risen for five consecutive months and currently stands at 3.0% for both headline and core measures as of September. The central bank cited "increasing downside risks to employment" but noted that Powell explicitly stated he does not anticipate further deterioration in the labor market. The decision saw two dissenting votes—one favoring a 50bps cut and another preferring to hold rates steady—highlighting the divided nature of current Fed thinking.
Economic Fundamentals: Resilience Defying Expectations
The US economy has demonstrated remarkable resilience in the face of historically high tariffs (effective rate of 16-17%, highest since 1934) and a prolonged government shutdown exceeding five weeks. After contracting -0.6% in Q1 2025, GDP rebounded sharply to 3.8% in Q2, with Q3 tracking similarly strong at 3-4% according to the Atlanta Fed's GDPNow model. This growth is partly attributed to AI-related spending, which accounts for more than half of US growth this year.
However, the government shutdown—affecting 1.4 million federal employees with roughly half furloughed and half working without pay—poses growing risks. A rule of thumb suggests every week of shutdown shaves 0.1% off GDP. The lack of timely economic data due to the shutdown complicates the Fed's decision-making process, potentially supporting a cautious approach in November and December.
November Outlook: Dollar Strength with Caveats
For November 2025, the USD maintains a positive outlook supported by several factors. The relative economic resilience compared to other major economies, higher interest rate differentials (3.875% vs most G10 currencies), and ongoing safe-haven demand underpin dollar strength. However, this strength is tempered by the prolonged government shutdown, fiscal concerns, and the gradual Fed easing trajectory.
The dollar's performance will likely hinge on three key developments: resolution of the government shutdown, clarity on the December Fed decision, and the Supreme Court hearing on November 5 regarding the legality of tariffs imposed under the International Emergency Economic Powers Act. Market positioning shows the Dollar Index (DXY) holding above 98, with technical resistance at 99.75 representing a key threshold for sustained strength.
Japanese Yen (JPY): Political Dovishness Delays Normalization
Bank of Japan: Divided Board, Delayed Tightening
The Bank of Japan kept its benchmark short-term rate unchanged at 0.5% at its October meeting, as widely expected, but the decision revealed significant internal division. The vote split 7-2, with board members Naoki Tamura and Hajime Takata advocating for a hike to 0.75%, repeating their stance from the September meeting. Takata argued that "now is the appropriate time to raise interest rates," noting that inflation has remained above the bank's target for three and a half years, while Tamura called for moving toward neutral rates.
Despite these hawkish voices, Governor Kazuo Ueda maintained a cautious approach, emphasizing that the BoJ would continue with policy normalization "once its economic projections are met" but warning that global trade policies could slow growth and hurt corporate profits. The central bank reiterated its inflation outlook, projecting core CPI at 2.7% in 2025, 1.8% in 2026, and 2.0% in 2027, while raising 2025 growth forecasts slightly to 0.7%.
Political Constraints: The Takaichi Factor
The election of Sanae Takaichi as Prime Minister in mid-October significantly altered the trajectory of BoJ policy expectations. Takaichi, known as a fiscal dove who favors expansionary fiscal measures and loose monetary policy, has complicated the path toward further tightening. Following her election, the yen depreciated more than 2% against the USD, and market expectations for an October rate hike evaporated.
The new government's support for accommodative policy creates a political constraint on the BoJ's normalization efforts, even as some policymakers argue for immediate rate hikes. US Treasury Secretary Scott Bessent has urged the BoJ to accelerate rate hikes to prevent excessive yen depreciation, adding external pressure to the central bank's considerations. Markets now assign only a 47% chance of a December rate hike, with consensus building around a delayed move to early 2026.
November Outlook: Persistent Weakness Despite Normalization Promise
The Japanese Yen carries a weak fundamental outlook for November, reflected in its trading near 154 per USD—nine-month lows and close to the 37-week low of 153.28. The currency has weakened more than 4% in October alone, making it one of the worst G10 performers. Despite some hawkish board members and the BoJ's stated intention to continue normalization, the dovish political environment and cautious central bank approach leave the yen vulnerable.
The 3.25% interest rate differential with the USD remains a key driver supporting USD/JPY carry trades, though this spread is expected to compress toward 2.5% as the Fed continues cutting while the BoJ only gradually raises rates. While this compression could eventually support the yen, the timeline remains uncertain—potentially extending into 2026 rather than materializing in November. Technical analysis suggests immediate support near 151.73 (21-day average) with the next level around 150.11 (50-day average), but resistance looms at 154.80 and potentially 155 if the BoJ remains dovish. For November, the yen is expected to remain under pressure against most major currencies, while showing marginal strength only versus the aggressively easing NZD.
Verdict
The USD/JPY pair is a BUY in November 2025, supported by the US dollar's relative strength against a yen that remains under moderate pressure from persistent BoJ dovishness and political factors in Japan.

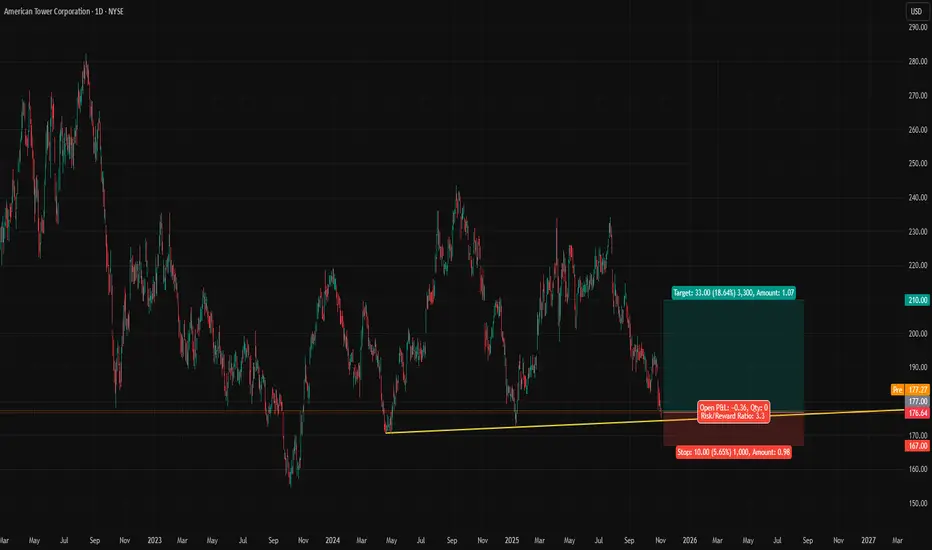
AMT Near Support with Solid Enough FundamentalsToday, I recheck my stock portfolio and open up some liquidty and look for new trade options. AMT catch my eye. Forward P/E is falling, below historical averages, nice earnings report, weaker investment, incoming rate cuts. Not a perfect stock pick overall but it is hard to catch perfect stocks at low prices. There was some insider trading, mostly in the first half of the year but it seems to be ended after July and price fell around 20%. I think the downward pressure might end and despite the rate cut for December is not a sure thing, FED is still in cutting cycle.
Technically, AMT is at a good place, close to key support. It has low - risk higher return potential. I will switch it with NYSE:GS that I took profit from.