SELL – IKIO TechnologiesThe stock appears overvalued based on current valuation metrics and is underperforming compared to its industry peers. From a long-term perspective, the target price is ₹80. In the short term, the stock may find support near ₹169, with an expected downside target of ₹148.
Fundamental Analysis

Adobe: Entering the Fourth Wave — Smart Money Distribution PhaseAdobe’s stock is entering a critical structural phase — the completion of its third global impulse and the start of the fourth corrective wave.
While the long-term uptrend remains intact, the price structure and fundamentals suggest that the most explosive growth period may already be behind us.
🧭 Long-Term Technical Context
Looking back to the early 2000s, Adobe has moved through a textbook Elliott Wave structure.
The first and second waves built the base, while the third wave delivered the explosive rally — from roughly $30 to $600, marking a 20x increase.
Now, the fourth subwave of the third major wave appears to be forming — a phase typically characterized by sideways consolidation and distribution by institutional players.
🔺 Wave 4 Triangle Formation
In many long-term wave structures, the fourth wave forms a triangle (ABCDE pattern) — a contracting structure where price oscillates between defined boundaries.
We can already observe the emerging shape:
Wave A and B are complete
Wave C is in progress
Wave D and E will likely complete the pattern before the final breakout
Once the triangle ends, a final Wave 5 push could occur — potentially extending toward $700, or in an extended scenario, even $2000.
📊 Trading Range and Short-Term Strategy
At this stage, smart money tends to distribute positions gradually.
The price is oscillating within a broad corridor, providing opportunities for range-based trading:
Buy zones: near the triangle lows (Wave A area around $350)
Profit zones: near the triangle highs (Wave B area around $600)
For swing traders, this range offers multiple short-term opportunities before the next major move begins.
💵 Fundamental Context
Despite being in a late-wave structure, Adobe’s fundamentals remain strong.
Share buybacks: The company continues to repurchase its own shares, supporting EPS growth.
EPS trend: Rising steadily year over year.
Revenue growth: Stable, around +10% YoY, with quarterly metrics showing +40% growth since Q1 2024.
Forward P/E: Approximately 28, which, by Peter Lynch’s growth-to-PE logic, still appears reasonably valued.
These metrics suggest that even in a market downturn, Adobe’s downside risk may be more limited compared to weaker tech peers.
🧮 Fundamental Summary
✅ Consistent buybacks supporting EPS
✅ Double-digit annual revenue growth
✅ Attractive valuation relative to growth metrics
✅ Strong defensive profile versus the broader tech sector
There are no visible signs of fundamental weakness — only technical consolidation after years of exponential expansion.
⚠️ Alternative Scenario
If the stock breaks below $270, the current wave structure may need adjustment.
Such a move could imply a larger triangle or a flat correction, but the broader interpretation — that we’re inside a long-term Wave 4 — would remain valid.
📈 Market Outlook
Adobe is transitioning from a high-momentum growth phase into a strategic accumulation and distribution phase.
The stock is unlikely to replicate its earlier explosive rally, but it continues to offer structured trading opportunities inside a stable technical range.
For long-term investors, the risk-reward remains balanced, supported by solid fundamentals.
For traders, the triangle provides a clear framework: buy near lows, take profits near highs, and wait for the fifth wave breakout.
🧩 Summary
Price structure suggests Wave 4 triangle formation
Trading range between $350–$600
Fundamentals remain strong and defensive
Forward P/E at 28 — reasonable given EPS growth
Next major target: Wave 5 breakout toward $700–$2000
Adobe is no longer in its most explosive phase — but it’s far from weak.
This is a mature consolidation period, not a decline story.
For disciplined traders, the triangle may offer some of the cleanest swing setups in the tech sector.

GBP/USD Price Outlook – Trade Setup📊 Technical Structure
FPMARKETS:GBPUSD GBP/USD rebounded from the 1.3140 support zone (lowest since May) and is consolidating above 1.3200. The pair faces overhead resistance near 1.3280–1.3300, which aligns with the descending trendline. A rejection here could trigger fresh downside, while sustained strength above 1.3300 would open the door to higher retracement gains.
🎯 Trade Setup
Entry: 1.3280 – 1.3300 (resistance retest)
Stop Loss: 1.3314
Take Profit: 1.3150 / 1.3140
Risk-Reward Ratio: ≈ 1 : 4.33
🌐 Macro Background
The pair bounced back above 1.3200 as the U.S. Dollar retreated from its post-FOMC highs. As FXStreet’s Haresh Menghani notes: “Spot prices climb back above the 1.3200 mark amid a modest USD weakness, though the fundamental backdrop warrants some caution for bullish traders.” 【FXStreet】
The Fed maintained a hawkish outlook, with Chair Powell pushing back against expectations of another December rate cut. This limits USD downside.
On the UK side, fiscal concerns remain a drag. Reports suggest the OBR will downgrade productivity forecasts, potentially widening the fiscal gap by £20 billion. Rising speculation of a 25 bps BoE rate cut in December (with odds at 68%) further undermines Sterling’s outlook.
🔑 Key Technical Levels
Resistance: 1.3280 – 1.3300
Support: 1.3150 – 1.3140
Psychological Level: 1.3200
📌 Trade Summary
GBP/USD trades above 1.3200 but upside is capped by resistance and macro headwinds. Short-term strategy favors selling rallies near 1.3280–1.3300, targeting 1.3150. A clear break below 1.3140 could confirm bearish continuation.
⚠️ Disclaimer
This analysis is for reference only and does not constitute trading advice. Trading involves significant risk, and proper risk management is essential.

Trump & The Eighth (8): The Millennium S&P500 Long Deal!For friends and Donald Trump the Magnificent (Trump).
Friends, based on analysis of data from the S&P 500 index, Trump's visible activity, and the Federal Reserve's aggressive interest rate cutting cycle - the conclusion is obvious. The US economy, and therefore the global economy, is transitioning from stagnation to recession. Consequently, the S&P 500 will first enter a correction, then experience a severe crash in 2026.
However, there exists an algorithm that can soften this collapse and save the global economy. This is the exact algorithm Trump intends to execute through a deal with Russia, achieved via a Russia-Ukraine ceasefire. This must become more than a temporary truce - it must be peace for generations to come.
To save millions of lives, to rescue the global economy and US markets, the Eighth (8) will come:
The Eighth (8) - the man who, through agreements with both Putin and Trump, will provide security guarantees and immunity for Putin, his inner circle, and their capital.
The Eighth (8) will sign a peace agreement with Zelenskyy based on a 50-year lease of territories along the current front lines. Using unfrozen Russian sovereign assets, he will restore both Russian and Ukrainian territories and pay all due compensations to victims' families.
The Eighth (8) will make a deal with Trump ensuring complete cooperation, mutual understanding, and prosperity for Russia, Ukraine, and the United States.
These three steps will enable comprehensive resolution of both regional and international issues, which in turn will sustain the global economy and US market indices.
Best regards,
VinterFrank (8)

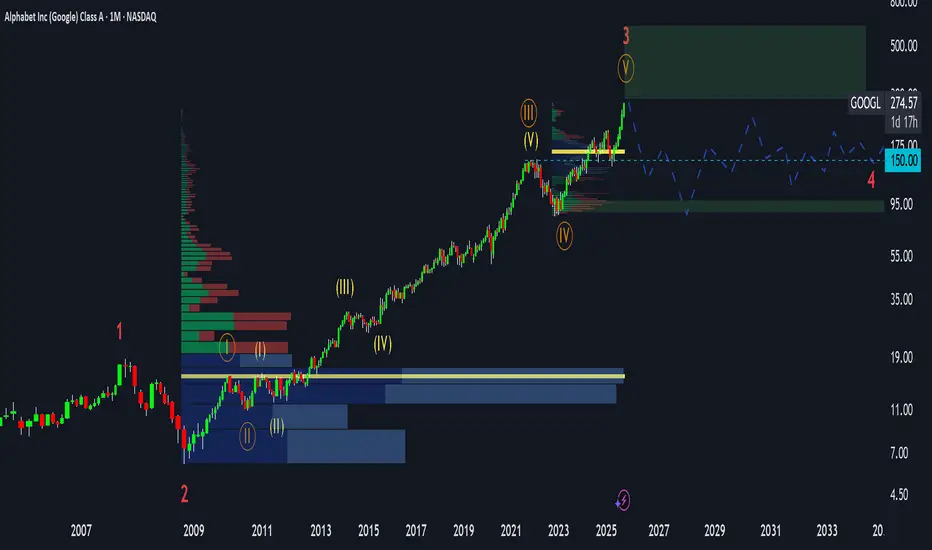
Is Google Entering Distribution? (GOOG, GOOGL Analysis)⚡ Overview
Recently, the charts of all major tech giants — Apple, Amazon, Google, Meta, and Microsoft — have started to look almost identical.
Each of them seems to be either topping out or entering what looks like a distribution phase.
In this post, I’ll share my technical and fundamental outlook on Google (GOOG, GOOGL), along with the key risks and price zones I’m watching as a trader.
💡 Fundamental View
From a fundamental perspective, Google still looks strong:
The P/E ratio has been growing steadily.
Revenue continues to rise.
The company has been aggressively buying back shares for years.
So fundamentally, this is not a bubble.
By Peter Lynch’s fair value formula, Google remains fairly valued, maybe even with a modest upside left.
However, strong fundamentals don’t always mean big growth ahead — especially when the market has already priced in perfection.
And that’s typically when the distribution phase begins.
📈 Technical View
According to Elliott Wave Theory, Google seems to be completing the fifth sub-wave within a larger third wave —
a structure that often marks the final stage before a distribution or correction phase.
On the long-term chart, price is now approaching the upper boundary of the rising channel,
with limited upside potential — possibly up to $430–$450, which represents the top zone.
Beyond that, the probability of continued growth drops sharply, while correction risk increases significantly.
⚙️ Market Structure
When analyzing the volume profile, the largest accumulation zone sits around $15 – $16 —
that’s where long-term investors entered 15 years ago.
Those early buyers are now sitting on massive unrealized profits,
and many are gradually distributing (selling) positions into current strength.
Meanwhile, retail traders often see the ongoing move as “more upside ahead.”
But in reality, this could be the final buying climax before a deeper correction.
🧩 Cycle Context
Interestingly, the same pattern is visible across Apple, Meta, Amazon, and Microsoft.
It’s not just about one stock — the entire Big Tech segment appears to be entering a similar maturity stage of the cycle.
That’s why I believe Google could soon transition from markup to distribution,
followed by a potential multi-quarter sideways or corrective phase.
💬 What’s your take? Do you think Google will reach $400 before correcting — or has the top already formed?
👇 Share your view in the comments.
XAUUSD | Scalp Zones & Sentiment Check
Planning for volatility around news sentiment. Looking for a confirmed bounce in the BUY zone for a long, or a fast scalp on momentum. #XAUUSD #Volatility #Scalping

Dash usdt accumulation Dash is in a weekly accumulation zone and has entered a corrective bearish pattern. The likely end result will be a price breakout pattern. The breakout will begin after the price breaks above $77, but it's a good idea to buy at these prices. The targets are clearly shown in black on the chart, but not all price targets will necessarily be reached.

Thursday’s meeting between the US and ChinaThe focus for Thursday for the daily chart in the S&P 500 will be the meeting between US and China. If a resolution can be reached on some of the major topics, positive movement to the upside and the S&P 500 would be expected.

Dash usdt / accumulation Dash is in a weekly accumulation zone and has entered a corrective bearish pattern. The likely end result will be a price breakout pattern. The breakout will begin after the price breaks above $77, but it's a good idea to buy at these prices. The targets are clearly shown in black on the chart, but not all price targets will necessarily be reached.

AIRO GROUP - Insiders or Corporate strong BULL SIGNAL!Noticing multiple small upward arrows on the Interactive Brokers chart for AIRO — these mark days with unusually high trading volume, often signaling potential support levels where buyers stepped in to stabilize price action.
In Interactive Brockers platforms shows the instant support, probablu insiders or corporate money just came in!
Also Target in Interactive Brockers is 30+ USD. The super good entry to buy the bottom! Also on October16th Ukraine signed the agrement with AIRO for drone supply.
Also the other super important topic is that on statistics analysis shows the bottom!
Good Luck Guys! Lets Roccck IT!!
All the best for this investment !

USD/JPY – Bullish Continuation After Retest of Support ZoneAfter a short-term correction, USD/JPY has bounced strongly from the 151.8–152.0 support zone, confirming continuation in the overall bullish structure.
Price has now reclaimed minor structure highs and could target fresh 4H highs in the coming sessions.
🔍 Technical Outlook
Price retested the 4H demand zone successfully.
Market structure remains bullish on both 4H and Daily charts.
Potential targets: 153.2 → 154.8
Setup invalid if price closes below 151.8
💰 Trade Plan (Example)
Entry: 152.16
Stop Loss: Below 151.8
Take Profit: 153.2 → 154.8
🧠 Bias: Bullish
🎯 Watching for clean 4H break and retest confirmation before continuation.
#USDJPY #Forex #TradingView #TechnicalAnalysis #PriceAction #FXTrading #SmartMoneyConcepts #SwingTrade #USD #JPY

[GBPJPY] Trade ideaLong setup after FOMC for a new leg up, will take most of the position out at the previous high but hold for the big swing high noted on the chart.
Great Trade !

[EURJPY] Trade ideaShort after FOMC today, strong conviction but need to manage the TP properly, the ones on the graph are very optimistic.
Great Trade !

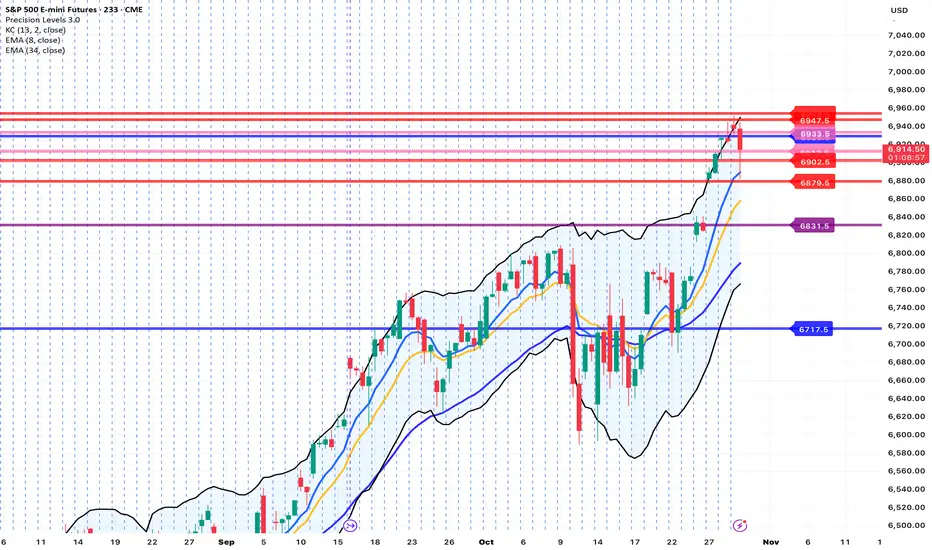
Day 58 — Trading Only S&P Futures | +$304 & Easy FOMC GainsRecap & Trades
Day 58 — clean and easy.
We had some conflicting signals early, but once the structure aligned, it became a straightforward session.
The key takeaway today was how FOMC movement tends to cap between 30–60 points, which makes it easy to plan trades if you size stops properly.
Overall, simple setups, small size, steady gain — +$304 for the day.
Lesson & Mindset
You don’t have to trade aggressively to make progress.
Low-effort, high-consistency days are often where real edge compounds.
I’m learning that keeping your head calm on choppy news-driven days is what separates pros from gamblers.
News & Levels
Powell’s comments cooled expectations for further rate cuts, causing the Dow to fade late in the session.
Tomorrow’s levels: Above 6885 bullish, below 6840 bearish.

Key Levels to Watch for the Stock's Next MoveHas it broken the long-term trendline?
Is it the correction bottom and a reversal from the channel's lower bound?
Today's Market Wrap: Fed, Gold, and Earnings – 29/10/2025The Federal Reserve cut interest rates by 25 basis points, marking the lowest level since 2022. However, Fed Chair Jerome Powell hinted at a possible pause in further rate cuts for the rest of the year. Still, the S&P 500 gained 0.2%, and the Nasdaq gained 1%, both hitting fresh record highs.
Gold remained flat at $3,950 an ounce after Powell warned that a December rate cut is not guaranteed. Potential progress on the US-China trade framework has also reduced some safe-haven demand.
In corporate earnings, Microsoft beat expectations but saw a ~2.5% drop in after-hours trading due to a slight miss in cloud revenue. Meta posted strong results but fell ~8% after hours, driven by concerns over capital expenditure. Alphabet exceeded earnings and revenue forecasts, with strong performance across Search, YouTube, and Cloud, sending shares up ~5% in after-hours trading.

GBPCAD Weekly 50SMA testPrevious idea failed at the 200SMA which is why tight SL was key. Now testing a stronger support at the weekly 50SMA and a daily support level dating back to early August. Tight SL for this kind of play. Fundamentally, BoC rate cut today should play a factor in the long hypothesis but the conference after the rate decision leaned towards a hawkish stance.

$DOGE 3rd Bull Wave coming it.Dogecoin experienced two major bull waves in 2017 and 2021.
Another bull wave is now loading.
Long downtrend broken
Retest completed
25MA on HTF is back at support
The price is gathering strength in the lower band of a years-long ascending channel.
All technical indicators are whispering of the start of a new cycle.
The 3rd Bull Wave is not a matter of “if”… but “when.

#EURUSD: +1100 Pips Selling Opportunity Comment Your Views?EUR/USD has consolidated on the weekly timeframe and recently shown signs of distribution, suggesting a potential downward move. As of the latest market data, EUR/USD is trading around 1.0670, having failed to hold above the 1.0750 resistance zone. Furthermore, the pair has slipped below the 50-day moving average, indicating weakening bullish momentum.
The European Central Bank has maintained interest rates at 4.00%, while the Federal Reserve has hinted at keeping rates higher for longer, strengthening the US dollar. Recent US data, including a better-than-expected Non-Farm Payrolls report and a stable CPI at 3.2%, further supports the downside bias in EUR/USD.
This setup presents a swing selling opportunity with a primary target near 1.0550, aligning with the previous support zone. Traders may consider using smaller interim targets, such as 1.0620 and 1.0580, while adjusting positions according to their trading plans and risk management strategies.
Good luck and trade safely!
Team Setupsfx_

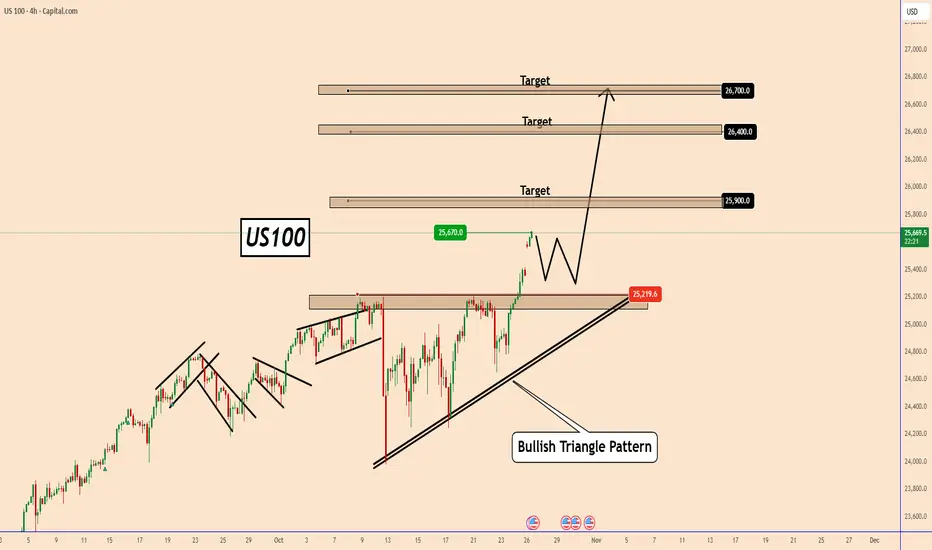
US100 Breaks Out as Trade Optimism and Fed Expectations Fuel MomUS100 Breaks Out as Trade Optimism and Fed Expectations Fuel Momentum
Over the weekend, US President Donald Trump said that the US and China will reach a deal.
US President Donald Trump said that the US and China are ready to "reach" a trade deal, as he is expected to meet with Chinese President Xi Jinping later this week in South Korea during his Asia tour.
This decision gave the market a breather and increased optimism about an improvement in business sentiment. The indices came out of consolidation to create new record highs.
US100 has already reached 25670 and looks set to rise further as shown in the chart with targets:
25900; 26400 and 26700
This week, the FED is also expected to cut rates by 25 basis points to 4% from 4.25%.
These expectations should help indices to rise further
US100 may test 25300 again before moving further. So, take note of this.
However, so far, US100 remains strong, and this momentum could continue to grow further.
You may find more details in the chart!
Thank you and Good Luck!
❤️PS: Please support with a like or comment if you find this analysis useful for your trading day❤️
ETH/USDT 1W🔹 Overall Trend
We are still in an uptrend (trend line maintained from the March low).
However, momentum is weakening—a series of lower highs is forming, suggesting a local correction within the main trend.
🔹 Key Technical Levels
🟢 Resistance:
4,179 USDT – the current level that the price is testing as resistance.
4,407 USDT – the next strong resistance, where previous rejections occurred.
4,877 USDT – the main resistance resulting from the August highs.
🔴 Support:
3,916 USDT – almost identical to the above (demand zone).
3,561 USDT – key structural support; loss of this level = possible trend change.
🔹 Formation and Structure
The current pattern could form a potential ascending triangle, with the trendline (black) connecting the lows and the horizontal resistance lines marking the upper boundary of the consolidation.
If a breakout occurs above 4,180–4,400, a move to 4,800+ is possible.
However, if we break the trendline and 3,900, a move to 3,560–3,400 could occur, or even a test of 3,000 with significant selling pressure.
🔹 Volume
Volume is decreasing during consolidation → typical of an accumulation or distribution phase.
No clear breakout signal – the market is waiting for a trigger (e.g., macroeconomic data, ETFs, news about ETH 2.0).
🔹 Stochastic RSI (Bottom of the chart)
Located in the oversold zone (<20).
The %K line (blue) is attempting to cross the %D line (orange) from below – a signal of an early rebound.
If confirmed next week, a local rebound from the 3,900–4,000 zone could occur.
🔹 Scenarios:
✅ Bullish:
Breakout from the trendline + breakout above 4,180 → target 4,400, then 4,880.
Confirmation by increasing volume and the Stoch RSI emerging from oversold territory.
❌ Bearish:
Breakout of the trendline and 3,900 → target 3,560, then 3,200.
Increasing downward volume + no bullish reaction at the support levels.

USDCAD a New Down Trend has Started?BOC Monetary policy decision today
The -25bp cut was expected, but the forward guidance is significantly more hawkish than markets anticipated.
Breaking It Down
The Dovish Elements
1. Delivered 25bp cut (2.5% → 2.25%)
2. Acknowledged weak growth
3. Recognized soft labor market
The Hawkish Elements
1. "Current policy rate at about the right level" This is a terminal rate signal
2. Core inflation "sticky around 3%" acknowledgment
3. September CPI "slightly higher than anticipated"
4. "Limits the role that monetary policy can play" . In other words : cutting more is likely worthless
5. Changed from "proceeding carefully" to "we're done unless outlook changes"
6. Removed easing bias entirely
This is net HAWKISH
What Markets Were Pricing Before this:
- This 25bp cut
- Likely another 25bp cut in December or Q1 2026
- Terminal rate around 2.00%
What BOC Just Said:
- Here's your 25bp cut
- That's it, we're done
- Terminal rate is 2.25% (atleast 25bp higher than market expected)
- No more cuts unless "outlook changes"
FOMC is coming up in 30 minutes. Any dovish bias will accelerate this decline establishing a new down-trend. Unless there is a major hawkish turn I would be shorting any rally caused by initial miss-interperation of the statement or the press conference remarks.
COMING UP FOMC DECISION IN 30 MINUTES: I will update this post after the FOMC decision.
