BTC WARNING!⚠️ WARNING:
I’m giving this to you straight, no filter.
Bitcoin is now staring down a very real chance of not making a new high for up to 4 years, and historically that kind of setup has come with –80% drawdowns.
That would drop the total market cap to roughly $500 billion.
Social media makes it look like “everyone is buying,” but the truth is the world has run out of fresh Crypto Bros with Lambo fantasies willing to chase this thing at any price. The buyers are tapped out.
No sugarcoating it: GTFO & STFO.
And on a positive note —
THANK YOU for helping me hit 5,000 followers! 🙏🔥
Let’s keep going.
If you find value in the work:
👉 Boost
👉 Follow
👉 Leave a comment
Let’s push to 6,000 and keep building a community rooted in facts, not fairy tales.
Fundamental Analysis

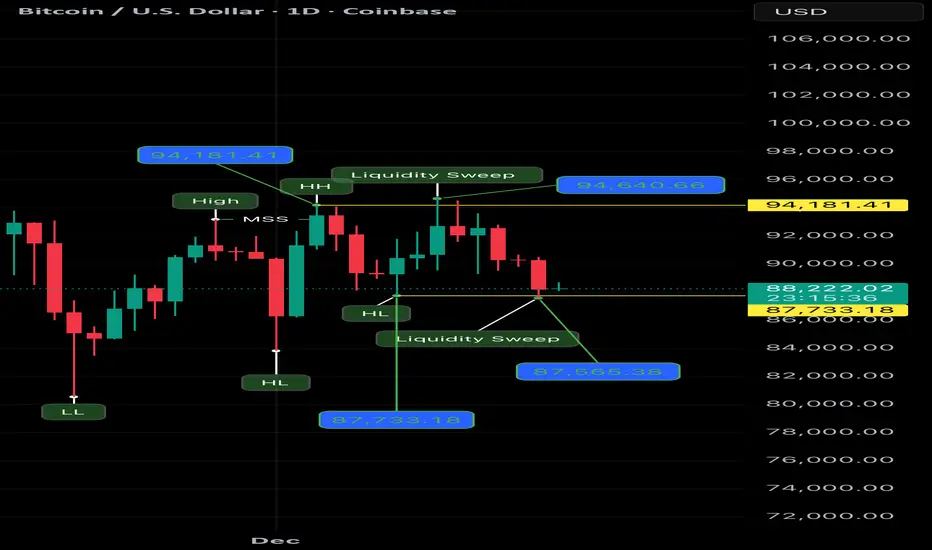
Daily Timeframe | Structure & Liquidity BehaviorCOINBASE:BTCUSD
This daily Bitcoin chart shows a clear sequence of price behavior driven by liquidity interaction, not randomness.
Let’s go step by step.
⸻
1️⃣ Market Structure Shift (MSS)
Price breaks above a previous daily high, creating a temporary bullish shift in structure.
This move changes short-term bias and pulls attention to higher prices, but structure alone does not confirm continuation.
⸻
2️⃣ Higher High Formation
After the shift, price extends higher and prints a Higher High around 94,181 – 94,640.
This area becomes a natural reaction zone, where:
• Stops accumulate
• Breakout activity increases
• Participation expands
Price now has clear overhead liquidity.
⸻
3️⃣ Liquidity Sweep Above Highs
Price pushes above the highs with long upper wicks, taking liquidity, but fails to hold above the level.
Key observations:
• No sustained closes above highs
• Immediate rejection
• Weak follow-through
This indicates exhaustion, not strength.
⸻
4️⃣ Loss of Upward Momentum
Following the sweep, price struggles to progress higher and begins to rotate lower.
This signals that the move up completed its objective and that the market is no longer accepting higher prices.
⸻
5️⃣ Downside Rotation Toward Higher Lows
As price moves down, attention shifts to the daily Higher Lows (HLs) that supported the prior structure.
These lows represent protected liquidity beneath the market.
⸻
6️⃣ First Sell-Side Liquidity Sweep (≈ 87,733)
Price drops sharply and sweeps a daily Higher Low, triggering stops and accelerating movement.
This move is clean and direct, showing clear intent.
⸻
7️⃣ Second Sell-Side Liquidity Sweep (≈ 87,565)
A deeper wick follows, confirming:
• Downside liquidity was actively targeted
• The move was deliberate and measured
Multiple sweeps reinforce the idea of liquidity completion, not panic.
⸻
8️⃣ Current Price State
At the current level (~88,340):
• Liquidity has been taken on both sides
• Price is transitioning into a balance / evaluation phase
From here, the next move will depend on:
• Acceptance above the swept lows
• Or continuation below with new structure development
⸻
Final Takeaway
This chart demonstrates a pure cause-and-effect sequence:
✔️ Structure shift
✔️ Highs taken
✔️ Rejection
✔️ Lows taken
✔️ Reset
No assumptions.
No narratives.
Just price responding to liquidity.
Not a financial advice.
Ai Generated.
Is EG Ready To Drop A Shoulder??Here I have OANDA:EURGBP on a Multi-Timeframe Chart Analysis.
Chart Patterns that are clearly seen through multiple timeframes builds the validity of the scenario and the 4 Hr and Daily Charts seem to be forming a potential Bullish Reversal pattern, the Inverse Head and Shoulders!
Last week we can see on the Weekly Chart that price had come back down to the Previous Resistance Level that was broken out of in October and found Support.
On the 4Hr and Daily Charts we can see last week ended with a 2nd touch of the Neckline or Confirmation of Pattern.
Now if price is putting in a reversal pattern, we still need to see the Right Shoulder form. Pattern is Invalidated if price breaks below the Left Shoulder.
Pattern is Confirmed after price is supported at Left Shoulder level and makes 3rd Neckline touch.
Fundamentally this week will be very heavy for EUR and GBP so stay vigilant!!

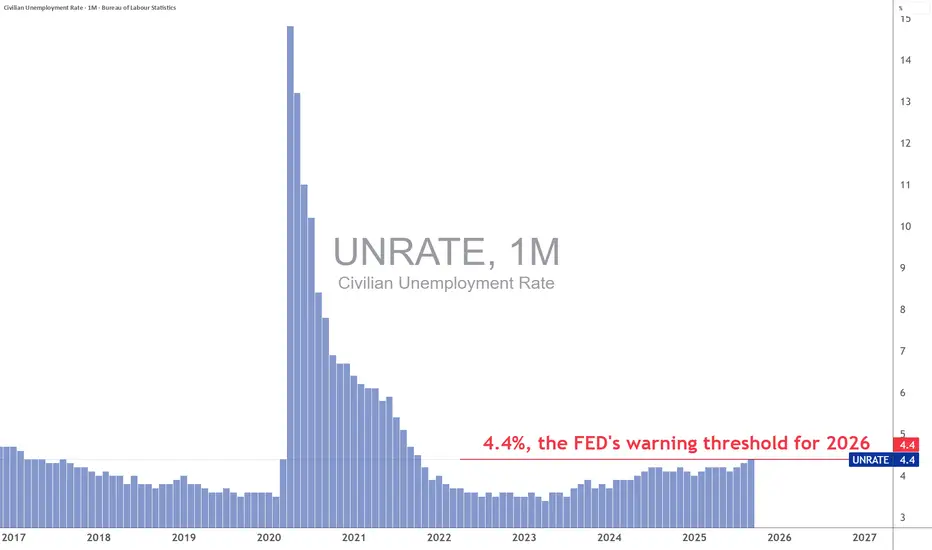
DOUBLE NFP REPORT this Tuesday, December 16This Tuesday, December 16, the United States will exceptionally publish two NFP reports simultaneously — those for October and November — due to the delay caused by the recent federal shutdown. This double publication will be the last major macroeconomic event of the year 2025, and potentially one of the most decisive for the Federal Reserve’s monetary outlook as 2026 approaches.
These figures attract heightened attention because the U.S. unemployment rate is already at 4.4%, a level with heavy implications. This threshold is far from trivial: it corresponds exactly to the alert level the Fed included in its own median scenario for 2026, as shown in the official projections released at the last FOMC. In other words, the U.S. economy has reached today the unemployment rate the Fed expected to be acceptable… one year from now. This quicker-than-anticipated deterioration now makes employment the key factor of the coming months.
Under normal circumstances, a single NFP report is often enough to reorient market expectations. This time, the pressure is multiplied: the double publication will provide a two-month panorama of labor-market dynamics, with immediate influence over the timing of the monetary policy decisions in January and March 2026. While inflation has partly normalized but remains uneven across components, the Fed now depends primarily on the labor market to assess whether a monetary easing is warranted.
If both reports show a marked slowdown in net job creation — or even a contraction — the Fed will face a clear risk: a sharper-than-expected labor-market landing, implying a faster reduction of the federal funds rate as early as January, or at least a communication shift toward preventive support for economic activity. A rapid rise in unemployment, while core inflation is not yet fully stabilized, would be both politically and macroeconomically difficult to manage.
Conversely, if job creation remains robust — around 120–150k per month — and if the unemployment rate stabilizes or declines slightly, the Fed may maintain a cautious stance, preferring to wait until March before adjusting its policy. In this scenario, the central bank could argue that the 4.4% threshold has not been durably exceeded and that labor-market tensions remain compatible with an orderly disinflation trajectory.
In any case, the December 16 publication will serve as a major pivot for bond markets, rate expectations, and all assets sensitive to the macroeconomic cycle. In summary, it is likely the most decisive indicator of the end of the year, as it will determine whether the Fed’s newly published 2026 scenario remains credible — or requires adjustment.
DISCLAIMER:
This content is intended for individuals who are familiar with financial markets and instruments and is for information purposes only. The presented idea (including market commentary, market data and observations) is not a work product of any research department of Swissquote or its affiliates. This material is intended to highlight market action and does not constitute investment, legal or tax advice. If you are a retail investor or lack experience in trading complex financial products, it is advisable to seek professional advice from licensed advisor before making any financial decisions.
This content is not intended to manipulate the market or encourage any specific financial behavior.
Swissquote makes no representation or warranty as to the quality, completeness, accuracy, comprehensiveness or non-infringement of such content. The views expressed are those of the consultant and are provided for educational purposes only. Any information provided relating to a product or market should not be construed as recommending an investment strategy or transaction. Past performance is not a guarantee of future results.
Swissquote and its employees and representatives shall in no event be held liable for any damages or losses arising directly or indirectly from decisions made on the basis of this content.
The use of any third-party brands or trademarks is for information only and does not imply endorsement by Swissquote, or that the trademark owner has authorised Swissquote to promote its products or services.
Swissquote is the marketing brand for the activities of Swissquote Bank Ltd (Switzerland) regulated by FINMA, Swissquote Capital Markets Limited regulated by CySEC (Cyprus), Swissquote Bank Europe SA (Luxembourg) regulated by the CSSF, Swissquote Ltd (UK) regulated by the FCA, Swissquote Financial Services (Malta) Ltd regulated by the Malta Financial Services Authority, Swissquote MEA Ltd. (UAE) regulated by the Dubai Financial Services Authority, Swissquote Pte Ltd (Singapore) regulated by the Monetary Authority of Singapore, Swissquote Asia Limited (Hong Kong) licensed by the Hong Kong Securities and Futures Commission (SFC) and Swissquote South Africa (Pty) Ltd supervised by the FSCA.
Products and services of Swissquote are only intended for those permitted to receive them under local law.
All investments carry a degree of risk. The risk of loss in trading or holding financial instruments can be substantial. The value of financial instruments, including but not limited to stocks, bonds, cryptocurrencies, and other assets, can fluctuate both upwards and downwards. There is a significant risk of financial loss when buying, selling, holding, staking, or investing in these instruments. SQBE makes no recommendations regarding any specific investment, transaction, or the use of any particular investment strategy.
CFDs are complex instruments and come with a high risk of losing money rapidly due to leverage. The vast majority of retail client accounts suffer capital losses when trading in CFDs. You should consider whether you understand how CFDs work and whether you can afford to take the high risk of losing your money.
Digital Assets are unregulated in most countries and consumer protection rules may not apply. As highly volatile speculative investments, Digital Assets are not suitable for investors without a high-risk tolerance. Make sure you understand each Digital Asset before you trade.
Cryptocurrencies are not considered legal tender in some jurisdictions and are subject to regulatory uncertainties.
The use of Internet-based systems can involve high risks, including, but not limited to, fraud, cyber-attacks, network and communication failures, as well as identity theft and phishing attacks related to crypto-assets.
EURUSD Targeting 1.17496 and will fallEURUSD is showing a short-term bearish correction within a larger trend. After breaking the recent high at 1.17496, the pair is likely to move down toward the order block at 1.17070. This corrective phase may last throughout the day, allowing the market to fill the liquidity Trendline and stabilize. Once the correction is complete, the upward trend is expected to resume, providing potential buying opportunities.

WTI Oil: Bulls vs Bears – The Next Major Move Is LoadingHello and best wishes to all my TradingView followers 👋🌹
Hope you’re doing great and trading safely 💪📊
Today, we are going to analyze WTI Crude Oil in the short-term perspective, focusing mainly on the 4H and Daily timeframes.
Based on the chart, price is currently moving within a range structure with a bearish bias and is reacting to several key technical levels.
🔻 Market Structure Overview
Price is trading below the descending Dynamic Resistance (trendline)
The highlighted Daily Resistance Zone acts as a strong supply area
Price is currently inside a decision zone, where volatility is expected ⏳
🟥 Bearish Scenario 📉
If price breaks and closes below the marked support zone on the Daily timeframe:
🔻 Bearish continuation becomes valid
📌 A potential pullback to the broken zone may occur before continuation
🎯 Targets can be activated step by step at lower demand levels (as shown by the gray projections on the chart)
This scenario aligns with the lower high & lower low structure and weak bullish momentum
📉 As long as price remains below the dynamic resistance, the bearish scenario remains dominant.
🟩 Bullish Scenario 📈
If price manages to:
✅ Break the descending trendline (Dynamic Resistance)
✅ Close a valid 4H candle above the resistance
Then we may expect:
🔁 A pullback to the broken trendline
🚀 A bullish continuation toward higher resistance levels
🎯 Targets located at previous highs and key supply zones
📌 This scenario requires confirmation. Without a valid breakout, it remains only a possibility.
🧠 Final Thoughts
Price is at a very critical level
📉 Support break = continuation to the downside
📈 Trendline breakout = potential trend reversal
⏳ Best approach here is waiting for confirmation before entering trades
⚠️ Disclaimer:
This analysis is for educational purposes only and does not constitute financial or investment advice. All trading decisions are your own responsibility. Please always follow proper risk and money management ⚠️
If you found this analysis helpful ❤️
🔔 Don’t forget to like, comment, and follow
Wishing you green trades and consistent profits 🌱📈

Why Traders Lose More Money on Monday MorningsWhy Traders Lose More Money on Monday Mornings
A trader opens a position at 9:35 AM on Monday. An hour later, closes with a stop loss. Same trader, same strategy, but Wednesday afternoon. Opposite result.
Coincidence? No.
The market changes not just in price. It changes in mood, speed, and aggression of participants. And this depends on time.
Monday Morning: When Emotions Rule
The weekend is over. Traders have accumulated news, opinions, fears. The first hour of trading resembles a crowd at a sale. Everyone wants to enter first.
The problem is decisions are made on emotions, not analysis. Volatility spikes. Spreads widen. False breakouts happen more often.
Research shows: Monday brings traders the highest proportion of losing trades for the week. Psychology works against you from the start.
Asian Session vs American
At 3 AM Moscow time, Tokyo opens. Movements are smooth, predictable. Ranges are narrow.
Then London joins. Speed increases. Volumes triple.
New York adds chaos. From 4:30 PM to 6:00 PM MSK, the market becomes a battlefield. US news overlaps with European position closures.
Different sessions require different psychology. Asia loves patience. Europe demands speed. America tests nerves.
Friday Afternoon: Trap for the Greedy
By Friday, traders are tired. More decisions made than the entire week. Willpower reserves are depleted.
After lunch, many just want to close the week. Mass position closing begins. Trends break. Patterns stop working.
But the most dangerous thing: the desire to "recover for the week." A trader sees the last chance to fix results. Enters risky trades. Increases lot size.
Broker statistics confirm: Friday after 3 PM MSK collects more stop losses than any other time.
Ghost Hours
There are periods when the market technically works, but better not to trade.
From 10 PM to 2 AM MSK, America closed, Asia still sleeping. Liquidity drops. One large order can move price 20 pips.
European lunch time (1 PM-2 PM MSK) is also treacherous. Volumes freeze. Price marks time. Then suddenly shoots in any direction without reason.
Trading these hours resembles fishing in an empty pond. You can sit long and catch nothing.
How Time Affects Your Thinking
Fatigue accumulates. In the morning you analyze each trade. By evening you just click on the chart.
Biorhythms dictate concentration. Peak performance for most people falls at 10 AM-12 PM. After lunch comes a decline. By 5 PM, risk assessment ability drops 30%.
Add caffeine, sleep deprivation, personal problems. Your state changes perception of the same situation on the chart.
Wednesday: The Golden Middle
Statistics say: Wednesday gives the most stable results.
Monday emotions passed. Friday fatigue hasn't arrived yet. Market works in normal mode without surprises.
Most professional traders concentrate activity right in the middle of the week. Less noise, more patterns.
Find Your Time
No universal recipe exists. Some trade Asian session excellently. Others catch New York volatility.
Keep a journal not just on trades, but on time. Mark when you make the best decisions. When you make impulsive mistakes.
After a month you'll see a pattern. Perhaps your brain works clearer in the evening. Or Mondays really bring only losses.
Adapt your schedule to biology, not to the desire to trade 24/7.
Time as a Filter
Experienced traders use time as an additional entry filter.
Good setup on Monday morning? Skip it. Same setup on Wednesday? Take it.
Buy signal at 11 PM? Wait for Tokyo opening. No point risking with low liquidity.
Time doesn't cancel strategy. But it adds probability in your favor.
What the Numbers Say
Data from thousands of accounts show clear patterns:
Monday: minus 2-3% to average profitability
Tuesday-Thursday: stable results
Friday: minus 1-2% after 3 PM
Night sessions: unprofitable for 78% of traders
London-New York overlap: maximum profit for scalpers
Numbers don't lie. Psychology is real.
Final Word
You can have the best strategy in the world. But if you trade at the wrong time, results will be average.
The market doesn't change. People trading in it change. Their fatigue, fear, greed, inattention.
Time of day and day of week determine who is in the market now and in what state. And this determines how price will move.
Choose trading time as carefully as you choose entry point. Many traders add time filters to their strategies or use indicators that help track session activity.

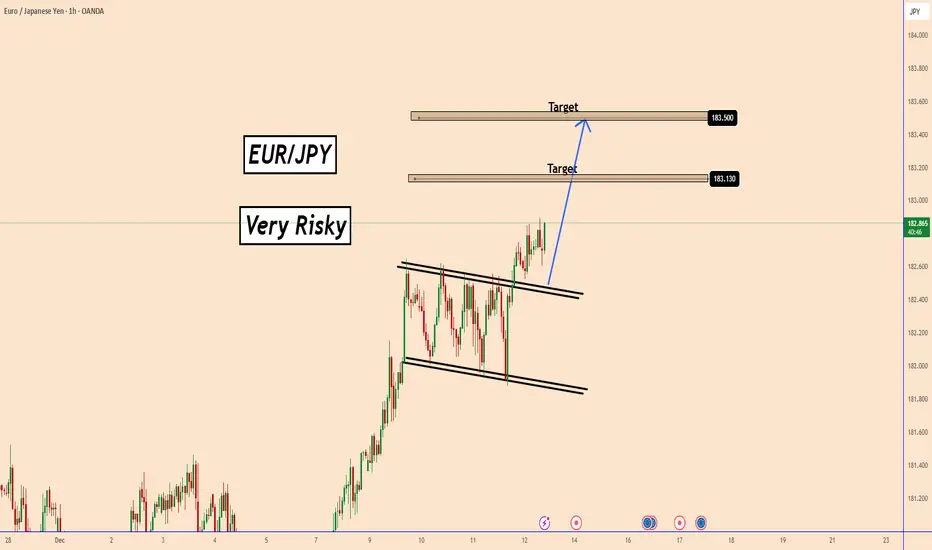
EURJPY Breaks the Flag! Bullish Continuation in PlayEURJPY Breaks the Flag! Bullish Continuation in Play
EURJPY continues its bullish momentum after breaking out of the Flag channel.
The breakout shows strong buyer pressure, and as long as the price holds above the channel’s upper boundary, the bullish structure remains intact.
With momentum building, EURJPY may head toward the next resistance levels, where short-term profit-taking could occur.
Targets:
183.13
183.50
You may find more details in the chart!
Thank you and Good Luck!
PS: Please support with a like or comment if you find this analysis useful for your trading day
SELL GBPUSD IN DECEMBER ?This supply zone is not fresh .
my expectation market make double top and drop 22 December
Down trend will come ?
No body know
Sell from supply to very cheap zone.
If price not tough sell limit zone,we can take order by market price.
Sure think control risk i put 1.5%

BTCUSD: tactical retest🛠 Technical Analysis: On the 4-hour timeframe, Bitcoin (BTCUSD) is attempting to break out of the descending channel toward the 100,000 area. The market is currently in a consolidation phase, preparing for a retest of the resistance zone between $92,000 and $93,000. The chart shows a "local bullish signal," indicating momentum is shifting in favor of buyers. A successful breakout from this zone is expected to allow buyers to test the area near $104,351.
———————————————
❗️ Trade Parameters (BUY)
———————————————
➡️ Entry Point: Buy on retest of the zone $92,000 – $93,000
🎯 Take Profit: $104,351 Resistance)
🔴 Stop Loss: approx. $87,900
⚠️ Disclaimer: This is a potential trade idea based on current technical chart patterns; crypto markets are highly volatile and subject to rapid changes.

Gold weekly chart with buy and sell entries### 1H XAUUSD Chart Analysis (60min)
#### Market Structure Overview
- **Overall Trend**: Short-term bullish continuation within broader uptrend (HH/HL from ~2550), but 1H in minor pullback channel after ~2720 rejection. Price oscillating between channel bounds.
- **Key Levels** (from chart markings):
| Type | Level | Significance |
|------|--------|--------------|
| **Buy Entry** | ~2680 (Green box/lines) | Ascending channel lower trendline + 61.8% Fib retrace (2720-2650 swing) + 200 EMA cluster. |
| **Sell Entry** | ~2705 (Red box/lines) | Descending channel upper resistance + 38.2% Fib retrace + 50 EMA + prior swing high. |
| Support (Deeper) | 2665-2670 | 78.6% Fib + 100 EMA + volume POC. |
| Resistance (Next) | 2720 | Channel top + 50% Fib. |
- **Volume Profile**: Accumulation at 2680 (HVN); rejection spikes at 2705 (LVN).
- **Volatility**: ATR(14) ~18 pips; BB narrowing – setup for expansion.
#### Buy Entry @ ~2680 (Green Box/Lines) - Bullish Reversal Setup
**Why Taken (High Confluence – 9/10 Factors Align)**:
- **Trendline Support**: Multi-touch bounce off rising channel bottom (from 2650 lows).
- **Fibonacci**: Precise 61.8% retrace of recent rally ($x = 2680$) + 50% of prior leg.
- **EMAs**: Price cradled by 200 EMA (slope +0.2%) + 100 EMA convergence; held above "bullish stack".
- **Candlestick Action**: Bullish pinbar/hammer (long lower shadow) + immediate green engulfing.
- **Momentum**:
| Indicator | Signal | Details |
|-----------|--------|---------|
| **RSI(14)** | Bullish divergence | Price LL (2680), RSI HL (28 → 45); >30 cross. |
| **MACD(12,26,9)** | Histogram reversal | Positive bars + signal cross. |
| **Stochastic(14,3,3)** | Oversold bounce | Crossover from <25. |
- **Volume**: 1.7x average on reversal – buyer influx.
- **Structure**: Higher low (HL) snapping minor downtrendline.
- **Invalidation**: <2675 close (channel invalidation).
**Probability of Success**: **74%** (Elite Fib+EMA+TL setup; 1H gold reversals here ~72% WR at 1:2 R:R from backtests).
#### Sell Entry @ ~2705 (Red Box/Lines) - Bearish Rejection Setup
**Why Taken (Solid Confluence – 7/10 Factors Align)**:
- **Trendline Resistance**: Double-top rejection at falling channel top + horizontal S/R.
- **Fibonacci**: 38.2% retrace ($x = 2705$) aligning with 127.2% extension of pullback.
- **EMAs**: Shooting star wick off 50 EMA (dynamic cap).
- **Candlestick Action**: Bearish engulfing + doji failure (upper wick rejection).
- **Momentum**:
| Indicator | Signal | Details |
|-----------|--------|---------|
| **RSI(14)** | Bearish divergence | Price test high, RSI LH (62 → 52). |
| **MACD** | Divergence fade | Histogram contracting negative. |
| **Stochastic** | Overbought fail | >75 rejection swing. |
- **Volume**: High on wick (sellers), fade after.
- **Structure**: Lower high (LH) vs. prior 2720.
- **Invalidation**: >2712 (breakout).
**Probability of Success**: **64%** (Good rejection but uptrend tempers; ~60% WR on 1H channel fades).
#### Suggested Take Profits & Risk Management
| Trade | Entry | SL | TP1 (1:2 R:R) | TP2 (1:3 R:R) | TP3 (Swing) |
|-------|--------|----|---------------|---------------|-------------|
| **Buy** | 2680 | 2675 (-5 pts) | 2705 (+25 pts) | 2720 (+40 pts) | 2740 (next res) |
| **Sell** | 2705 | 2712 (+7 pts) | 2680 (-25 pts) | 2665 (-40 pts) | 2650 (channel low) |
- **R:R**: Strict >1:2; 50% scale TP1, trail 20 EMA.
- **Sizing**: 0.5-1% risk (~$5-7 on SL).
- **Filters**: Volume confirm + no news.
#### Multi-Timeframe Confluence & Overall Bias
- **Higher TF (4H/Daily)**: Bullish (200 EMA hold ~2670); buy aligns perfectly.
- **Lower TF (15M)**: Micro HLs support buy.
- **Bias**: **Bullish** (70/30) – Favor buy @2680 (trend-aligned); sell as counter-trend scalp. Combined edge ~69%.
- **Risks**: DXY spike or chop → 2665 test.

S&P 500 Index: Chart Analysis After Friday’s Sell-OffS&P 500 Index: Chart Analysis After Friday’s Sell-Off
Trading on 12 December was overshadowed by a sharp decline in the S&P 500, with the session low approaching December’s previous trough.
Among the key fundamental drivers behind Friday’s drop was the market reaction to Broadcom’s quarterly report. Shares (AVGO) plunged more than 10%, possibly as investors aggressively took profits in tech stocks, concerned that the AI hype may be overheated.
A review of the 4-hour chart of the S&P 500 suggests that Friday’s negative sentiment may have begun to ease, as the index is now recovering. Overall, this presents an interesting picture from a price-action perspective.
Technical Analysis of the S&P 500 Chart
Five days ago, we noted that an ascending channel had formed in early December, which could be interpreted as cautious optimism ahead of key news.
However, Fed-related announcements triggered a surge in volatility (as we described, “the calm before the storm”), pushing prices beyond both boundaries of the blue channel:
→ The failure to hold above the upper boundary can be seen as bulls lacking confidence to challenge the all-time high. The false break around 6929 looks like a trader trap.
→ Conversely, bears may have been unable to suppress buying near Friday’s low, as indicated by the long lower wicks on the candles (highlighted by the arrow).
The chart now shows a complex Megaphone pattern (marked A–F).
It is possible that the coming week will be characterised by consolidation following Wednesday–Friday’s swings, with market sentiment increasingly influenced by the approaching holiday period.
This article represents the opinion of the Companies operating under the FXOpen brand only. It is not to be construed as an offer, solicitation, or recommendation with respect to products and services provided by the Companies operating under the FXOpen brand, nor is it to be considered financial advice.

Reading institutional intentions through Volume ProfileReading institutional intentions through Volume Profile
Price moves where money flows. Simple truth that most traders overlook the most obvious source of money information: volume.
Volume Profile shows where trading happened. Not when, but where. The histogram on the side reveals which levels attracted buyers and sellers. While beginners draw support lines by candle wicks, money flows elsewhere.
Value zones versus noise zones
Point of Control (POC) marks the price level with maximum trading volume for the period. Price spent most time here. Buyers and sellers agreed on this price. Fair value at this moment.
Value Area covers 70% of traded volume. Boundaries of this zone show where the market considers the asset undervalued or overvalued. Price gravitates back to Value Area like a magnet.
Look at the practice. Price broke the high, everyone expects growth. Check Volume Profile—volume on the breakout is tiny. Big players didn't participate. Fake breakout. Price will return.
High Volume Node and Low Volume Node
HVN appears as thick sections on the profile. Many transactions, lots of liquidity. Price slows down at HVN, reverses, consolidates. These are market anchors.
LVN shows as thin sections. Few transactions, little liquidity. Price flies through LVN like a hot knife through butter. Nothing to grab onto there.
Traders often place stops behind HVN. Big players know this. Sometimes price deliberately hits those stops to accumulate positions. Called stop hunt .
Profile types and their meaning
P-shaped profile: one wide POC in the middle, volume distributed evenly. Market in balance. Breaking boundaries of such profile produces strong moves.
b-shaped profile: volume shifted to the bottom. Buyers active at low levels. Accumulation before growth.
D-profile: volume at the top. Distribution before decline. Big players exit positions.
Using profile in trading
Find areas with low volume between zones of high volume. LVN between two HVNs creates a corridor for fast price movement. Enter at HVN boundary, target the next HVN.
When price moves outside Value Area boundaries and volume appears there—trend gains strength. New value zone forms. Old levels stop working.
If price returns to old Value Area after strong movement—look for reversal. Market rejects new prices.
Session profiles versus weekly ones
Daily profile shows where trading happened today. Weekly shows where positions accumulated all week. Monthly gives the picture of big money distribution.
Profiles of different periods overlay each other. Daily profile POC can match weekly Value Area boundary. Strong zone. Price will react here.
On futures, account for session times:
Asian session forms its profile
European forms its own
American forms its own, with heavier volume weight
Profile rotation
Price migrates between value zones. Old Value Area becomes support or resistance for the new one. Last week's POC works as a magnet on current week.
When profiles connect—market consolidates. When they separate—trend begins.
Volume and volatility
Low volume at some level means price didn't linger there. Passed quickly. On return to this level, reaction will be weak.
Volume grows at range boundaries. Battle of buyers and sellers happens there. Winner determines breakout direction.
Composite profile
Built from several trading days. Shows where main battle happened over the period. Removes noise of individual days. Picture becomes clearer.
Composite profile helps find long-term support and resistance zones. Monthly composite shows levels institutional traders will work from all next month.
Many traders build Volume Profile directly on Trading View charts. Adjust the period, watch volume distribution, plan trades.

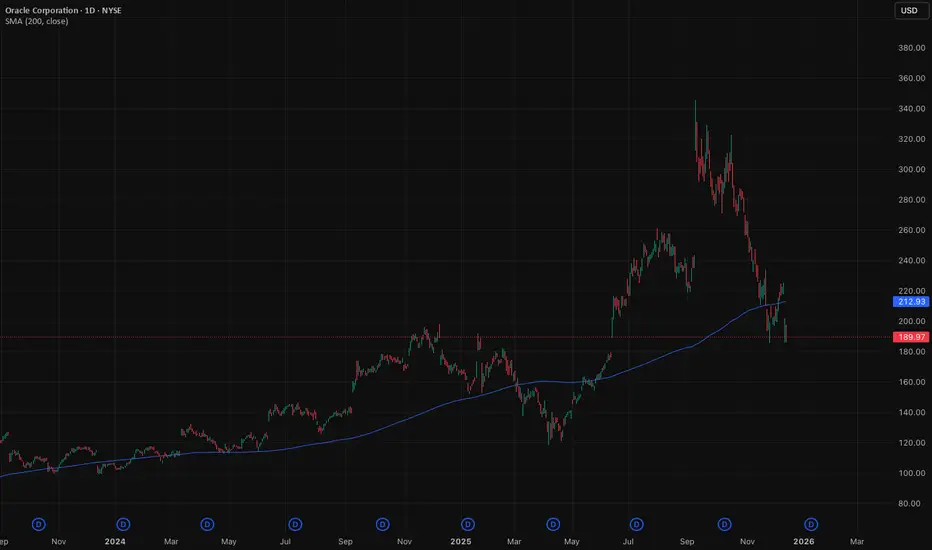
Oracle down, more to comeWe're upgrading our Oracle recommendation and maintaining our Short call. The stock is down around 30% since our initial note in September , and we think there is more downside now that the price is trading sub $200 per share.
If the stock doesn't bounce back above the 200-day moving average, we could see more downside into the mid $100 per share range. Potentially finding support around $120-125 range mark.
The forecasts provided herein are intended for informational purposes only and should not be construed as guarantees of future performance. This is an example only to enhance a consumer's understanding of the strategy being described above and is not to be taken as Blueberry Markets providing personal advice.
DAX | Hourly Outlook | BearishI will be looking for shorts from the hourly supply. On the 15m timeframe, we broke structure to the downside. I would like to see price retrace back up to the hourly supply filling the hourly fvg imbalance, and then continue to sell off back to the 15m swing low and fill the 4hr imbalance. Use the 5m/1m for entry confirmation.
Trade Safe -Remzy

"A super week" of employment dataNext week will not be a normal trading week. This is the time when the market is forced to answer a big question: will the Federal Reserve's policy pivot be sustainable, or merely a tactical adjustment in a cycle still fraught with uncertainty?
Following its December interest rate decision, the Fed officially cut rates by 25 basis points as expected. However, the market reaction showed that the key wasn't the number, but the underlying message. The dotplot chart indicated very limited, even cautious, room for further rate cuts in 2026. Nevertheless, the less hawkish statements from Chairman Jerome Powell, coupled with the Fed resuming short-term Treasury bond purchases to stabilize liquidity, produced a clear consequence: the US dollar weakened faster and more deeply than anticipated.
Against this backdrop, the upcoming trading week is seen as a "test of resilience" for the USD, as key employment and inflation data are released simultaneously, and the three major central banks in Europe and Asia also come into the spotlight.
Fed: Not overly dovish, but enough to change market expectations
On the surface, the Fed's decision resembles a "soft hawk": cutting interest rates, but the dotplot for 2026 is quite limited. However, the structure of the dotplot reveals a less-noticed fact: no single viewpoint clearly dominates.
Four members are against cutting interest rates in 2026, four support another cut, and four others lean towards two cuts. Overall, this is not a policy consensus.
More importantly, the Fed has proactively restarted short-term Treasury bond purchases as a reserve management tool. While not explicitly called quantitative easing, this move sends a clear signal: the Fed is willing to sacrifice "formal hawkishness" to ensure real financial stability.
Powell's remarks at the press conference, emphasizing the risks of a weakening labor market and viewing inflationary pressures from tariffs as temporary, reinforced the belief that the Fed would prioritize jobs over continuing to push inflation at all costs. This quickly led the market to reassess the likelihood of interest rate cuts next year, with the dollar becoming the first to face pressure.
This week shapes expectations, leaving no room for complacency.
Next week marks a period where global monetary policy expectations begin to diverge significantly. The Fed has taken a step back, but not quite surrendered. The BoE is at a crossroads of easing. The ECB maintains a balanced stance with controlled confidence. The BOJ, meanwhile, is trying to break free from its own shadow.
Against this backdrop, volatility in the foreign exchange, gold, and risk assets markets in general is likely to increase. This is not a time for emotional trading, but rather a time that demands discipline, selectivity, and the ability to correctly interpret the policy message behind the numbers.
The upcoming data week will not only answer the question of “what happened,” but more importantly, it will reveal who is truly controlling the global monetary policy narrative in 2026.
Technical Analysis and Suggestions OANDA:XAUUSD
The daily chart of gold prices shows a new uptrend being relatively fully confirmed, both in terms of price structure and momentum.
After a sharp correction from the previous peak, gold did not break the long-term uptrend structure, but only retreated to test important dynamic support zones. The price quickly held firm at the 0.236 Fibonacci level around $4,120–$4,130 per ounce, while continuing to move within the medium-term uptrend channel. This indicates that active buying pressure remains in control of the market, and selling pressure is more profit-taking than a trend reversal.
Short- and medium-term moving averages maintain an upward slope, acting as a "price cushion" during corrections. After a cooling-off period, the RSI has returned to equilibrium, leaning toward an uptrend, reflecting that upward momentum is being re-accumulated rather than weakening.
Structurally, the continuous formation of higher lows, accompanied by shallow corrections, is a typical sign of a strong uptrend. If the resistance zone around $4,330/ounce is decisively broken, the market could enter a new phase of extended upward movement.
The next technical targets are identified at:
• $4,380–$4,400/ounce: an extension zone within the ascending price channel and Fibonacci extension.
• In a scenario with stronger momentum, the price could head towards the $4,500/ounce region in the medium term.
The risk of a downward correction lies in the scenario where the price fails to break above $4,330/ounce and reverses to break the support zone of $4,200–$4,180/ounce. In that case, gold could retreat further to the $3,970–$3,850/ounce area (Fibonacci 0.382–0.5). However, as long as the price remains above this zone, the major uptrend is not yet invalidated.
Given the overall upward trend, current corrections should be viewed as opportunities for repositioning, rather than hasty reversal signals.
SELL XAUUSD PRICE 4366 - 4364⚡️
↠↠ Stop Loss 4370
→Take Profit 1 4358
↨
→Take Profit 2 4352
BUY XAUUSD PRICE 4168 - 4270⚡️
↠↠ Stop Loss 4264
→Take Profit 1 4276
↨
→Take Profit 2 4282

Is EUR/USD Ready for the Next Bullish Expansion?🌍📈 EUR/USD “THE FIBRE” – Forex Market Trade Opportunity Guide
(Swing / Day Trade)
The Euro is showing clean bullish structure as price confirms a Simple Moving Average breakout with a successful retest, backed by a MACD Golden Crossover, signaling strengthening upside momentum and trend continuation.
This setup reflects controlled accumulation + momentum alignment, ideal for both swing and active day traders.
✅ BULLISH PLAN – TECHNICAL CONFIRMATION
🔹 Simple Moving Average (SMA):
Price has broken above the SMA and respected it on the retest, indicating a shift from distribution to accumulation.
🔹 MACD Golden Crossover:
MACD line crossing above the signal line confirms bullish momentum expansion and trend-following strength.
📌 Together, these signals validate a high-probability bullish continuation environment.
🎯 ENTRY STRATEGY – THIEF LAYER SYSTEM
You may enter at ANY PRICE LEVEL after confirmation, or apply the Thief Layer Strategy for precision positioning.
🧠 Why layering works:
• Reduces emotional execution
• Improves average entry price
• Handles pullback traps efficiently
🔐 Buy Limit Layers:
1.16800
1.17000
1.17300
(You can increase or adjust layers based on volatility and account sizing.)
⛔ STOP LOSS (THIEF SL)
📍 SL @ 1.16500
Dear Ladies & Gentlemen (Thief OG’s), always adjust your stop loss based on your own risk management rules.
This SL is a reference level, not a fixed instruction.
🎯 TARGET ZONE
Price is approaching a strong resistance zone, where:
• Overbought conditions may appear
• Liquidity traps can form
• A corrective phase is likely
💰 Our Profit Zone: 1.18500
Again, Dear Ladies & Gentlemen (Thief OG’s), this TP is optional.
Protect capital first — take money when the market offers it.
🔎 RELATED PAIRS TO WATCH ($ CORRELATION GUIDE)
💵 TVC:DXY – US Dollar Index (Inverse Correlation)
EUR/USD generally moves opposite to DXY
Dollar weakness = Fuel for EUR/USD upside
Watch DXY breakdowns for confirmation of EUR strength
💷 OANDA:EURGBP – Euro Strength Indicator
Rising EUR/GBP confirms broad Euro demand
Supports continuation in EUR/USD bullish setups
Weak EUR/GBP = caution on EUR/USD longs
💱 OANDA:USDCHF – Dollar Flow Companion
USD/CHF falling = USD selling pressure
Often moves inversely to EUR/USD
Breakdown in USD/CHF strengthens EUR/USD bullish bias
💴 OANDA:EURJPY – Risk Sentiment Gauge
Bullish EUR/JPY reflects risk-on market behavior
Confirms institutional Euro buying across pairs
Adds confidence to EUR/USD upside continuation
📰 FUNDAMENTAL BACKDROP
Current Market Drivers:
🏦 Federal Reserve dovish stance (recent 25bp cut)
📉 USD in 3-week downtrend
🇪🇺 ECB policy divergence creating EUR support
📊 Technical breakout aligns with fundamental USD weakness
🧭 FINAL TAKEAWAY
This EUR/USD setup blends trend structure (SMA), momentum confirmation (MACD), and professional execution (layer entries).
When correlated pairs align, this becomes a high-quality buy-side opportunity, not a random trade.
📌 Trade smart.
📌 Respect risk.
📌 Take profits without regret.

BOJ in FOCUS. BTC COULD RETURN TO 96-97KMorning folks,
So, our gut feeling has not failed us last time as we decided to stay aside from any new longs. This week is a poor job to guess what will happen on BoJ meeting, but it definitely will be important for all crypto currencies. Theoretically, narrowing of carry trade rates difference will make a bad service to BTC, as a most volatile asset...
Still, now we have a bullish grabbers on the daily chart. They look tempting. Especially because they do not demand far standing stops... I'm not confident with them at 100%, taking in consideration overall weak performance, but it is possible to risk and try them. If they will work BTC will return back to 96.4 - 97K area and finally complete our AB-CD target.
As an option, you could wait for 1-2 more sessions, as we have time until BoJ still. And we can wait for more confirmation on intraday charts. So, no need to hurry up by far...

Market Analysis: NZD/USD Test Support, Break or Bounce Next?Market Analysis: NZD/USD Test Support, Break or Bounce Next?
NZD/USD is consolidating and could aim for a move above 0.5800 in the short term.
Important Takeaways for NZD/USD Analysis Today
- NZD/USD is consolidating above 0.5765 and 0.5755.
- There is a major bullish trend line forming with support at 0.5765 on the hourly chart of NZD/USD.
NZD/USD Technical Analysis
On the hourly chart of NZD/USD, the pair also followed AUD/USD. The New Zealand Dollar failed to stay above 0.5800 and corrected gains against the US Dollar.
The pair dipped below 0.5790 and the 50-hour simple moving average and 0.5830. A low was formed at 0.5765, and the pair is now consolidating below the 23.6% Fib retracement level of the downward move from the 0.5831 swing high to the 0.5765 low.
The NZD/USD chart suggests that the RSI is below 40, signaling a short-term negative bias. On the upside, the pair is facing resistance near the 50% Fib retracement level at 0.5800.
The next major hurdle for buyers could be 0.5815. A clear move above 0.5815 might even push the pair toward 0.5830. Any more gains might clear the path for a move toward the 0.5880 pivot zone in the coming sessions.
On the downside, there is support forming near the 0.5765 zone and a bullish trend line. If there is a downside break below 0.5765, the pair might slide toward 0.5740. Any more losses could lead NZD/USD into a bearish zone to 0.5710.
This article represents the opinion of the Companies operating under the FXOpen brand only. It is not to be construed as an offer, solicitation, or recommendation with respect to products and services provided by the Companies operating under the FXOpen brand, nor is it to be considered financial advice.

GBPCAD Is Loading… Breakout or Breakdown?Hello friends, today we are going to analyze and review the GBPCAD together. I would be happy if you share your opinions in the comments.
Price on the 4H timeframe has been ranging for a considerable period of time, moving within a clearly defined range structure. This consolidation between the marked support and resistance zones indicates market compression, which often precedes a strong directional move once price breaks out of the range.
At the moment, price is trading at a key decision area, where the next major move is likely to be determined 👇
🔼 Bullish Scenario
If price manages to break above the range high / key resistance with a valid candle close and holds above it:
Market structure can shift toward forming a new Higher High
Upside targets marked on the chart become active
A pullback into the broken resistance could offer lower-risk long opportunities
This scenario is only valid with a confirmed breakout and acceptance, not just a wick or temporary spike.
🔽 Bearish Scenario
If price:
Breaks below the range support and ascending trendline
Then retests the broken level from below
We can expect:
Activation of a short setup after the break
Continuation toward the lower support zone marked on the chart
In this scenario, traders should remain cautious of false breakouts and sharp reversals.
⏳ Important Note
Price has been consolidating inside this range for an extended period. Historically, the longer the consolidation, the stronger and more impulsive the move after the breakout.
Therefore, waiting for clear confirmation is crucial in this area.
⚠️ Disclaimer
This analysis represents personal opinion only and is not financial advice.
Proper risk management, stop-loss placement, and personal confirmation are essential before entering any trade.
📣 What’s Your Bias?
❓ Do you think price will:
🔼 Break to the upside?
🔽 Break down?
⏸️ Continue ranging?
Share your thoughts in the comments 👇
If you found this analysis helpful, don’t forget to ❤️ and follow 🙏

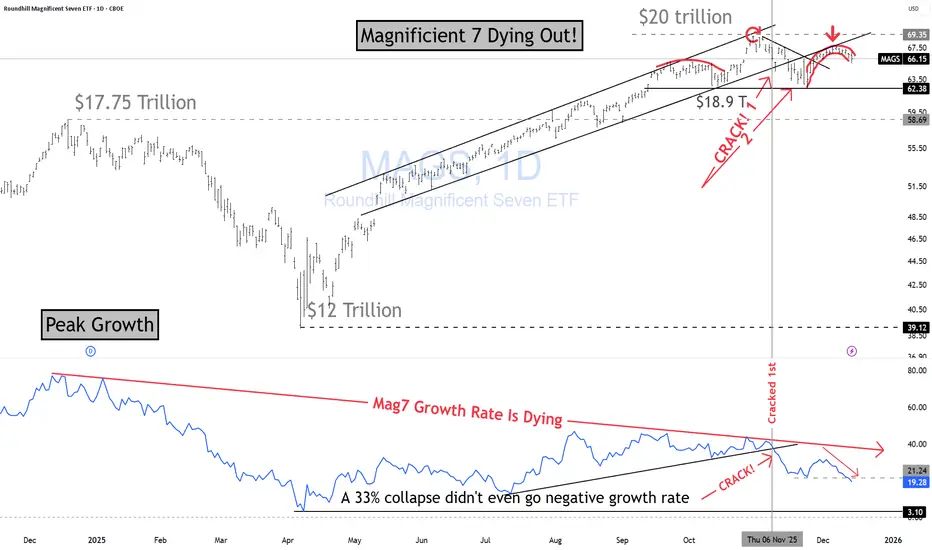
MAG7 Are Dying!Magnificent Seven Are Dying!
Here is why using my BKC method.
$20T in market cap. at $69.35
$18.9T Recent low
$17.7T Prior peak (Dec 24th)
$12T "Liberation Day" LOL! low (Apr 2025)
Growth Rate (Lower Panel)
• Growth rate peaked in Dec 2024 at ~85%.
• Since then, it has steadily deteriorated.
• Hit an all-time low of 3.1% around Liberation Day — even after a 33% drawdown, the rate never went negative! Imagine that! Where will price go when does go negative?
This is classic topping behavior: price making higher highs while growth momentum dies.
Price Structure (Upper Panel)
The Mag7 have been trading in a rising channel while the growth rate trends lower — a divergence setup.
Key structural points:
Head & Shoulders clearly formed at the top of the channel.
Red arrow circle marks the subtle but important failure: price couldn’t even touch the upper boundary of the channel → early weakness signal.
Crack #1: before the major breakdown.
Crack #2: Fri, Nov 7, 2025, confirmed again on Nov 13, 2025.
After that, price has been trading below the rising channel, confirming a structural shift.
Developing boomerang rejection: price returns to the channel underside and gets denied — classic failed-retest behavior.
Growth Rate Confirmation (Lower Panel)
The growth-rate panel confirms the sequence:
• The growth-rate crack showed up before the second price crack → momentum broke first, price followed.
This entire structure points to weakening upside momentum, failed retests, and a maturing top.
If you're still holding these names, ask yourself one thing:
What exactly are you waiting for?
• A 100% gain? That would require a $40T market cap.
• A 50% gain? That’s a $30T market cap.
Be honest with yourself: is that risk/reward realistic?
If you’re going to stay in this game, do it the right way.
Learn how to read a chart properly.
My goal is simple — to help you get better, think clearly, and avoid avoidable damage.
If you can’t see the massive head & shoulders, the major divergence, and the broken uptrend… I don’t know what to tell you.
All I can do is spark your curiosity and push you to do your own analysis.
THANK YOU for getting me to 5,000 followers! 🙏🔥
Let’s keep climbing.
If you enjoy the work:
👉 Drop a solid comment
Let’s push it to 6,000 and keep building a community grounded in truth, not hype.
Gold (XAU/USD) Price Outlook📊 Technical Structure
OANDA:XAUUSD Gold surged toward $4,335 but failed to sustain above the $4,326–$4,337 resistance zone, producing a clear rejection wick that signals fading bullish momentum near a multi-week high. Price is now pulling back toward the mid-range and remains vulnerable to a deeper correction as long as it trades below the resistance ceiling.
The structure shows a potential lower-high formation, and the market may revisit the $4,271–$4,263 support zone if sellers defend the resistance. Only a clean breakout above $4,345 would invalidate the short-term bearish bias and reopen room for continuation to the upside.
🎯 Trade Setup (Bearish Scenario)
Entry: 4,326 – 4,337
Stop Loss: 4,345
Take Profit 1: 4,271
Take Profit 2: 4,263
R:R Ratio: ~1 : 3.24
Bias remains bearish as long as price stays below 4,345 on an hourly close.
🌐 Macro Background
Gold is supported by expectations of Fed rate cuts next year, which lower the opportunity cost of holding non-yielding assets. Safe-haven demand also remains elevated due to geopolitical tensions, keeping gold attractive at higher levels.
However, several hawkish remarks from Fed officials last week have limited the bullish drive, allowing the US Dollar to stabilize and pressuring gold from the top. Ahead of Tuesday’s US employment reports for October and November—including NFP, Average Hourly Earnings, and Unemployment Rate—traders may reduce long exposure, contributing to a short-term pullback.
Overall, while the medium-term backdrop favours gold upside, the short-term technical picture suggests the potential for a corrective drop before buyers re-engage.
🔑 Key Technical Levels
Resistance Zone: 4,326 – 4,337
Support Zone: 4,271 – 4,263
Invalidation Level: 4,345 (bearish idea invalid)
📌 Trade Summary
Gold has rejected strong resistance near multi-week highs, and technical momentum indicates room for a correction toward the support zone at 4,271–4,263. As long as price remains capped below 4,345, short positions from the resistance zone remain favourable. A breakout above 4,345 would shift the bias back to bullish continuation.
⚠️ Disclaimer
This analysis is for reference only and does not constitute trading advice. Trading involves significant risk, and proper risk management is essential.

Nikkei - short at openingNikkei is in a downtrend. Good zone to short here as the order block and OTE are overlapping.
