US500 Strong Bullish MomentumFundamental Analysis
The current bullish trajectory of the US500, is overwhelmingly earnings driven. Robust Q3 corporate results, notably massive beats from tech and consumer giants like Apple with record iPhone sales and services, Amazon’s cloud revenue surge , have provided a decisive fundamental lift. This resilient performance has overshadowed macro uncertainties around Fed policy caution, trade tensions and cemented investor confidence in double digit earnings growth projections for 2026. The rally is characterized by solid breadth, extending beyond mega caps to sectors like Energy, suggesting a durable economic foundation.
Technical Analysis
The US500 exhibits strong bullish momentum, on track for its best monthly streak in years. The index is testing a critical resistance zone between 6,885 and 6,890, formed by the convergence of long-term trend lines. A confirmed weekly close decisively above 6,900 is necessary to validate a powerful breakout toward the psychological 7,000 level and signal an acceleration in the uptrend. Short term downside is currently contained by strong support levels, indicating that pullbacks are likely to be met with active dip buying.
Outlook
The overall outlook for the US500 is constructively bullish into year end. As positive earnings guidance reinforces investor sentiment, the path of least resistance remains higher. However, given the proximity to all time highs and critical technical resistance, short-term volatility and consolidation are likely as the market digests the risk of stretched valuations e.g. (Nvidia's high GDP ratio is a notable concern) before attempting a sustainable move toward the 7,000 mark.
Analysis is by Terence Hove, Senior Financial Markets Strategist at Exness
Fundamental Analysis

Space/Defense NASDAQ:VELO has quite the interesting history ended up being saved from bankruptcy by SpaceX. The company serves major clients like Lockheed Martin, Boeing, and Relativity Space, with a focus on scaling production for space exploration and defense with 3d metal printing. I saw today only on X that they strategically moved from CA to Texas directly adjacent to $TSLA. I havent confirmed from any other sources so not sure if this is accurate. SpaceX i believe is there biggest client so it would make sense that they start working with tesla. There's plenty of 3d printing competition that makes good money they burn a fair amount of cash and are not profitable for now will likely need to continue raising cash to expand there newly aimed rapid pace production. Those will be the opportunities I take in the future to buy if it tanks on offerings. Im currently holding shares from around $5 as long as that conties to hold i see good upside to 8 resistance area and much higher once they start gaining some traction. New management recently has changed the trajectory of the company in a major way and will hopefully be able to scale quickly. Earnings are coming up soon so that should give us some good info. Pretty low volume big swings but I think theres pretty big potential here also, especially long term.

IQiyi (IQ) - updating the Chart and story-trading during crisisNASDAQ:IQ some notes on the iqiyi chart.
1: fundamentals: the stock is expected to earn 20 cents this year and eventually grow to 50 cents per share eps, earnings power and earnings growth is very attractive at current prices.
2:Technicals: 2.00 level is significant for may and june options cycle. could we be in a major wedge at the 3 to 1.50 levels, marking a coiling up area. we took out the all time low of oct 2022 and make a new low around 1.50. , could this become a major accumulation zone during the trump/china tarriff crisis?
3.Sentiment: chinese stocks are very hated and under owned, there are many chinese stocks trading at or below tangible book value, news is very dark seeming for trade in china, with many chinese manufacturers shutting down due to lack of usa product demand with tarriff uncertainty.
Bullish
I love moments like this. they are not easy to trade and invest in. But they are real time history happening before our eyes. Sand through your hands. Remember these times.

$EUIRYY -Europe CPI (October/2025)ECONOMICS:EUIRYY 2.1%
October/2025
source: EUROSTAT
-Euro area consumer price inflation eased to 2.1% in October 2025,
in line with market expectations and down from 2.2% in September,
edging closer to the ECB’s 2% target, according to preliminary data.
Food, alcohol, and tobacco prices rose more slowly at 2.5%, versus 3.0% the previous month, led by both processed (2.4% vs 2.6%) and unprocessed food (3.2% vs 4.7%). Non-energy industrial goods inflation eased to 0.6% from 0.8%, while energy costs fell more sharply at -1.0% versus -0.4%.
In contrast, services inflation accelerated for a second straight month to 3.4%, the highest since April, while core inflation, excluding energy, food, alcohol, and tobacco, remained stable at 2.4%, slightly above forecasts of 2.3%.

All Priced In - Selling to CommenceFundamentals all baked in with price to sales ratio at previous 2021 post-covid highs will push to profit locking and selling pressure.
NASDAQ:GOOGL price target in the ~$230 range.
RSI weekly divergence and upper log line hit confluence with top fundamental ratios.

We could see a $56T Total Market Cap by the Beginning of 2030!In my opinion, we could see a $56T+ Total Crypto Market Cap by January of 2030. You can see on the weekly time frame that we're following a very strong support trend line that dates back for years. Bear cycle bottoms retest previous bull cycle tops and in 2026 and 2027 they may not be much different. We could see a potential $12T cycle top for 2026.
There are several catalysts that could change our trajectory, and that could include the Crypto Clarity Act which is projected to be approved in Q4 2025, as well as the adoption of the Alt coin ETF'S as more come online.
I acknowledge that since we've only seen several cycles, there are limited data points on how strong this line of support really is. But remember that in these early adopter markets, history may not repeat but it sure does rhyme!

London Manipulation, New York Expansion – US30 Outlook-Tokyo session built accumulation after liquidity sweep, setting a clean base.
-London delivered a perfect manipulation below Asian lows, leaving a fresh bullish FVG.
As long as price holds above 47,650–47,700,
-New York is likely to continue the expansion phase toward 48,050–48,100.
Below 47,600, a CHOCH may form before another push.
Smart Money narrative stays bullish — accumulation, manipulation, and now distribution.
#US30 #SmartMoneyConcepts #PriceAction #FVG #ICT #MarketStructure

Why Bitcoin Needs a Sharper Decline for a Healthy ResetThe crypto market experienced its most devastating liquidation event in history on October 10, 2025, when over $19 billion in leveraged positions were wiped out in a mere 24 hours, affecting more than 1.6 million traders. Bitcoin's price plunged from a high of approximately $122,500 to a low of $102,000—a 14% drop—triggering a cascade of forced sales across exchanges. This catastrophe not only liquidated countless retail traders but also ensnared several high-profile institutional players, amplifying the pain. Compounding the issue, retail participation was already alarmingly thin heading into the event, with on-chain metrics showing diminished small-holder activity and wallet inflows compared to earlier in the year. This scarcity of fresh retail capital left the market vulnerable, as the event exposed underlying fragilities rather than purging them entirely.
In my view, Bitcoin requires a more decisive pullback, akin to the 32% correction witnessed from February to April 2025, to engineer a true reset and lay the groundwork for sustainable upside. That earlier dip saw BTC plummet from its January all-time high of around $110,000 to a local bottom of $74,500, shaking out overleveraged positions and replenishing liquidity pools that had dried up during the preceding rally. Far from derailing momentum, this correction acted as rocket fuel: post-dip accumulation by whales and institutions sparked a vigorous rebound, propelling BTC to fresh all-time highs by mid-year. Such drawdowns are not anomalies but essential mechanisms in Bitcoin's cyclical nature, flushing speculative excess and attracting sidelined capital at discounted valuations.
Relying on market makers like Binance, Coinbase, and Wintermute to artificially buoy prices indefinitely is a precarious strategy. These entities can facilitate short-term pumps through liquidity provision and order flow management, but they cannot manufacture genuine demand. A telling sign of this artificiality is the stark divergence in Bitcoin's trading dynamics throughout 2025: while prices have broadly trended upward, spot and derivatives volumes have steadily declined in recent months, signaling fading conviction among participants and potential exhaustion in the bullish trend.
Without a sharper decline to realign supply-demand imbalances, perhaps targeting 20-30% downside from current levels, the rally risks stalling into a prolonged range or worse, a capitulation cascade. History underscores that Bitcoin's most explosive legs higher follow periods of capitulation, not complacency; a reset now could be the prelude to $150,000+.
Volatility is our friend not our foe

XNG ( Natural Gas)⚡ Natural Gas Showing Stronger Short-Term Potential Than WTI! 🌿
While crude oil (WTI) is struggling to find firm direction, Natural Gas is heating up with renewed momentum.
✅ Weather shifts are boosting short-term demand.
✅ Technical structure looks cleaner with higher lows forming.
✅ Fundamentals favor gas — seasonal consumption is rising while supply remains tight.
Meanwhile, WTI is consolidating under resistance, showing less conviction from buyers.
📊 Short-Term View:
👉 Natural Gas — Bullish Bias
👉 WTI Crude — Neutral
Energy markets often move together, but this time Natural Gas looks ready to lead the way. 🔥
#NaturalGas #WTI #Commodities #EnergyMarkets #TradingView #BullishSetup #GasVsOil #ShortTermTrade

XAUUSD 🟡 Gold Market Update | XAUUSD Outlook [
Gold is currently trading around 4040, showing strong signs of bearish momentum as traders continue to lock in profits after the recent rally.
From a fundamental perspective, gold remains under pressure as major institutions and banks appear to be taking profits, suggesting that the upside momentum could be losing steam.
If this selling pressure continues, we could see further downside moves toward the following key support targets:
3965
3905
3850
3800
3650 and below
Technical Bias: Bearish
Fundamental Bias: Bearish
Trading Plan: Watching for lower highs and potential breakdown confirmations on the 4H and Daily charts.
📉 A break below 3965 could accelerate the bearish move toward deeper support levels.
RISK : This is Not investment Advice

HYPEUSDT – Watching a Key Support Zone for Long SetupHYPEUSDT is currently pulling back and heading toward a major support area at $42–$43. This zone has historically provided strong buying interest and could act as a platform for a reversal. We’re closely watching this level for a potential long swing trade opportunity.
🛠 Trade Setup
Entry Zone: $42 – $43 (Support Area)
Take Profit Levels:
• TP1: $53
• TP2: $59
Stop Loss: $38 (Just below structure)

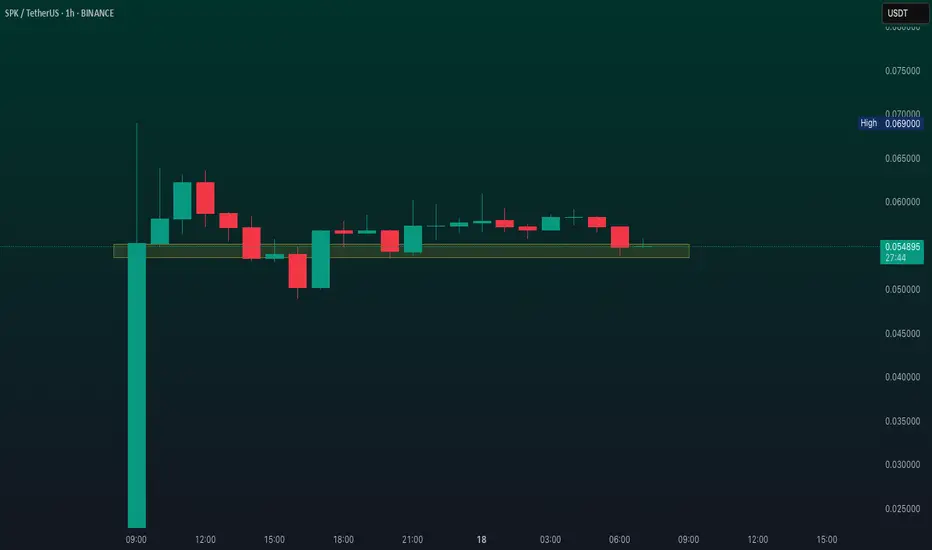
What Happened to SPK?SPK’s Binance HODLer airdrop distributed 200M tokens (2% of total supply) to users who staked BNB between June 10–14. Recipients immediately sold ~300M SPK ($18M at peak prices), overwhelming demand. With 17% of supply circulating at launch, the sell-off triggered a liquidity crisis on exchanges like Bybit, where order books lacked depth to cushion the drop. This mirrors historical airdrop failures (Arbitrum, Starknet), where tokenomics prioritized short-term rewards over sustainable demand 👀
BTC: 112k caps, 108.5k–106.5k defends__________________________________________________________________________________
Market Overview
__________________________________________________________________________________
BTC trades in a range with a bearish intraday tilt, while 12H/1D remain constructive. ETF outflows and a risk-off tone still cap sustained upside.
Momentum: 📉 Bearish within a 112k–106k range; rebounds capped below the 111.9k–112.2k flip.
Key levels:
• Resistances (4H/12H/1D): 111,900–112,200 (flip), 115,500–116,030 (HTF supply), 120,800–121,000 (1D/2D cap).
• Supports (12H/4H/1H): 108,482 (12H pivot), 106,050–106,500 (Cluster A 30m/4H), 102,530–102,790 (Cluster C 1H/2H/12H).
Volumes: Overall normal; very high prints at the recent 15m low — more “flush” than fresh catalyst.
Multi-timeframe signals: 1D/12H up; 6H/4H/2H/1H/30m/15m down — bearish confluence below 112k; key supports at 108.5k then 106.05–106.50k.
Risk On / Risk Off Indicator context: NEUTRE VENTE — it contradicts HTF momentum and argues for caution until 112k is reclaimed.
__________________________________________________________________________________
Trading Playbook
__________________________________________________________________________________
Strategic stance: range with intraday pressure — favor reactive entries at HTF floors, avoid chasing.
Global bias: NEUTRE VENTE near current prices; tactical invalidation on firm acceptance > 111,972 with volume.
Opportunities:
• Buy: confirmed reaction at 108,482 or 106,050–106,500; target 111,972 then 113.5–115.5k.
• Breakout buy: acceptance > 111,972 with volume; target 115.5–116.0k, stretch 120.8–121.0k.
• Tactical sell: rejection at 111,900–112,200 or 115.5–116.0k, aiming 108.5k then 106.5k/106.05k.
Risk zones / invalidations: Clean break < 106,048 opens 104.59/103.66 then 102.53–102.79; acceptance > 112k opens 115.5–116k.
Macro catalysts (Twitter, Perplexity, news):
• Fed to end QT on Dec 1 → liquidity tailwind, timing uncertain.
• Spot BTC ETF outflows → near-term headwind for trends.
• LTH distribution; STH cost basis near ~113k → rallies capped below 112–113k.
Action plan:
• Long (reactive): Entry: 108.6k (12H/2H confirmation) or ~106.3k (Cluster A) / Stop: below floor / TP1: 111,972, TP2: 113.5k, TP3: 115.5k / R:R ≈ 1:2–1:3.
• Short (tactical): Entry: rejection 111.9–112.2k / Stop: above the rejected band / TP1: 108.5k, TP2: 106.5k, TP3: 106.05k / R:R ≈ 1:2.
__________________________________________________________________________________
Multi-Timeframe Insights
__________________________________________________________________________________
HTFs (12H/1D) support buy-the-dip, while intraday frames remain bearish below 112k.
1D/12H: Uptrend but range-bound 112k–106k; 108,482 holds as pivot; acceptance above 111,972 opens 115.5–116.0k.
6H/4H/2H/1H/30m/15m: Lower highs persist; repeated failures at 111.9–112.2k; watch for a sweep into 106,050–106,500 if 108,482 fails. The tight 102,53–102,79 cluster is a magnet if pressure extends.
Major confluences: The 111.9–112.2k flip governs any relief; 106.05–106.50k concentrates multiple floors (30m/4H), with depth at 102.53–102.79.
__________________________________________________________________________________
Macro & On-Chain Drivers
__________________________________________________________________________________
Macro liquidity is set to improve, but crypto-specific flows remain hesitant — fostering two-way volatility inside the range.
Macro events: Fed ending QT on Dec 1 (liquidity positive); calmer European rates backdrop; managers heavily long risk with abundant cash sidelined — selective deployment.
Bitcoin analysis: Recent spot BTC ETF outflows weigh on upside attempts; pivot near 108.6k, with sub-106k flush risk if 108.5k gives way.
On-chain data: Elevated LTH distribution; STH cost basis near ~113k — a tactical lid until reclaimed.
Expected impact: Risk-off flows support a cautious bias below 112k; strong reactions at HTF floors can still spark relief.
__________________________________________________________________________________
Key Takeaways
__________________________________________________________________________________
Range-bound with a bearish intraday skew.
- Overall trend: neutral-to-bearish short term; turns constructive only above 112k with volume.
- Most relevant setup: reactive buys at 108.5k or 106.05–106.50k with confirmation; or tactical sells on 111.9–112.2k rejection.
- One macro driver: QT ends in December, but ETF outflows remain a headwind.
Stay disciplined: let levels lead, react to holds/breaks — don’t pre-empt. ⚠️

BKKT — Streamlined, Debt-Free, and Aiming at Stablecoin + AICompany Overview:
Bakkt NYSE:BKKT is a regulated digital asset platform offering crypto trading, custody, and financial services to both institutions and retail—positioning itself as a pure-play crypto infrastructure provider in the $2.7T digital asset market.
Key Catalysts:
Bitcoin Treasury + Institutional Tailwind: Leveraging the BTC rally and a treasury strategy to align with accelerating institutional adoption.
Portfolio Simplification: Sale of the loyalty business and Up-C reorganization streamline ops, upgrade governance, and boost investor appeal.
Balance Sheet Strength: Now debt-free after redeeming all convertible notes—greater optionality for growth initiatives.
New Verticals: Well-capitalized to expand into stablecoin infrastructure and AI-driven finance, widening recurring-revenue opportunities.
Investment Outlook:
Bullish above: $21.00–$22.50
Target: $68.00–$70.00, supported by clean capital structure, regulatory footing, and expansion into stablecoins + AI finance.
#BKKT #DigitalAssets #CryptoCustody #Stablecoins #AIFinance #FinTech 🚀

Can Short-Term Holders Rescue Ethereum From a Drop to $3,500?At the time of writing, Ethereum is trading at $3,846, holding just above the $3,802 support level. The altcoin king is likely to remain rangebound as market conditions show limited volatility.
Ethereum’s price currently fluctuates between $4,154 and $3,802. This consolidation range could persist in the coming sessions, with ETH possibly retesting resistance if short-term momentum returns.
However, if bearish conditions intensify and Ethereum loses the $3,802 support, a further drop could follow. A breakdown below this level may send the price under $3,742 and toward $3,500, invalidating the bullish thesis and signaling deeper market weakness ahead.

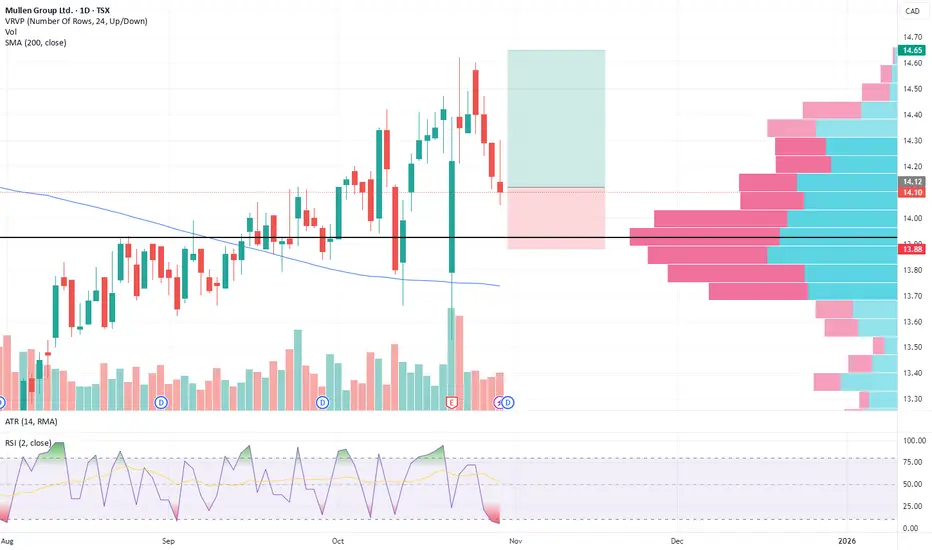
Mullen Group Ltd. (TSX: MTL) - Swing Trade💰 MTL — Swing Trade Breakdown
🏢 Company Snapshot
Mullen Group Ltd. (TSX: MTL) is a Canada-based logistics and trucking services company with operations across Canada and the U.S., covering less-than-truckload (LTL), warehousing & logistics, specialized services, and international freight. It’s attracting attention due to its moderate valuation, attractive monthly dividend, and potential swing-trade opportunity as the freight/transportation sector hints at recovery.
📊 Fundamentals
P/E: ~13.6× (slightly undervalued vs peers)
P/B: ~1.2× (modest book multiple)
Debt/Equity: ~1.17 (moderate leverage)
ROE: ~9.9% (lower than peers)
Dividend Yield: ~5.8% (appealing income component)
Free Cash Flow: Positive, modestly improving
Cash on Hand: Provides short-term flexibility
Summary: Balanced fundamentals — moderate valuation, decent dividend, but profitability is weak and debt is non-trivial.
📈 Trends & Catalysts
Revenue Growth: ~5.5% YoY
EPS Trend: Slightly declining year-over-year
Cash Flow Trend: Positive and improving
Balance Sheet: Moderate debt, adequate cash reserves
Catalysts: Potential rebound in freight demand, high dividend yield, possible growth through acquisitions
Risks: Rising fuel and regulatory costs, margin pressure, competitive market, leverage risk
🪙 Industry Overview
Weekly: Slightly down, short-term softness in freight demand
Monthly: Moderate uptrend, signals of capacity tightening
12-Month: Underperforming broader market, freight cycle correction and cost pressures
Industry commentary: Canadian trucking faces rising costs, driver shortages, and regulatory challenges, but gradual stabilization or recovery is possible.
📐 Technicals
Price: ~CAD 14.10
50-SMA: ~CAD 13.89 (current price above)
200-SMA: ~CAD 13.76 (long-term trend confirmation)
RSI(2): 4.9
Pattern: Consolidation around moving averages
Support: CAD 13.00–13.50
Resistance: CAD 15.50–16.00
Volume: Average, no breakout yet
🎯 Trade Plan
Entry Zone: CAD 13.30–14.00 (near support or pullback)
Stop Loss: CAD 12.80 (below key support)
Target: CAD 16.00 (next resistance / swing target)
Risk/Reward: ~2×
Alternate Setup: Breakout above CAD 16.00 could target CAD 18.00
🧠 My Take
MTL presents a moderate bullish swing-trade opportunity. Fundamentals are balanced with an attractive dividend, but profitability is low and debt is moderate. Technically, it’s consolidating, so I’d look for a pullback to support or a strong breakout above CAD 15.50 before entering. The 1:2 R/R swing setup is favorable if executed near key levels.
Gold (XAUUSD) Intraday Trade Plan
Analyzing the XAUUSD 4-hour chart for a potential fast scalp setup. Key levels are in focus, with a buy zone identified around 3,975. The trade plan highlights the importance of being cautious of external catalysts, specifically noting "TRUMP twit" as a potential source of volatility. Discipline in risk management is key when trading around such high-impact zones. #GoldTrading #XAUUSD #ForexAnalysis #TradingSetup #RiskManagement

EURGBP 31.10.2025+ CB (ECB: held, no cuts in the near term; BoE: the rhetoric and data suggest cuts are coming—just at a slower pace.)
+ EU GDP Beat; DE CPI Beat
- UK Budget, stagflation risks

Whipsaw to fresh support for EUR/USD?Following the BoJ’s lead, the ECB held all three key rates unchanged for a third consecutive meeting yesterday – as expected – leaving the deposit rate at 2.00%. The decision should not have raised many eyebrows and reflects the central bank’s view that monetary policy remains in a ‘good place’. As you would have expected, guidance was pretty limited; the accompanying rate statement reiterated that the central bank remains on a ‘data-dependent and meeting-by-meeting approach’.
In her press conference, ECB President Christine Lagarde highlighted the economy’s growth despite headwinds, although she acknowledged geopolitical tensions, trade negotiations, as well as France’s budget crisis and Germany’s delayed fiscal stimulus.
As I am sure you are aware, eurozone inflation continues to meander around the central bank’s 2.0% target – we have September’s print landing later today – with Q3 economic activity growing by 0.2% (surpassing expectations of 0.1%), according to preliminary flash estimates, and unemployment remaining near historic lows.
The market reaction to the ECB announcement was muted, though should the EUR continue to rally, this could eventually lead to another rate reduction, particularly if it threatens economic recovery. A stronger EUR increases export costs while reducing import prices, potentially compressing export revenues and dampening inflationary pressures. In terms of future policy cuts, most analysts I have spoken with believe the central bank is done and dusted with rate cuts, though money-market expectations suggest a potential 25-bp cut later next year. The focus now shifts to December’s meeting, which will offer updated quarterly economic projections.
As for the technicals I am watching on the EUR/USD right now, we can see that long-term flow recently rejected monthly resistance between US$1.2028 and US$1.1930, with scope to continue pressing south until monthly support as far south as US$1.1457. With that in mind, a break below US$1.1540ish on the daily chart opens the door for a run on sell-stops to test support from US$1.1490. Given this support, and the monthly support positioned below at US$1.1457, this area could be a location EUR/USD longs make a show from.
Written by FP Markets Chief Market Analyst Aaron Hill

NZDUSD 31.10.2025+ Fed-RBNZ policy divergence (Fresh update: Fed cut 0.25, but not sure when to cut again and if to cut at all, super data-dependent)
~+ CN NBS Mfg PMI Miss

AUDNZD 28.10.2025~+ RBA-RBNZ divergence
~+ AU data beat (recent S&P Serv&Mfg, expected and released AU CPI Beat)

AUDJPY 27.10.2025* Risk-on on a possible deal between Trump with XI
* New JP PM is pro-stimulus
~+ BoJ isn't sure when to hike again

XAUUSD 27.10.2025* Bullish Narrative about gold is still in play, but the move needs some technical correction
* Shift to risk-on around due to the US gvt shutdown ending and a possible meeting Trump with Xi - good trigger for a technical-based trade
