ES (SPX, SPY) Analysis, Levels, Setups for Tue (Nov 25th)Market Outlook: Analyzing Technical Trends and Economic Indicators
The recent rebound from the 6520–6450 support zone has generated a constructive short-term outlook. However, the market now approaches a significant supply area in the 6800 range. While the immediate trend appears to favor modest gains, contingent upon maintaining support between 6660 and 6645, a pivotal decision zone resides between 6765 and 6815. A strong acceptance above this band could trigger an upward movement towards 6855–6930, while failure to hold could lead to a corrective phase targeting 6690, 6625, and potentially 6550.
Upcoming Economic Data: November 25
The week ahead is marked by a wealth of economic data expected to impact trading activity, particularly in the U.S. housing market and consumer sentiment. Key reports scheduled for Tuesday morning include the S&P/Case-Shiller Home Price Index for September, the Conference Board Consumer Confidence Index for November, Pending Home Sales for October, and the Richmond Fed Manufacturing Index. These releases, set for the 9:00–10:00 ET window, could introduce volatility into the markets.
Recent trends in consumer confidence have suggested a dampened sentiment due to the prolonged government shutdown and slow job growth. A disappointing report could perpetuate discussions of recession and further Fed interest rate cuts, while an unexpected improvement would likely support the current risk-on sentiment.
On the corporate front, pre-market earnings from major players like Analog Devices, Alibaba, Best Buy, Dick’s Sporting Goods, J.M. Smucker, and NIO could further influence market dynamics in the early hours, especially if there are surprises in their guidance.
Technical Analysis: Higher-Timeframe Perspective
From a higher-timeframe standpoint, the daily chart reflects a completed down-swing exiting the prior weak high around 6930, retracting to the extension zone between 6525 and 6455 where buyers have demonstrated strong interest. This low now appears as a "strong low" in technical analysis terms, aligning with higher timeframe discount levels and previous demand signals. Oscillators indicate a shift from oversold conditions, currently suggesting a corrective rally rather than an immediate resumption of a downward trend.
However, trading remains constrained within a 4-hour supply band between approximately 6765 and 6815. This range is characterized by the last notable lower high and previous sell-side momentum that precipitated the significant drop to 6520. Unless price breaches the 6815 threshold, the overall swing structure continues to reflect a "lower-high" scenario, which necessitates caution for any bullish positions as they occur within a broader corrective framework.
Intraday Trading Dynamics: Expectations for the Day
Analyzing the intraday structure on the 1-hour and 30-minute charts reveals that Monday’s trading culminated in a robust upward trend from the London low of 6625 to the New York AM low of 6646, concluding with a consolidation phase just beneath the Asia session high at 6724. The cluster of highs around 6715–6725 precisely correlates with an intraday equilibrium line situated just below the upper edge of the 4-hour supply band.
Volume data indicates strong buying activity emerging from the base established at 6520–6625, tapering off as prices approached the 6715–6725 range. Further insights from the 1-hour oscillator hint at a cooling in momentum, suggesting that initial price reactions may favor mean reversion rather than an unimpeded breakout.
Looking ahead into the New York trading hours:
- Asia Session: Anticipate a trading range likely between 6700 and 6730, with potential stop raids above 6725 and minor retracements towards 6685.
- London Session: If buyers can sustain the 6685–6660 level during potential pullbacks, this could establish a foundation for another attempt at reaching the 6765–6815 supply zone during the New York data release.
- New York Open: Provided that the 6660–6645 area holds during 15-minute closes, the baseline scenario suggests a rotation into the 6765–6815 decision band between late London and early New York. A significant rejection in this zone, characterized by long upper wicks and unsuccessful 15-minute closes above 6815, would favor a pullback towards 6690–6710 by day’s end. Conversely, clear acceptance above 6815 on robust volume would pave the way for targets at 6855 and potentially back to 6930.
Key zones
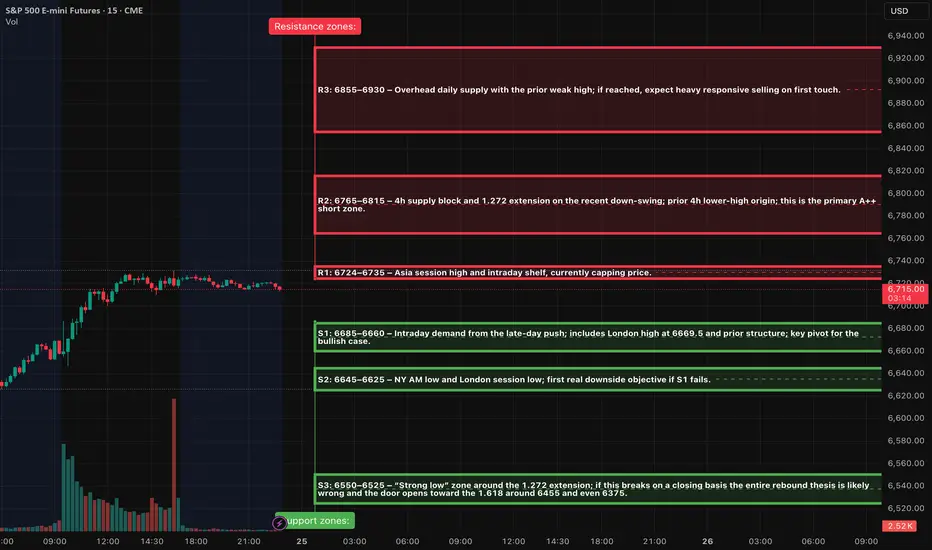
Resistance zones:
R1: 6724–6735 – Asia session high and intraday shelf, currently capping price.
R2: 6765–6815 – 4h supply block and 1.272 extension on the recent down-swing; prior 4h lower-high origin; this is the primary A++ short zone.
R3: 6855–6930 – Overhead daily supply with the prior weak high; if reached, expect heavy responsive selling on first touch.
Support zones:
S1: 6685–6660 – Intraday demand from the late-day push; includes London high at 6669.5 and prior structure; key pivot for the bullish case.
S2: 6645–6625 – NY AM low and London session low; first real downside objective if S1 fails.
S3: 6550–6525 – “Strong low” zone around the 1.272 extension; if this breaks on a closing basis the entire rebound thesis is likely wrong and the door opens toward the 1.618 around 6455 and even 6375.
A++ Setup 1 – Short fade from 6765–6815 (Tier-1 rejection play)
Entry zone: 6780–6805, leaning as close to 6800 as price action allows after the spike and stall.
Invalidation / hard stop: 6827, above the 4h supply high and the 1.272 line; if price can close above there, the rejection idea is wrong.
Targets and management:
TP1: 6710–6690 (retest of intraday equilibrium and prior 30m shelf). That gives roughly 2R from a 6785–6800 entry with a 20–25 point stop.
TP2: 6645–6625 (London and NY AM lows cluster). This is where you want the bulk of the remaining size off if sellers stay in control.
TP3: 6550–6525 (strong low zone) only if macro tape turns risk-off; treat this as a runner target, not baseline.
A++ Setup 2 – Long continuation from 6660–6680 (Tier-1 acceptance play)
Entry zone: 6670–6680 after the sweep and reclaim; avoid catching the first knife if momentum is still heavy.
Invalidation / hard stop: 6643, below the combined London low band; a 15m close below 6645 means the demand shelf failed.
Initial risk: roughly 30–37 points depending on fill.
Targets and management:
TP1: 6724–6735 (Asia high / intraday range top). From a 6675 entry with a 30-point stop this is just over 1.5R; to keep the setup A++, bias toward entries closer to 6670 or take partials slightly higher, around 6740, where 2R is reached.
TP2: 6765–6815 (4h supply band). This is where you expect strong counter-flow; plan to remove most of the remaining size here.
TP3: 6855–6930 only if price slices through 6815 on strong volume and macro data support risk-on; in that case trail under 1h higher lows rather than using static targets.
Futurestrading
Crypto Walking the Edge: Will the Band Snap or Stretch Lower?Ether Futures (ETH) continue to tell a story of controlled pressure — one that traders have seen before across many markets, but rarely with this level of composure. The selling has been persistent, yet measured, and despite the depth of the decline, Ether has remained remarkably disciplined within its volatility structure. In short, price is walking the lower Bollinger Band — and doing it with intent.
The Market’s Controlled Descent
When an asset walks the lower Bollinger Band, it signals a market under steady directional momentum. The band represents volatility boundaries built around a moving average; hugging its lower edge reflects consistent downside force without capitulation. In Ether’s case, the message is clear — bears are in charge, but not panicking.
This pattern of orderly decline can be deceptive. It often convinces traders that “it can’t go lower” simply because volatility seems contained. Yet, in technical behavior, containment isn’t comfort — it’s momentum management. Until the market detaches from the band and closes above the midline, downside potential remains valid.
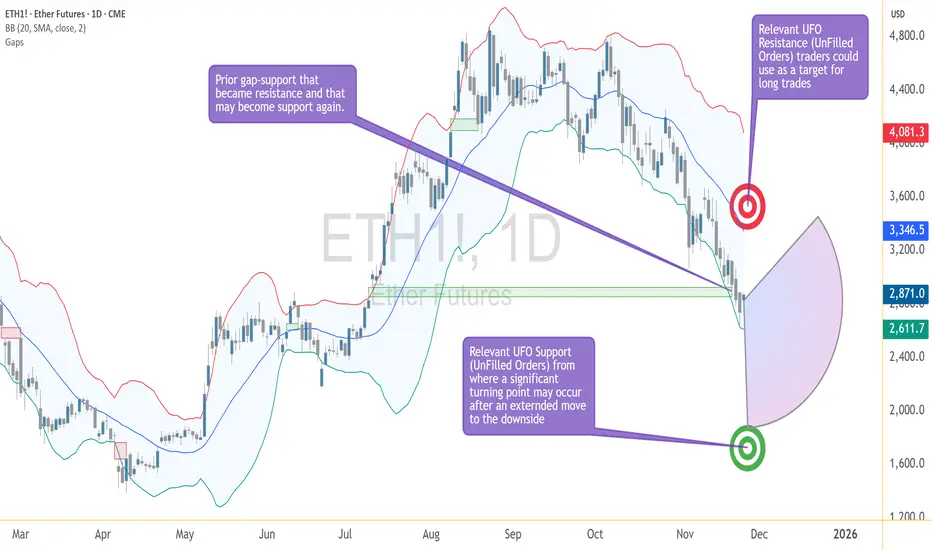
The Downside Magnet — UFO Support at 1883.0
Beneath the current price structure lies a level of particular interest: 1883.0. This is not just another number on the chart; it marks a UFO (UnFilled Orders) zone — an area where unexecuted buy orders from prior trading sessions may still be sitting.
Such levels often act as demand magnets. Price gravitates toward them as liquidity seeks to rebalance. If ETH continues its gradual descent, 1883.0 could act as a “final test” of demand strength. Traders currently short may view this area as a logical place to take profits or reduce exposure, while contrarian participants might monitor it for early signs of stabilization.
Walking the Edge — Bollinger Band Dynamics
The Bollinger Band is more than a volatility envelope; it’s a behavioral tool. Price hugging the lower band isn’t a reversal signal on its own. It shows persistent imbalance — sellers are comfortable pressing until they meet true counterflow demand.
The key observation isn’t where Ether trades, but how it interacts with the band:
If the band widens while Ether stays glued to its edge, volatility expansion favors continuation.
If the band narrows and Ether starts oscillating away from it, compression signals the potential for reversal.
At present, Ether remains on the outer lane — still walking the edge, with no confirmed volatility squeeze yet in play.
The Reversal Trigger — The Gap Between 2853.5–2769.0
Ether’s chart carries memory — and that memory is marked by the closure of a previously open gap between 2853.5 and 2769.0. Gaps represent unbalanced zones where the market skipped transactions, often leaving behind psychological resistance.
As long as ETH remains below 2769.0, bearish pressure dominates. A decisive close through the 2853.5 boundary would, however, suggest sellers have lost control. That event could flip the zone from resistance to support — the technical definition of a reversal confirmation.
Until that happens, Ether continues to operate in a bearish environment within its Bollinger framework, respecting lower boundaries and testing demand without capitulation.
The Upside Magnet — UFO Resistance at 3376.5
If the market does achieve a confirmed reversal through the gap zone, the next structural target stands near 3376.5. This region contains a UFO resistance cluster, where unfilled sell orders may wait to re-engage.
This becomes the “upside magnet” in the event of a bullish shift. Not as a forecast, but as a conditional marker — if price proves it can break through 2853.5, the 3376.5 zone becomes the next logical test for momentum sustainability.
Case Study: Risk Structure and Trade Framing
The beauty of futures markets lies in flexibility. Traders can define clear structural zones, build conditional scenarios, and design reward-to-risk ratios before any entry occurs. Ether’s chart currently offers two educational case studies:
Scenario 1 — Continuation Setup
If ETH continues trading below 2769.0, the bearish structure remains intact. Traders could study how price behaves as it approaches 1883.0 to understand profit-taking dynamics or potential trend exhaustion.
Scenario 2 — Reversal Setup
If ETH breaks and closes above 2853.5, the tone changes. It implies the market has absorbed overhead supply, opening the path toward 3376.5. In this case, risk would typically be defined below the reclaimed gap zone, maintaining a controlled risk ratio.
Whichever scenario unfolds, the discipline lies not in prediction but in preparation — in defining “if this, then that” logic.
Contract Specifications
To understand how traders express these views, it helps to revisit how Ether Futures work on CME.
Ether Futures (ETH)
Contract size: 50 Ether with a minimum tick: 0.25 per Ether = $25 per contract
Trading hours: Nearly 24 hours a day, Sunday to Friday, on CME Globex
Margin requirement: approximately $44,000 per contract (subject to changes)
For traders seeking smaller capital exposure, CME also lists Micro Ether Futures (MET) — 1/500th the size of the standard contract. This smaller format offers precision for testing setups, scaling positions, or managing margin during high volatility periods. Importantly, both ETH and MET track the same underlying price behavior, allowing consistent technical interpretation across sizes.
Managing Risk — Beyond Price Targets
Regardless of contract size, effective futures trading is a balance between conviction and constraint. Every trade requires three coordinates before execution:
Entry — based on objective price structure or confirmation.
Exit — determined by invalidation, not emotion.
Size — calibrated to volatility and margin.
A well-structured plan incorporates all three. For instance, a trader eyeing ETH’s move toward 1883.0 should define exit conditions before entry — not after volatility spikes. The same logic applies if Ether were to reclaim 2853.5 and aim higher; stop placement must be systematic, not spontaneous.
Ether Futures in Market Context
Ether’s futures market has become one of the clearest barometers of institutional sentiment in crypto. It reflects not retail enthusiasm but structured positioning, hedging, and liquidity management. The current price behavior — a slow, calculated descent — signals strategic repositioning rather than panic liquidation.
This distinction matters. Markets driven by liquidation collapse violently and rebound sharply. Markets driven by reallocation, like the current Ether environment, tend to evolve gradually — a series of tests, pauses, and measured reactions. Recognizing this tempo helps traders align their strategies with the rhythm of institutional order flow.
Summary — The Market Still Walking the Edge
Ether’s structure can be summarized in three key technical zones:
1883.0: Demand magnet and potential exhaustion level.
2853.5–2769.0: The gap resistance band — critical reversal gate.
3376.5: Major resistance cluster and next test if reversal unfolds.
As long as Ether remains below the gap zone, momentum remains under bearish control. If it trades through and holds above, a structural shift may begin. Until then, the market keeps “walking the edge” — respecting volatility, testing support, and waiting for conviction.
When charting futures, the data provided could be delayed. Traders working with the ticker symbols discussed in this idea may prefer to use CME Group real-time data plan on TradingView: www.tradingview.com - This consideration is particularly important for shorter-term traders, whereas it may be less critical for those focused on longer-term trading strategies.
General Disclaimer:
The trade ideas presented herein are solely for illustrative purposes forming a part of a case study intended to demonstrate key principles in risk management within the context of the specific market scenarios discussed. These ideas are not to be interpreted as investment recommendations or financial advice. They do not endorse or promote any specific trading strategies, financial products, or services. The information provided is based on data believed to be reliable; however, its accuracy or completeness cannot be guaranteed. Trading in financial markets involves risks, including the potential loss of principal. Each individual should conduct their own research and consult with professional financial advisors before making any investment decisions. The author or publisher of this content bears no responsibility for any actions taken based on the information provided or for any resultant financial or other losses.
ES (SPX, SPY) Week Ahead Analysis - (Nov 24th - 28th)Executive Overview
Equity markets, particularly the E-mini S&P 500 (ES), are currently navigating a broader weekly uptrend, yet have entered a phase of short-term correction after encountering resistance around the 6,900 to 7,000 level. Presently, prices hover near 6,660, finding support from a robust pocket in the mid-6,500s.
Recent volatility indices have surged, with the VIX now in the low 20s and the term structure exhibiting a near flat or slight backwardation. Meanwhile, key credit metrics, funding conditions, and spread behaviors remain stable, suggesting that the current market dynamics are more indicative of equity valuation adjustments and positioning realignments rather than a sign of systemic distress.
Looking ahead to the coming week, we anticipate a choppy trading environment characterized by two-sided price movements within a range of 6,520 to 6,780. Intraday strategies are likely to involve selling into strength around resistance levels R1 and R2, while seeking to capitalize on buying opportunities when prices approach support levels S1. Notably, the VIX is expected to remain elevated above its recent teens regime during this period.
A critical point of focus will be the 6,520 to 6,540 support zone. Should this area fail to hold on a daily closing basis, we could see the correction extend toward the 6,420 to 6,450 range, with further downside potential targeting the low-6,300s.
Multi-Timeframe Analysis of Market Structure
Weekly Trend: Premium/Discount
The current market structure remains characterized by higher highs (HH) and higher lows (HL). The last significant upward movement peaked just shy of 7,000, while the ongoing pullback has managed to hold above the previous weekly higher low band, located in the high-5,000s to low-6,000s range. A notable supply zone exists from approximately 6,850 to just above 7,000, identified as a weak high. Below this, a robust demand/value area spans from around 5,850 (at the 1.272 Fibonacci retracement) down to approximately 5,575 (the 2.0 Fibonacci level) from the previous major leg. On this timeframe, the E-mini S&P (ES) is trading at a premium in relation to the substantial 5,800–5,900 weekly value area. However, we have transitioned from momentum-driven expansion to a mean-reverting correction phase.
Daily Trend and Range
Shifting to a daily perspective, the structure has inverted to a short-term downtrend, marked by a lower high established near 6,900, followed by a lower swing low around the 6,520s. Fibonacci retracement levels from the last sell-off align as follows: 1.272 at approximately 6,521, 1.618 at around 6,418, and 2.0 at approximately 6,304. The 6,520s zone is precisely where price action found support. For the upcoming week, the operative daily range can be defined between 6,520–6,540 as the lower band and 6,760–6,780 as the upper band, coinciding with the previous breakdown area and recent four-hour lower high.
Four-Hour Structure
Analyzing the four-hour chart reveals a clear downward impulse from the mid-6,700s lower high to lows in the mid-6,500s, followed by a sharp rebound. A Fibonacci sequence applied to this movement suggests retracement levels of 1.272 at approximately 6,527, 1.618 at around 6,455, and 2.0 at roughly 6,376. These levels coincide with a notable demand block around the 6,520–6,540 range, identified as a "strong low," with additional liquidity found in the 6,450s and 6,370s. The recent upward movement from these lows appears corrective within the broader impulse, indicating a potential lower high is forming under the 6,680–6,700 area. Until price reclaims and maintains this band, the four-hour swing remains in a down-to-sideways trend.
Hourly Context
From an hourly viewpoint, the ES experienced a decline from approximately 6,770 to the mid-6,500s, subsequently establishing a series of higher lows as it grinds upward. Recent hourly activity shows price pressing against an overhead resistance zone located around 6,660–6,670, just beneath the Asia Session high of 6,662.5 and the New York PM high / previous day high at 6,677.5. The volume-weighted average price (VWAP) is situated near 6,609.75, with prior intraday lows clustering between 6,594 and 6,611.75. Intraday, the ES is currently mid-range, confined between support levels at 6,640–6,642 (Asia Session Low) and resistance at 6,662.5–6,677.5 (Asia Session High / New York PM High / Previous Day High / Yearly Value Area High).
Weekly and Daily Oscillators / Momentum
The weekly oscillator has retracted from overbought conditions but remains elevated, signifying a cool-off within a strong uptrend. Conversely, the daily oscillator is currently oversold and beginning to reverse, showing readings in the mid-20s with the first uptick following a significant downturn. This pattern is classic for potential bounces; however, confirmation of a full trend reversal is yet to materialize.
Key levels and zones
Resistance (R-side)
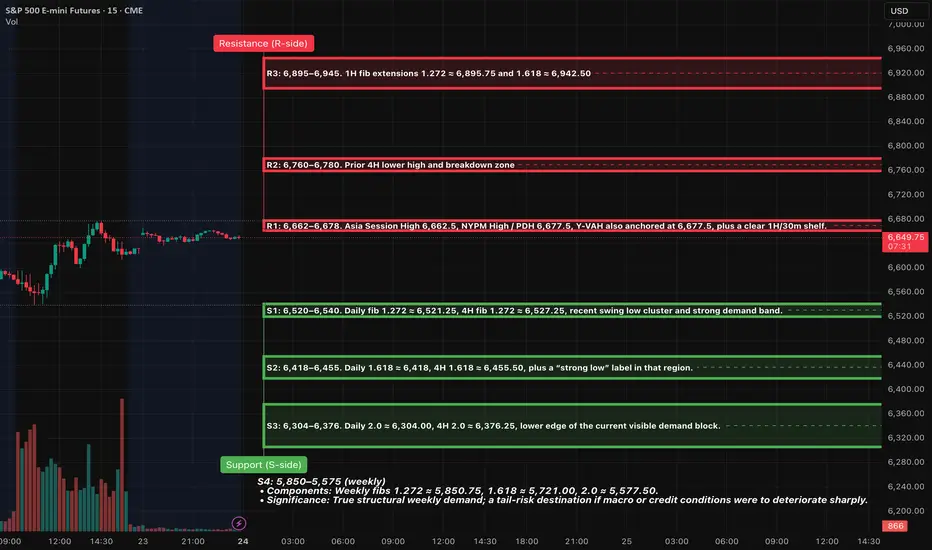
R1: 6,662–6,678
• Components: Asia Session High 6,662.5, NYPM High / PDH 6,677.5, Y-VAH also anchored at 6,677.5, plus a clear 1H/30m shelf.
• Significance: This is the nearest control ceiling; it capped Friday’s rebound and marks the boundary between neutral intraday and more aggressive squeeze potential.
• Role: First place to fade “pop-and-fail” wicks for short A++ plays, and the first area that must be decisively reclaimed for bulls to press a larger squeeze.
R2: 6,760–6,780
• Components: Prior 4H lower high and breakdown zone; 1H HH before the large red impulse bar; sits just below a dense daily supply band.
• Significance: A retest of broken support turned resistance. Acceptance back above here would suggest the entire recent flush was a failed breakdown, opening the path to retest the highs.
R3: 6,895–6,945
• Components: 1H fib extensions 1.272 ≈ 6,895.75 and 1.618 ≈ 6,942.50, plus prior weekly weak high / supply band just under 7,000.
• Significance: This is the larger-timeframe cap. Reaching this zone in one week would likely require either a decisively dovish Fed tone or very strong data.
---
Support (S-side)
S1: 6,520–6,540
• Components: Daily fib 1.272 ≈ 6,521.25, 4H fib 1.272 ≈ 6,527.25, recent swing low cluster and strong demand band.
• Significance: This is the primary weekly pivot for the current correction. First major A++ long location if it’s flushed and reclaimed during liquid hours.
S2: 6,418–6,455
• Components: Daily 1.618 ≈ 6,418, 4H 1.618 ≈ 6,455.50, plus a “strong low” label in that region.
• Significance: This is deeper discount inside the current swing, where larger timeframe players would be expected to defend aggressively if the broader uptrend is to remain intact.
S3: 6,304–6,376
• Components: Daily 2.0 ≈ 6,304.00, 4H 2.0 ≈ 6,376.25, lower edge of the current visible demand block.
• Significance: If price reaches here this week, the market is in a full-fledged risk-off extension, but still within the context of the broader weekly uptrend.
S4: 5,850–5,575 (weekly)
• Components: Weekly fibs 1.272 ≈ 5,850.75, 1.618 ≈ 5,721.00, 2.0 ≈ 5,577.50.
• Significance: True structural weekly demand; a tail-risk destination if macro or credit conditions were to deteriorate sharply.
---
Volatility Backdrop
The VIX spot closed at approximately 23.4 on Friday, having surged beyond 26 earlier in the week, marking the highest levels observed since spring. The VIX futures curve has shifted to a flat or mildly backwardated structure, with near-term contracts hovering around 22.9 for late November and extending into subsequent months. Meanwhile, rates volatility (MOVE) is situated near 78–79, close to its historical average, indicating it is not in crisis territory.
The volatility complex is signaling a notable expectation of an equity shock, although it does not reflect panic in the funding or rates sectors. The flat to slightly backwardated volatility curve suggests potential for larger intraday swings and gap risks, while also presenting significant reward opportunities when market entries align with critical price levels.
Options and Positioning
The total put/call ratio currently stands at approximately 0.87, with the index put/call ratio around 1.03, and exchange-traded products (ETP) at about 1.28. In contrast, the equity-only put/call ratio is at a lower 0.56. The 10-day moving average of the total put/call ratio is approximately 0.90, which is not indicative of panic extremes. The SKEW index is around 148—elevated, yet falling short of the extreme levels (150–160+) that typically signal substantial tail-risk hedging.
Institutional hedging remains present but lacks urgency; there is a distinct preference for put options in indices and ETFs, while single-stock options continue to skew toward calls. Coupled with a VIX in the low-20s and a near-flat curve, this indicates that dealers are likely moderately short gamma at current strike prices. Consequently, price movements beyond key levels may extend further than usual before reversion occurs. This inference, drawn from the volatility and put/call configurations, does not represent a direct measurement.
Market Breadth and Internals
Earlier in the week, the NYSE experienced a significant imbalance, with decliners outnumbering advancers by more than 3:1, alongside a higher count of new lows than new highs, a classic indicator of distribution. However, by Friday, the breadth reversed sharply, with approximately 2,237 advancers against 548 decliners on the NYSE. Nevertheless, the McClellan Oscillator remains negative (~-72), and the Summation Index is in a downward trajectory, suggesting ongoing repair rather than the emergence of a new bull trend. Defensive sectors, including health care and consumer staples, have outperformed, while tech and speculative AI stocks led the recent selloff.
The market has transitioned from a clear uptrend to a choppy corrective phase characterized by distribution. The activity on Friday, while indicative of an oversold breadth thrust, has not confirmed a market bottom.
Credit and Funding
The high-yield ETF (HYG) is trading around 80.3, only slightly below recent highs, indicating no signs of disorderly selling. The US high-yield option-adjusted spread (OAS) is near 3.17%, and B-rated high-yield OAS is about 3.3%, both well below long-term averages (>5%) and only marginally above recent tight levels.
Conclusion:
Credit markets display relative calm, reinforcing the notion that the recent weakness in equities is driven by valuation and sentiment rather than a funding crunch.
Sentiment and Crowd Positioning
Recent AAII survey results indicate roughly 32.6% of respondents identify as bulls, while 23.9% classify as bears. This results in a negative bull-bear spread of about -11%, contrasted with a long-run average of +6%. The combination of an elevated VIX, a negative bull-bear spread, and moderate put/call ratios reflects a climate of pessimism without full-fledged capitulation.
Practical Takeaway:
There exists potential for an upward squeeze if macroeconomic headlines shift towards dovish sentiment. However, a prolonged risk-off environment remains possible if critical support levels like S1 and S2 break.
Cross-Asset and Global Risk Tone
Global equities experienced their most significant weekly pullback since early this year, with the MSCI World Index declining by roughly 3%. Europe’s Stoxx 600 recorded its largest weekly drop since summer, primarily driven by weakness in the tech sector and increased volatility. The cryptocurrency market is in a full risk-off stance, with Bitcoin dipping to a seven-month low before rebounding around $84k, accompanied by sentiment indicators reflecting extreme pessimism and heavy liquidations, now followed by a weekend bounce from oversold RSI levels.
Relative Risk Tone:
The Nasdaq-100 (NQ) remains weaker compared to the S&P 500 (ES), aligning with the decline in tech and AI sectors, while defensive and value-oriented sectors maintain resilience. Overall, the cross-asset narrative suggests a risk-off tone, yet not systemic in nature—exactly the backdrop where well-defined level trading is most effective.
Macro and Data Calendar
The upcoming holiday-shortened week is set to unveil a series of delayed U.S. economic data, including September retail sales, PPI, Core PPI, home prices, pending home sales, inventories, and consumer confidence on Tuesday, followed by jobless claims, durable goods, Chicago PMI, and the Beige Book on Wednesday. The prior government shutdown has postponed key GDP and inflation reports, heightening uncertainty around the Fed's December decisions. Federal Reserve officials exhibit divided opinions about another rate cut in December; some advocate for a pause with inflation near 3%, while others, including at least one governor and the NY Fed president, lean toward support for an additional 25 basis point reduction. Market odds for a December cut have shifted within a ~50–70% range, depending on daily fluctuations.
Classification of the Recent Move:
This market dynamic appears primarily as a reset in valuations and positioning following the exuberance surrounding AI and tech, exacerbated by data-related uncertainty rather than stemming from a definitive “data shock” event.
13. Two A++ setups (for the coming sessions)
These are plan-level plays, to be executed only if price action and vol conditions line up as described.
A++ Setup 1: R1 Rejection Short
Trigger
Inside NY AM or the first hour of NY PM:
1. 15m candle wicks above 6,670–6,675 and closes back under 6,665.
2. 5m prints a lower high beneath that wick, closing back below ~6,660.
3. 1m breaks down through the intraday shelf near 6,655 with increased selling volume / negative delta.
Execution
• Entry: around 6,660–6,665 on the first 1m pullback that fails under the broken shelf.
• Initial stop: above the wick high, e.g. 6,690 (adjust to the actual 15m high but keep risk in the 20–25 point range).
• Risk (example): entry 6,665, stop 6,690 → 25 pts.
Targets
• TP1: 6,615–6,620 (VWAP / prior intraday shelf) → about 2R (50 pts) from a 25-pt stop.
• TP2: 6,540–6,550 (upper edge of S1 / prior congestion) – roughly 4R.
• TP3 (runner): 6,520–6,530 (core of S1 cluster) – 5R+ if reached.
A++ Setup 2: S1 Flush-and-Reclaim Long
Trigger
15m candle flushes below 6,530, ideally tagging 6,520–6,525, with a long tail and closes back above ~6,535–6,540.
5m shows a higher low above the 15m wick low, with real bids stepping in and volume picking up.
1m pushes back through 6,545–6,550 and holds, turning that band into a floor.
Execution
• Entry: 6,545–6,550 on the first 1m pullback that holds above 6,540 after the reclaim.
• Initial stop: below the 15m flush low, e.g. 6,515–6,520.
• Example parameters: entry 6,550, stop 6,520 → 30-pt risk.
Targets
• TP1: 6,595–6,600 (local shelf / prior L at 6,594 and ONH/VWAP neighborhood) → about 2R (60 pts) from a 30-pt stop.
• TP2: 6,662–6,678 (R1 band) – the same ceiling from Setup 1; that’s roughly 4R+ from the entry.
• TP3 (runner): 6,760–6,780 (R2) if data and vol cooperate, giving 7R+ potential.
If that microstructure doesn’t show up, downgrade each play from A++ to stand-aside – let someone else fight in the middle of the range and keep your capital for when the levels truly light up.
Good Luck !!!
JPY collapse loading?The yen is entering a phase of maximum turbulence: deteriorating fundamentals, a deeply asymmetric options market, a sell-side community unanimously targeting 160+ on spot, and Japanese authorities trapped in a rhetoric-heavy but action-light stance. Full breakdown below.
Fundamental Analysis
The fundamental backdrop for the yen remains clearly tilted toward sustained weakness, as the previously dominant FED-cut/BOJ-hike narrative loses traction.
The Bank of Japan continues to adopt an extremely cautious posture, with an even more accommodative tilt reinforced by recent signals from the Takaichi government. At the same time, expectations for another Fed rate cut in 2025 keep diminishing, with markets increasingly pricing a December hold. This shift removes one of the few supportive angles for the yen and re-anchors monetary policy divergence in favour of the US dollar.
Japanese authorities have intensified their verbal intervention to one of the highest levels seen in recent years. However, this escalation has not altered the market’s dominant assumption: no real intervention before USD/JPY reaches 160. Official warnings about “speculative moves” have done little to curb investor appetite, as market participants openly test policymakers’ tolerance levels. The lack of coherence between the Ministry of Finance’s alarmist tone and the absence of concrete action only strengthens this perception.
Portfolio flows also work against the yen. Japanese institutional investors continue to prioritise foreign asset allocation, keeping the basic balance in a structurally negative position. This persistent capital outflow acts as a continuous fundamental headwind.
Overall, the macro pressure remains aligned against the yen, anchored by a remarkably unfavourable policy differential. The Bank of Japan shows very few signs of preparing meaningful tightening. Conversely, the Fed is increasingly perceived as maintaining restrictive policy longer than anticipated. The probability of a rate cut in December 2025 keeps fading, reinforcing the baseline scenario of the federal funds corridor staying within 375–400 bps. This environment structurally sustains the dollar’s yield advantage, making any durable yen rebound difficult to justify without a major policy shift from Tokyo.
Technical Analysis
On the technical front, the yen is breaking support levels one after another without hesitation, heading back toward the annual lows recorded in January.
If momentum accelerates further, the next major support sits around 0.00625, a level already tested unsuccessfully in July 2024. A clean break below this threshold would likely open the path toward even lower levels, given the lack of meaningful historical congestion zones below it.
Sentiment Analysis
Among FX/CFD brokers, retail traders, who typically sell into rallies, are unsurprisingly heavily short USD/JPY, and thus long yen, with approximately 70% of positions betting on a reversal.
With the CFTC COT report still unavailable due to the US government shutdown, sell-side positioning provides valuable insight. Major FX banks remain strongly aligned on a bearish JPY narrative, with consensus calling for further gains in USD/JPY toward 158.90, 160, and even 161.96.
JP Morgan states that it is “hard to be anything other than short JPY,” recommending bearish positioning through options to better capture potential acceleration. Bank of America also maintains a structurally negative view on the yen, citing an overly cautious BOJ, a government inclined toward looser policy, and persistent capital outflows. Crédit Agricole notes that intervention rhetoric is at extremely elevated levels but stresses that markets remain largely unbothered by the possibility of real action below 160.
The broad takeaway: positioning, narratives, and institutional sentiment overwhelmingly favour further yen weakness.
CME Options Analysis
The open-interest heatmap highlights a markedly unbalanced structure confirming the market’s bearish bias on the yen.
The largest concentrations lie in put options at strikes below current levels, particularly at 0.00625 and 0.0062. These clusters, amounting to several thousand contracts, signal investors are either hedging against or actively positioning for another leg of USD strength versus JPY. Meanwhile, the absence of significant call volumes above market prices confirms the lack of any meaningful option barrier that would support a yen rebound.
This configuration underscores clear asymmetry: markets view continued yen depreciation as the more probable path and appear increasingly wary of a sharp downward break.
Trade Idea
Friday’s mild pullback (21/11) offers an entry opportunity for short exposure on the 6JZ5 contract, with 0.00625 and potentially 0.0062 as targets. A daily close above 0.006575 would invalidate the scenario.
Final Thoughts
The market continues to test the patience of the Japanese Ministry of Finance, yet without credible action from either the BOJ or the government, little resistance seems capable of blocking the dollar’s advance against the yen. Positioning, options structures, and flow dynamics all heavily support continuation, where each consolidation appears more like a pause within a structural trend than the start of a reversal.
The key risk now is the prospect of a delayed but forceful reaction from Tokyo should the situation become disorderly.
---
When charting futures, the data provided could be delayed. Traders working with the ticker symbols discussed in this idea may prefer to use CME Group real-time data plan on TradingView: tradingview.com/cme/ .
This consideration is particularly important for shorter-term traders, whereas it may be less critical for those focused on longer-term trading strategies.
General Disclaimer:
The trade ideas presented herein are solely for illustrative purposes forming a part of a case study intended to demonstrate key principles in risk management within the context of the specific market scenarios discussed. These ideas are not to be interpreted as investment recommendations or financial advice. They do not endorse or promote any specific trading strategies, financial products, or services. The information provided is based on data believed to be reliable; however, its accuracy or completeness cannot be guaranteed. Trading in financial markets involves risks, including the potential loss of principal. Each individual should conduct their own research and consult with professional financial advisors before making any investment decisions. The author or publisher of this content bears no responsibility for any actions taken based on the information provided or for any resultant financial or other losses.


S&P 500 E-mini Futures: Short Target Achieved, Long Setup 21.Nov
S&P 500 E-mini Futures: Short Target Achieved, Long Setup in Play
Today’s session on the S&P 500 E-mini Futures (ES) presented a textbook example of how patience and planning pay off in intraday trading. Let’s break down the trade idea, execution, and the next steps.
Market Context
Instrument: S&P 500 E-mini Futures (ESZ2025)
Current Price: 6,547.25 (-0.16%)
Timeframe: 15-minute chart
Session Behavior: After an initial push higher, the market showed signs of exhaustion near the previous high, creating an opportunity for a short scalp before considering a long re-entry.
Trade Recap: Short Position
Earlier today, a short position was initiated near the supply zone (highlighted in red on the chart) around 6,594.50, targeting a retracement toward the mid-range.
Entry: Around 6,594.50
Target: 6,532.25 (achieved successfully)
Reasoning: Price rejected the upper liquidity zone, forming lower highs and signaling a short-term bearish move. Volume spikes confirmed selling pressure.
This short trade hit its target cleanly, validating the setup and risk management.
Current Setup: Long Bias
With the short target achieved, the focus now shifts to a long re-entry. Here’s why:
Demand Zone: Price reacted strongly near 6,532.25, sweeping liquidity and bouncing back.
Volume Profile: Notice the spike in buying volume at the lows, suggesting accumulation.
Structure: The market is forming a higher low on the 15-minute chart, indicating potential bullish continuation.
Long Plan
Entry Zone: Between 6,532.25 and 6,528.25 (green zone)
Stop Loss: Below 6,523.25 (to protect against deeper liquidity sweep)
Target: Sweep of the day’s high near 6,604.75 or equal highs at 6,594.50 for partials.
Key Observations
Liquidity Sweep: The wick below 6,532.25 suggests stop hunts before reversal.
Risk-to-Reward: Favorable setup with tight stop and clear upside targets.
Market Sentiment: Despite intraday volatility, the broader trend remains bullish, supporting the long bias.
Conclusion
The short scalp was a success, and now the market offers a compelling long opportunity. Traders should monitor price action closely around the demand zone and manage risk diligently. If the bullish momentum holds, a sweep of the day’s high is likely.
✅ Pro Tip: Always wait for confirmation before entering a reversal trade. Volume and price structure are your best friends in identifying genuine shifts in momentum.
Do your own analysis before taking any decisions these are only my way of looking at the market today and valid for today only

ES (SPX, SPY) Analysis, Key-Zones, Setups for Thu (Nov 20th)Market Bias Analysis
The current short-term bias is constructively bullish, yet it remains contingent on upcoming events. Recent momentum has been bolstered by Nvidia's exceptional earnings report and a significant intraday reversal in the E-mini S&P 500 (ES). As long as the 6,670–6,680 range holds during any pullbacks, the path of least resistance appears to be upward. It is important to note that the broader daily trend is still bullish, unless we see a decisive breach below the key demand zone of 6,520–6,510 in the ES.
Market Overview
In a notable shift following a four-day decline, today's trading session exhibited a renewed bullish sentiment. The E-Mini S&P 500 (ES) printed a robust green daily candle, bouncing off a low of approximately 6,622.00 yesterday to close near 6,740.
From a technical perspective, the daily chart reveals that the recent selloff has established a lower high without breaking the prior significant higher low. The reaction low remains comfortably above the daily 1.272 extension cluster situated around 6,521.25. On the 4-hour chart, the price action has transitioned from a pattern of lower lows to a new higher low, currently pushing into the Price Quotient Median (PQM) and Price Quotient High (PQH) band, just below previous 4-hour supply levels. Observing the 1-hour chart, today's trading reflected a definitive trend day upward, characterized by a consistent series of higher lows and higher highs, culminating the session near the 1-hour 1.272 Fibonacci extension at 6,743.75.
Macroeconomic factors played a crucial role in this market turnaround, particularly after Nvidia reported stunning Q3 earnings that exceeded expectations, generating approximately $57 billion in revenue. The company’s strong AI-driven outlook and positive after-hours performance alleviated concerns that the recent downturn in technology stocks signified the onset of a broader unwinding of the AI bubble. This development contributed to a rally in index futures as the session drew to a close.
Nonetheless, the overarching theme remains one of valuation pressures and interest rate concerns. Despite breaking a four-session losing streak, market participants are poised for tomorrow’s data, which will be pivotal in shaping the Federal Reserve's policy trajectory moving forward.
Scheduled Events (Tomorrow – Thursday, Nov. 20, 2025)
Tomorrow’s docket is heavy and directly relevant for ES:
• 8:30 a.m. ET – September Employment Situation (delayed jobs report)
The September nonfarm payrolls and unemployment rate, postponed by the government shutdown, are finally released. This is the only full jobs report the Fed will have before its December meeting, and markets are treating it as a major verdict on the labour market.
• Other U.S. data (during the morning/early afternoon)
Various calendars flag building permits / housing data, regional manufacturing (e.g., Philadelphia Fed), and existing home sales clustered through the U.S. session – all secondary to the jobs report but able to add fuel if they confirm or contradict the labour story.
• Fed speakers / meetings
• Chicago Fed President Austan Goolsbee has a scheduled fireside chat around midday (12:40 p.m. ET).
• The Fed also has a closed Board meeting at 1:15 p.m. ET and a two-day Cleveland Fed financial-stability conference that can generate headlines.
Net: the jobs report is the main event; Fed comments will colour the move rather than drive it on their own.
Setups (A++ Concepts)
These are two high-conviction, rule-style ideas you can plug into your own framework. Price levels are exact from your charts.
A++ Setup 1 – Continuation Long from Value Pocket
Entry trigger concept:
Look for a sweep into the chosen band (e.g., wick into 6,690–6,695 or down into 6,663–6,668) followed by a strong 15m/5m bullish close back above 6,700. That shows buyers defending value and rejecting a deeper rotation into S3.
Risk / invalidation:
Structural invalidation if ES closes the hour below 6,652.50 (Y-POC) and cannot reclaim 6,668. In practice, a tight stop can sit just under 6,652.00 if entering from 6,690–6,705, or under 6,645.00 if using the deeper S2 pocket.
Targets:
• TP1: 6,743.75 (1H 1.272)
• TP2: 6,777.00 (1H 1.618)
• TP3: 6,813.50 (1H 2.0)
---
A++ Setup 2 – Short Fade from 1H Extension Cluster
Entry zone:
Primary sell pocket: 6,777.00–6,813.50
(1H 1.618 to 2.0 extension cluster.)
Risk / invalidation:
Structural invalidation above 6,825–6,830 (clear 1H/4H acceptance beyond the 2.0 extension).
A practical stop can sit around 6,828.00 if entering inside the band.
Targets:
• TP1: 6,743.75 (1H 1.272 / prior extension)
• TP2: 6,683.50–6,690.00 (NYPM high / S1 top)
• TP3: 6,659.00–6,664.75 (VWAP/value pocket S2)
Narrative:
If Nvidia’s beat triggers a euphoric push straight into the upper fib level but the tape immediately rejects that strength, the market is saying “good news already in the price.” This setup expresses the view that the real gravity is lower, back toward value and potentially into S3 if macro data disappoint.

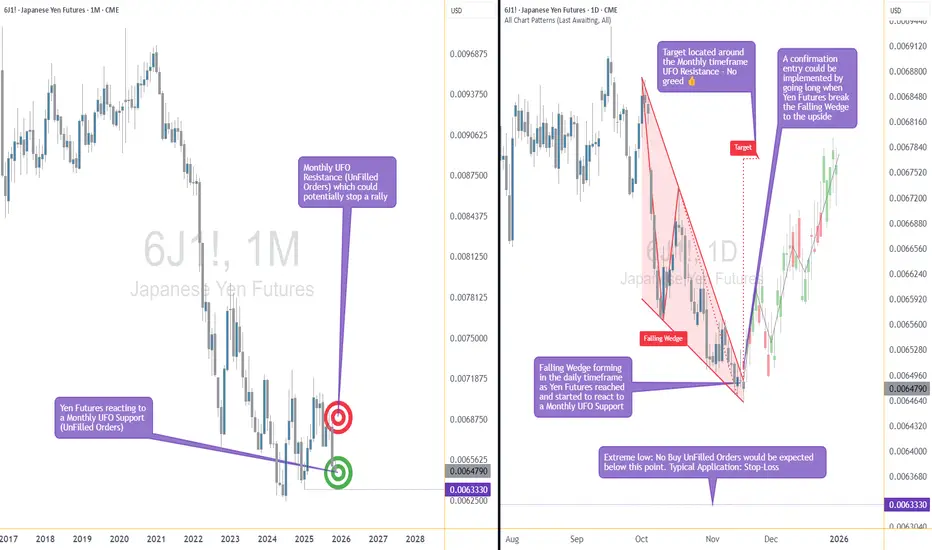
The Support Zone That Refused To Be IgnoredSome chart zones whisper. This one practically waved its arms.
Price slid right into a hefty support area on the higher timeframe… and suddenly started behaving like it had forgotten how to move lower. Classic clue.
Zoom in, and the daily chart shows price squeezing itself into a falling wedge — the market’s equivalent of someone pacing in a hallway, unsure whether to sit down or sprint. Sellers kept trying to push prices lower, but each attempt had less conviction than the last.
When you stack those two pieces together — a big support zone from the monthly chart and a daily pattern running out of room — things start to get interesting. Not predictive, just… interesting.
A breakout above the wedge (around 0.0065030) would basically say, “Alright, I’m done compressing.”
A stop tucked below the lower support range (roughly 0.0063330) keeps the scenario clean.
And a structural projection toward 0.0067695 gives the idea a tidy endpoint if momentum decides to stretch its legs.
Of course, leverage cuts both ways, and traders working with the standard or micro contracts often choose size based on how much room they want between entry and invalidation. When traders choose between the standard and micro versions of this market, it usually comes down to scale. The bigger contract represents 12,500,000 units of the underlying with a $6.25 tick, while the micro mirrors the behavior at 1,250,000 units with a $1.25 tick. Estimated margins also differ — roughly $2,800 for the larger contract and about $280 for the micro. Same chart logic, just two very different footprints on the account.
The real takeaway? When a major zone teams up with a compression pattern, it’s usually worth paying attention. Maybe it leads to a beautiful breakout. Maybe it fizzles. But structurally, this is one of those “save the screenshot” moments.
And whatever the outcome, risk management keeps the whole thing sensible — size smartly, define failure points, and let the chart prove itself instead of assuming it will.
Want More Depth?
If you’d like to go deeper into the building blocks of trading, check out our From Mystery to Mastery trilogy, three cornerstone articles that complement this one:
🔗 From Mystery to Mastery: Trading Essentials
🔗 From Mystery to Mastery: Futures Explained
🔗 From Mystery to Mastery: Options Explained
When charting futures, the data provided could be delayed. Traders working with the ticker symbols discussed in this idea may prefer to use CME Group real-time data plan on TradingView: www.tradingview.com - This consideration is particularly important for shorter-term traders, whereas it may be less critical for those focused on longer-term trading strategies.
General Disclaimer:
The trade ideas presented herein are solely for illustrative purposes forming a part of a case study intended to demonstrate key principles in risk management within the context of the specific market scenarios discussed. These ideas are not to be interpreted as investment recommendations or financial advice. They do not endorse or promote any specific trading strategies, financial products, or services. The information provided is based on data believed to be reliable; however, its accuracy or completeness cannot be guaranteed. Trading in financial markets involves risks, including the potential loss of principal. Each individual should conduct their own research and consult with professional financial advisors before making any investment decisions. The author or publisher of this content bears no responsibility for any actions taken based on the information provided or for any resultant financial or other losses.

ES (SPX, SPY) Analyses, Key Zones, Setups for Wed (Nov 19th)Market Analysis: A Shift in Momentum for ES
In today's market, the daily chart for the E-mini S&P 500 (ES) reveals a notable shift in momentum, characterized by a sequence of price action that signals a potential downtrend. Previously, we observed a high, followed by a lower high, and today's movement has decisively broken through the last remaining support at the higher-low shelf. This change comes after a rejection from the recent lower-high zone, situated just below the 6,900 mark, followed by a retreat through the crucial 6,700 threshold. What initially appeared to be a bullish uptick is now consolidating into a corrective downswing.
Today's significant drop marks the continuation of this emerging downward trajectory. Prices breached intraday support around 6,675 to 6,700, slid past the prior higher-low region near 6,635, and ultimately settled atop the initial daily demand zone. Notably, the selling volume during this decline expanded compared to previous sessions, underscoring that this movement reflects genuine market participation rather than mere fluctuations.
While the longer-term outlook remains bullish, reflected in the weekly trend, the daily and four-hour charts currently indicate a pronounced short-term downtrend. Key indicators include the formation of a lower high, the breach of the previous higher-low, and a liquidity run to the downside toward the extension cluster. As we move forward, this developing bearish scenario suggests potential for further declines in the coming sessions, though we are positioned within local demand territory, indicating that bounces and two-directional trading are likely in the near term.
Key Resistance Zones
Resistance 1: 6,637
This level represents today’s late-session swing high on the 30-minute chart, denoted as the S-session high (S.H 6,637). It serves as the initial resistance point above the current market price.
Resistance 2: 6,679.75 – 6,687.50
A cluster of highs, with NYAM.H marked at 6,679.75, LO.H at 6,685.75, and NYPM.H at 6,687.50, forms a critical intraday supply pocket. This region represents the primary A++ short zone should the price experience a bounce.
Resistance 3: 6,700 – 6,720
Above the NY session high band, the 4-hour chart highlights a previously broken support shelf and local supply just below 6,720. Any movement back into this area would likely be corrective within the ongoing downswing unless the E-mini S&P can close and hold a daily candle above this range.
Higher-Timeframe Cap:
Any price action remaining below the recent daily lower-high zone—situated near the last significant LH before the drop—maintains a bearish bias for the larger swing. A definitive daily close above this lower-high would be necessary to negate the current short-term downtrend.
---
Key Support Zones
Support 1: 6,627.50 and 6,614.75
The AS.L level is printed at 6,627.50, with the NL.L around 6,614.75 on the 30-minute chart. Together, these levels form the initial local support shelf just beneath the current price.
Support 2: 6,606.50 – 6,603.25
Marked by NYPM.L at 6,606.50 and NYAM.L at 6,603.25, this band serves as the next area of resting liquidity from today’s trading sessions. A clean break and sustained move below this range could pave the way for the Fibonacci targets below.
Support 3 (Major Fibonacci Cluster): 6,541.50 – 6,509.00
On the 1-hour chart, the 1.272 Fibonacci level is found at 6,541.50, while the 4-hour chart places it at 6,509.00. The daily chart marks the 1.272 at 6,521.25, creating a significant demand box from approximately 6,541 down to 6,509, with 6,521 serving as a mid-pivot. This is the pivotal "bounce or break" zone.
Support 4 (Deeper Extension Pocket): 6,501.75 – 6,458.00
The 1-hour chart identifies the 1.618 Fibonacci extension at 6,501.75 and the 2.0 extension at 6,458.00. The 4-hour chart aligns the 1.618 at 6,429.25 and the 2.0 at 6,341.50, with the daily chart placing the 1.618 at 6,418.00 and the 2.0 around 6,304.00. The initial focus for tomorrow is the 6,502–6,458 region. Should the 6,541–6,509 band fail, this area becomes a strong magnet where a more pronounced short-covering bounce is likely.
The definitive structural line on the downside is the cumulative daily 1.618–2.0 cluster, ranging from approximately 6,418 down to 6,304. A decline to this range could signify a major correction leg rather than a mere shallow pullback.
A++ SETUP 1 — REJECTION SHORT FROM NY HIGH BAND
Trigger:
15m: candle wicks into 6,680–6,688 and closes back below about 6,675.
5m/1m: a failed attempt to push higher (lower high) after that rejection.
Entry:
Aggressive: enter short 6,678–6,682 after the 15m rejection close and 1m fails to make new highs.
Conservative: limit sell in 6,680–6,685 on a controlled retest from below.
Stop (hard invalidation):
Around 6,698.00 above the band and intraday highs (about 16–20 points of risk if filled 6,678–6,682).
Targets:
TP1: 6,637.00 (session swing high). From 6,680 entry with 6,698 stop ≈ 2.3R.
TP2: 6,606.50 – 6,603.25 (NYPM.L / NYAM.L shelf), ≈ 4R from 6,680 entry.
TP3: 6,541.50 – 6,521.25 (top of fib demand cluster), campaign-style extension.
A++ SETUP 2 — EXHAUSTION LONG FROM FIB CLUSTER DEMAND
Trigger:
15m: price trades below 6,530, tags 6,521–6,509, then closes back above about 6,530 (wick through, body back up).
5m/1m: a higher low forms above roughly 6,520 after that reclaim; sellers fail to push back below the cluster.
Entry:
Aggressive: 6,525–6,535 on the first higher low on 1m/5m after the 15m reclaim of 6,530.
Conservative: limit buy near 6,525 on a controlled retest into the top of the cluster after the first reaction.
Stop (hard invalidation):
Around 6,497.00 under the bottom of the cluster and recent swing low (≈ 30–38 points of risk if entered 6,525–6,535).
Targets:
TP1: 6,595–6,600 (broken structure and local VWAP zone). From 6,530 entry with 6,497 stop ≈ 2R.
TP2: 6,637.00 (S-session high and first major resistance).
TP3: 6,679.75 – 6,687.50 (NYAM.H / LO.H / NYPM.H band), where a bounce can turn into a full squeeze.
Upcoming Economic Indicators
For tomorrow's trading session (Wednesday, U.S. time), traders should keep an eye on several key economic releases:
- At 8:30 AM ET, the U.S. will release Housing Starts and Building Permits for October, along with import/export price indices. These figures are vital for gauging growth, especially after a series of subdued permits and erratic starts.
- At 10:30 AM ET, the EIA Weekly Petroleum Status Report, alongside crude inventory data, is expected to influence energy markets and broader risk sentiment.
- Later in the afternoon, markets will be attentive to FOMC minutes and remarks from New York Fed President John Williams, both of which could impact rate-cut expectations based on the overall tone relative to recent communications.
Good luck !!!

Massive Put Wall at 1.30Sterling is entering a critical zone where fiscal tensions, macroeconomic fragility, and unfavorable technical signals overlap. The 6BZ5 contract is moving along the edge of a structural threshold that could shape the trajectory of the coming weeks. As the UK budget approaches and monetary divergence between the Bank of England and the Fed widens, listed options, retail sentiment, and market microstructure collectively reinforce the scenario of a market vulnerable to a downside acceleration if support breaks.
Fundamental analysis
The fundamental backdrop remains unfavorable for the pound, driven by a convergence of domestic and external pressures. In the UK, fiscal credibility has once again become a central issue: contradictory announcements on taxation, rumors of future tax increases followed by reports of a reversal, have revived doubts about the coherence of the government’s economic strategy. This uncertainty has triggered a sharp rise in gilt yields, signaling an increased risk premium on UK assets. Markets are also focused on the 26 November budget, perceived as a major catalyst. A presentation judged insufficiently rigorous could reignite concerns around a “UK risk premium” and amplify sterling weakness.
The Bank of England adds another layer of fragility: the combination of a slowing labor market, improving inflation dynamics, and deteriorating activity indicators strengthens expectations of monetary easing. Markets now assign more than a 75% probability to a rate cut in December, which mechanically weighs on the currency.
By contrast, the Fed maintains a relatively more restrictive stance, supported by the resilience of the US macroeconomic environment and the gradual return of economic publications after the shutdown. This policy divergence continues to favor the dollar and limits rebound attempts in GBP.
Technical Analysis
The technical setup shows a clearly bearish and vulnerable structure below 1.32, with price firmly trading under the 20-day moving average, which now acts as dynamic resistance and could guide price action toward a major level at 1.30.
Below that zone, the Volume Profile reveals a deep liquidity vacuum between 1.285 and 1.27, an area likely to attract prices rapidly in the event of a breakout.
Sentiment Analysis
Aggregated FX/CFD broker data shows that roughly 60–65% of retail traders are currently long, an elevated level indicating a broad attempt to “buy the dip.” Historically, such a long-heavy bias tends to be interpreted contrarian: when retail traders buy aggressively into a falling market, the probability of further downside increases.
The context complicates broader positioning analysis because the US government shutdown has interrupted COT publications, depriving markets of their usual source on institutional speculative positioning.
Nevertheless, most major FX bank analyses consider that rebounds remain fragile and that the broader bias still leans toward additional downside pressure, particularly in the run-up to the 26 November budget.
Options analysis
Activity in listed options highlights a massive cluster of puts around 1.30, now the mechanical pivot of the market. This level concentrates most of the dealers’ negative gamma: as the spot approaches it, dealers must sell GBP/USD to hedge their exposure, which naturally pulls spot toward 1.30. This zone therefore acts not as a technical magnet, but a microstructural one.
A clean break would amplify this dynamic: delta would fall sharply, forcing market makers to increase hedging, generating a self-reinforcing wave of selling pressure. In effect, 1.30 is more than a support level; it is the key threshold to monitor and a potential point of structural rupture.
Trade idea
While more aggressive traders may consider short positions already, a more disciplined approach favors waiting for a confirmed break below 1.30 before initiating a short targeting 1.2715, with the aim of quickly filling the volume gap, supported by abundant stop-loss clusters and put positions in that area. This scenario would be invalidated by a daily close above 1.32.
Final thoughts
The 6BZ5 contract sits at the intersection of macro, technical, and microstructural forces that all converge toward an elevated risk of breakdown. Dollar strength, the UK’s uncertain fiscal credibility, a Bank of England now oriented toward easing, and a retail market saturated with long positions together create a fragile environment. The 1.30 level concentrates stops, dealer gamma, and a clear liquidity vacuum, making it the central pivot point of the moment. A decisive break would open an almost unobstructed path toward 1.2715. Conversely, only a solid daily close above 1.32 would neutralize the bearish bias.
---
When charting futures, the data provided could be delayed. Traders working with the ticker symbols discussed in this idea may prefer to use CME Group real-time data plan on TradingView: tradingview.com/cme/ .
This consideration is particularly important for shorter-term traders, whereas it may be less critical for those focused on longer-term trading strategies.
General Disclaimer:
The trade ideas presented herein are solely for illustrative purposes forming a part of a case study intended to demonstrate key principles in risk management within the context of the specific market scenarios discussed. These ideas are not to be interpreted as investment recommendations or financial advice. They do not endorse or promote any specific trading strategies, financial products, or services. The information provided is based on data believed to be reliable; however, its accuracy or completeness cannot be guaranteed. Trading in financial markets involves risks, including the potential loss of principal. Each individual should conduct their own research and consult with professional financial advisors before making any investment decisions. The author or publisher of this content bears no responsibility for any actions taken based on the information provided or for any resultant financial or other losses.

ES (SPX, SPY) Analysis, Key Zones, Setups for Tue (Nov 18th)ES experienced a notable decline, concluding the day with a sharp downturn but managed a late-session rebound off a significant demand zone. At this juncture, it appears to be a robust corrective phase within an overarching uptrend, with a reasonable probability of a bounce or a range-bound trading day ahead, barring any unexpected developments from data releases or commentary from Federal Reserve speakers.
Looking ahead to tomorrow, November 18, 2025, the economic calendar is unusually packed for a Tuesday, as various U.S. data are set to be released following delays caused by a government shutdown. Key indicators to watch that could influence ES during the New York session include the import and export price indexes for October at 8:30 AM ET, industrial production and capacity utilization figures also for October at 9:15 AM ET, and the NAHB housing market index for November at 10:00 AM ET.
Additionally, several Federal Reserve officials, including Barr, Waller, Williams, and Kashkari, are scheduled to speak throughout the day. The market is particularly attuned to their insights regarding the likelihood of another rate cut, especially in light of the recently released October FOMC minutes and this week’s jobs report.
Given the abundance of potential market-moving information, I would consider the period from 9:15 to 10:15 AM ET as a critical window for "headline risk" tomorrow.
The recent market decline can largely be attributed to macroeconomic factors:
The S&P 500 cash index ended the day down approximately 0.9%, with the Dow falling around 1.2% and the Nasdaq declining by about 0.8%. This pullback has moved the indices further away from their all-time highs established last month.
The selling pressure was particularly acute among mega-cap technology stocks and the AI sector. Major players such as Nvidia, Apple, Palantir, and AMD faced heavy trading as investors began to question whether the recent surge in tech stocks, driven by AI enthusiasm, had outpaced underlying fundamentals ahead of Nvidia’s earnings release on Wednesday.
Market sentiment was further dampened by a noteworthy prediction from Stifel's chief strategist, who suggested a potential 5% drop in the S&P 500, targeting a level around 6,350 in the coming months. This outlook was based on concerns regarding high valuations and uncertainties surrounding the Fed’s future policy as delayed economic data begins to materialize.
Interestingly, the yield on 10-year Treasuries dipped slightly towards ~4.13% , indicating that today’s selloff was more of a de-risking/profit-taking maneuver specific to equities rather than a reflection of widespread risk aversion typically signaled by bond market movements.
From a technical perspective on the ES futures:
Intraday trading patterns reflected a continuation of last week’s trend of lower highs and lower lows. Prices faltered near the 6,800–6,805 mark during the overnight session before entering a clear downtrend through the morning. The volume accelerated during the late-morning selloff, ultimately reaching a low around the 6,658–6,660 band, which coincides with established daily demand zones.
Following this drop, we observed a pronounced shift in behavior: significant buying volume surged at the lows, leading to a rejected price at that demand zone and a controlled short-covering rally back above 6,690, approaching the 6,700–6,705 range as the day closed. The Nasdaq exhibited a similar trajectory, with a heavy selloff subsequently followed by a recovery.
Structurally, today’s activity reflects:
A strong continuation of downside movement, stemming from last week’s lower-high structure and macro-driven de-risking, culminating in a liquidity flush into a previously identified demand pocket followed by short-covering toward the close.
From a broader perspective, is this the beginning of a genuine downtrend?
On the daily chart, ES remains within a larger uptrend originating from the summer lows. A higher peak above 6,900 was established in late October, with the current pullback representing a decline of approximately 3–4% from that peak. Today's trading reached the 6,650–6,670 support region, which previously served as a vital higher low space, before closing back above it. Daily momentum indicators have rolled over but are beginning to flatten, indicating they are not yet deeply oversold.
In contrast, the shorter-term 4-hour and 1-hour views present a more bearish outlook: a sequence of lower highs has formed, and the retest of prior higher low levels appears to be underway. Short-term moving averages have shifted downward, and 4-hour momentum remains negative, albeit with initial signs of a slight positive divergence compared to new price lows.
In summary:
I interpret this phase as a significant corrective downswing within a larger uptrend rather than the onset of a new bear market. The potential for a more substantial correction exists, particularly if Nvidia’s earnings disappoint or if the run of delayed economic data proves weak. However, the day's trading indicates more of a necessary adjustment rather than the onset of a catastrophic decline, aligning with institutional views that this pullback signifies a "healthy reset" following a robust advance, rather than an indication of a market bubble bursting.
Should ES close below the 6,650 mark on a daily basis and subsequently begin to print lower highs under that level, I would increase my assessment of the risk of a transition into a more enduring downtrend, with targets around the 6,350–6,400 range over the coming weeks, echoing Stifel's projections. For the time being, however, buyers continue to defend this crucial daily support zone.
Key zones to monitor for tomorrow, in the futures market:
I identify the following support zones:
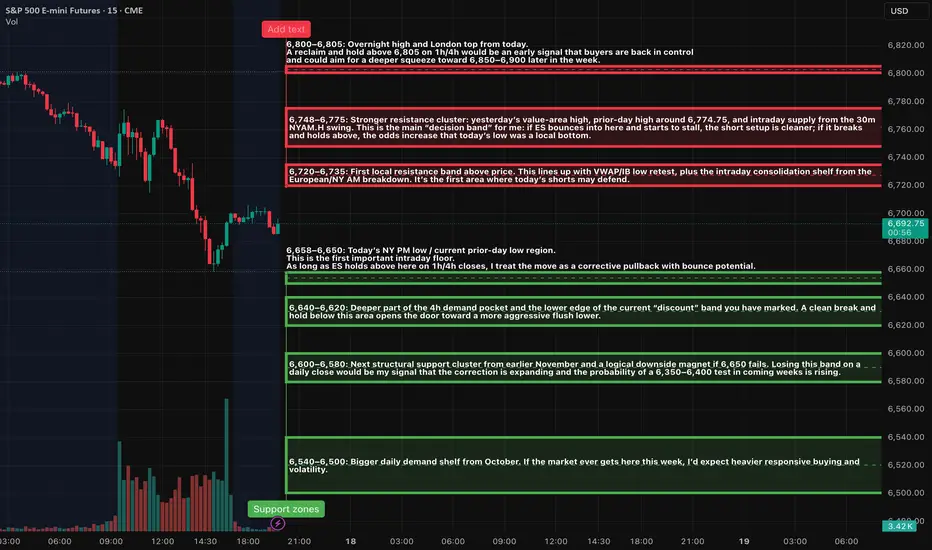
6,658–6,650: This region marks today’s New York PM low and aligns with the prior day’s low. It serves as the first critical intraday support level. As long as ES maintains closes above this area on 1-hour and 4-hour charts, I consider the movement to be a corrective phase rather than a broader downtrend.
A High-Impact Support Zone Meets a Breakout StructureIntroduction
Markets occasionally compress into areas where structure, momentum, and historical buying pressure align with surprising precision. When that compression occurs at a major higher-timeframe floor, traders often pay closer attention—not because the future is predictable, but because the chart reveals a location where price behavior typically becomes informative.
The current case study centers on a market pressing into a high-impact support zone visible on the monthly chart, while the daily chart displays a falling wedge pattern that has gradually narrowed the range of movement. This combination often highlights moments where the auction process is nearing a decision point. The purpose here is to dissect that confluence using multi-timeframe structure, pattern logic, and broad order-flow principles—strictly for educational exploration.
Higher-Timeframe Structure (Monthly)
The monthly chart shows price approaching a well-defined support area between 0.0065425 and 0.0063330, a region that has acted in the past as a base for significant reactions. These areas often develop because markets rarely absorb all buy interest in a single pass; pockets of unfilled orders may remain, leading to renewed reactions when price returns.
This type of zone does not guarantee a reversal. However, historically, when price reaches such levels, traders tend to monitor whether selling pressure slows or becomes less efficient. In this case, the structure suggests a recurring willingness from buyers to engage at these prices, forming a foundation that has held multiple swings.
The presence of a clear, higher-frame resistance at 0.0067530 anchors the broader range. When price rotates between such boundaries, the monthly context often acts as a roadmap: major support below, major resistance above, and room in between for tactical case-study exploration.
Lower-Timeframe Structure (Daily)
Shifting to the daily chart, price action has carved a falling wedge, a pattern often associated with decelerating downside movement. In wedges, sellers continue to push price lower, but with diminishing strength, as each successive low becomes less effective.
This type of compression structure can provide early evidence that the auction is maturing. Traders studying such patterns often watch for:
tightening of the range,
shorter waves into new lows,
initial signs that buyers are defending intraday attempts to drive price lower.
The daily wedge in this case sits directly on top of the monthly support zone—an alignment that strengthens its analytical relevance. The upper boundary of the wedge sits near 0.0065030, and a break above that line is often interpreted as price escaping the compression phase.
Multi-Timeframe Confluence
Multi-timeframe confluence arises when higher-frame structure provides the background bias and lower-frame patterns offer the tactical trigger. In this case:
The monthly chart signals a historically responsive support zone.
The daily chart shows structural compression and slowing downside momentum.
The interaction between them creates a scenario where educational case studies tend to focus on breakout behavior, as the daily timeframe may provide the first evidence that higher-frame buyers are engaging.
This confluence does not imply certainty. It simply highlights a location where structure tends to become more informative, and where traders often study the transition from absorption to response.
Order-Flow Logic (Non-Tool-Specific)
From an order-flow perspective, strong support zones typically develop where prior buying activity left behind unfilled interest. When price returns to that region, two things often happen:
Sellers begin to encounter difficulty driving price lower, as remaining buy orders absorb their activity.
Compression patterns form, as the market oscillates in a tightening range while participants test whether enough liquidity remains to cause a directional shift.
A breakout of the daily wedge represents a potential change in the auction dynamic. While sellers are still active inside the wedge, a breakout suggests their pressure may have become insufficient to continue the sequence of lower highs and lower lows. Traders studying market transitions often use such moments as part of hypothetical scenarios to understand how imbalances evolve.
Forward-Looking Trade Idea (Illustrative Only)
For educational purposes, here is how a structured case study could frame a potential opportunity using the discussed charts:
Entry: A hypothetical entry could be placed above the falling wedge, around 0.0065030, once buyers demonstrate the ability to break outside the compression structure.
Stop-Loss: A logical invalidation area in this case study would be at or below the monthly support, around 0.0063330, where failure would indicate the higher-timeframe zone did not hold.
Target: A purely structural wedge projection would suggest a target near 0.0067695, aligning closely with the broader resistance region on the monthly chart.
These price points yield a reward-to-risk profile that is measurable and logically linked to structure, though not guaranteed. This case study exists solely to illustrate how support-resistance relationships and pattern logic can be combined into a coherent, rules-based plan, not as an actionable idea for trading.
Yen Futures Contract Context
The larger (6J) and micro-sized (MJY) versions of this futures market follow the same underlying price but differ in exposure and margin scale. The standard contract generally carries a greater notional value and therefore translates each price movement into a larger monetary change. The micro contract mirrors the same structure at a reduced size, allowing traders to adjust position scaling more precisely when navigating major zones or breakout structures such as the one discussed in this case study:
6J equals 12,500,000 Japanese Yen per contract, making it suitable for larger, institutional players. (1 Tick = 0.0000005 per JPY increment = $6.25. Required Margin = $2,800)
MJY equals 1,250,000 Japanese Yen per contract, making it suitable for larger, institutional players. (1 Tick = 0.000001 per JPY increment = $1.25. Required Margin = $280)
Understanding margin requirements is essential—these products are leveraged instruments, and small price changes can result in large percentage gains or losses.
Risk Management Considerations
Strong support zones can attract interest, but risk management remains the foundation of any structured approach. Traders studying these transitions typically:
size positions relative to the distance between entry and invalidation,
maintain clear exit criteria when structure fails,
avoid adjusting stops unless the market has invalidated the original reasons for the plan,
adapt to new information without anchoring to prior expectations.
These principles emphasize the importance of accepting uncertainty. Even at major support zones, markets can remain volatile, and scenarios may unfold differently than anticipated.
When charting futures, the data provided could be delayed. Traders working with the ticker symbols discussed in this idea may prefer to use CME Group real-time data plan on TradingView: www.tradingview.com - This consideration is particularly important for shorter-term traders, whereas it may be less critical for those focused on longer-term trading strategies.
General Disclaimer:
The trade ideas presented herein are solely for illustrative purposes forming a part of a case study intended to demonstrate key principles in risk management within the context of the specific market scenarios discussed. These ideas are not to be interpreted as investment recommendations or financial advice. They do not endorse or promote any specific trading strategies, financial products, or services. The information provided is based on data believed to be reliable; however, its accuracy or completeness cannot be guaranteed. Trading in financial markets involves risks, including the potential loss of principal. Each individual should conduct their own research and consult with professional financial advisors before making any investment decisions. The author or publisher of this content bears no responsibility for any actions taken based on the information provided or for any resultant financial or other losses.
ES (SPX, SPY) Analysis for Week Ahead (Nov 17th - 21st)Market Analysis: ES1 - Navigating Recent Price Action and Upcoming Economic Catalysts
Current Price Context:
The E-mini S&P 500 (ES1) is currently trading in the range of 6,755 to 6,785, following a sharp pullback from the 6,880 to 6,900 peak and a notable rebound off the 6,650 levels. While both the weekly and daily structures exhibit an overarching uptrend characterized by higher highs and higher lows, we are presently experiencing a mid-pullback phase, with prices resting below a newly established supply zone spanning 6,850 to 6,900. Importantly, we remain above the key demand shelf situated around 6,650 to 6,670.
Big Picture Overview: Weekly and Daily Trends
- Weekly Analysis: Over recent months, ES has ascended from approximately 6,000 to the 6,900 level. The past few weeks have seen a new high printed, followed by a red candle signaling a pullback towards mid-range levels. Despite this corrective move, we maintain a buffer above the preceding weekly low near the 6,500 to 6,550 range, affirming the uptrend. The current price action appears more as a corrective pause rather than a definitive peak.
- Daily Perspective: After reaching a new high just shy of the 6,900 mark, the market retreated into the mid-6,600s before bouncing back. Recent daily candles indicate a phase of consolidation within the 6,730 to 6,780 range, characterized by wicks on both ends and diminishing body sizes, alongside reduced volume compared to earlier volatility. Oscillator indicators are retreating from overbought conditions but appear to be stabilizing, suggesting a digestion phase rather than a full-scale momentum breakdown.
Shorter Timeframe Analysis (4-Hour and 1-Hour):
- On the 4-hour chart, a completed downward impulse from around 6,880 to the low 6,650s has been observed, with the price touching the 1.272 Fibonacci extension at approximately 6,653. Additional Fibonacci levels below include 6,597 (1.618) and 6,536 (2.0). The price action around the 1.272 extension has prompted a robust response, featuring significant green candles and increased volume, establishing a base between 6,700 and 6,800.
- On the 1-hour chart, the market exhibits a minor uptrend (from lower lows to higher highs) that has encountered resistance around 6,780. Currently, price action is consolidating near a pivot level of 6,750, leading to the establishment of a balance range between 6,720 and 6,780 as we head into Monday.
Summary: The broader context remains bullish on higher timeframes, with a corrective phase taking root on the medium timeframe, while the short-term landscape indicates balance. This scenario represents a classic "trend pullback parked on key support," with next week's developments likely steering us either back toward the highs or engendering a deeper test of 6,600 or 6,550, contingent on forthcoming economic data and Fed commentary.
Macro and Event Landscape: A Busy Week Ahead
The recent U.S. government shutdown has resulted in a considerable backlog of economic data releases. Market participants will be closely monitoring delayed payroll data, along with other significant indicators such as industrial production and housing metrics that are being released simultaneously. This aggregation of data is anticipated to introduce intraday volatility, particularly during the 8:30 to 10:00 AM ET windows.
Key Economic Indicators to Watch:
- Core Data Releases: In the week of November 17–21, critical releases include:
- Empire State manufacturing index
- Import and export price indices
- Industrial production and capacity utilization figures for October
- Housing starts and building permits scheduled for mid-week
- Additional delayed labor data later in the week as agencies address the backlog.
- FOMC Minutes and Fed Commentary: The release of the FOMC minutes from the late October meeting will communicate the Fed's confidence in the recent improvements in inflation and its openness to potential rate cuts in December. A lineup of Fed speakers is set to take the stage, likely influencing market sentiment and causing price reactions based on their comments.
- Corporate Earnings: Noteworthy earnings reports from Nvidia and major retailers, including Walmart, are on the calendar. Nvidia's performance will be scrutinized as a barometer for the AI segment, while insights from retail giants will provide a glimpse into consumer health as the holiday season approaches. Strong results coupled with optimistic guidance tend to buoy ES, while any disappointments could weigh on index futures, especially given the concentrated leadership from a handful of major tech stocks.
Market Sentiment and Positioning: Rate-cut expectations for December have decreased to about 40%, leaving investors cautious but not overly alarmed. This environment allows for potential relief rallies if data and Fed sentiments tilt favorably, while a series of negative reports may trigger a notable risk-off sentiment.
Conclusion: The upcoming week is poised to be event-driven, lacking a singular "mega" release like CPI but rather presenting a series of medium-to-large catalysts (Fed minutes, late payrolls, industrial production, housing statistics, Nvidia, and Walmart). Traders should be prepared for choppy conditions and liquidity fluctuations around the release times, with clearer directional moves anticipated between these events.
KEY ZONES – RESISTANCE
Resistance 1: 6,780–6,800
Immediate intraday cap formed by the last 1h high and the 4h supply block from Friday. This is the ceiling that has repeatedly turned price in the last session. A 1h or 4h close above 6,800 would confirm that buyers are back in control and likely aim for 6,850+ fairly quickly.
Resistance 2: 6,840–6,880
This is the core of the recent 4h supply and sits just below the prior daily high. It’s where the last strong sell program launched. If price trades into this pocket on light volume and stalls, that favours a lower-high top and another rotation back toward 6,720–6,700. If the tape pushes through decisively, shorts will be forced to cover.
Resistance 3: 6,900–6,930
Recent swing high / weak high area on daily. It’s the obvious target for any early-week squeeze. If this zone gets cleaned out and holds on the retest, the uptrend resumes and we can start talking about higher fib extensions and a run toward the 7,000 handle. A sharp rejection here, especially around Fed minutes or Nvidia earnings, would fit a double-top pattern and could kick off a deeper pullback leg.
Resistance 4: 7,050–7,200
This band lines up with the daily fib projection cluster (around 7,180–7,325) from the prior leg and the upper edge of the larger weekly supply. It’s not expected to be reached immediately, but if data and earnings line up bullishly, this is the swing target area for longs initiated off the 6,650–6,700 support.
KEY ZONES – SUPPORT
Support 1: 6,720–6,740
This is Friday’s late-day base and Sunday evening pivot zone, sitting right around current price. It lines up with the 1h equilibrium where price has been rotating. As long as ES holds above 6,720 on closing basis, buyers are defending the immediate balance and can make another push toward 6,780–6,800.
Support 2: 6,650–6,670
This is the recent swing low on 4h and sits just above the 1.272 extension (~6,653). It’s the first real higher-timeframe demand pocket of this pullback. A clean tag and strong bounce here would look like a classic trend-pullback low forming. A sustained break under 6,650 would suggest the market isn’t done repricing and opens the door to the deeper fibs.
Support 3: 6,595–6,610
This cluster includes the 1.618 extension (~6,597) and prior breakout structure from earlier in the trend. It’s the “deeper but still healthy” retrace area; if ES flushes into this band on bad data then snaps back, it can still preserve the weekly uptrend. Failing here would start to threaten the bullish structure and invite a test toward the prior weekly low.
Support 4: 6,530–6,560
The 2.0 extension (~6,535) plus the weekly prior low / PML region. This is a major higher-timeframe floor. If ES ever gets here this week, the tape is likely under stress, but it also becomes the zone where large buyers usually test the waters for a bigger swing entry. A weekly close below ~6,530 would be the first real warning that the uptrend is morphing into something more corrective or even distributive.
Support 5 (deeper swing): 6,300–6,350
Older weekly demand and prior quarterly low / PQL area. Not a base case for this week, but important to note as the “catastrophic” downside magnet if something truly breaks (data shock, earnings disaster, geopolitical flare-up).
SETUPS – WEEK AHEAD IDEA PACK
1. Trend-pullback continuation long from support
Location: 6,650–6,670 primary, 6,595–6,610 secondary.
Trigger idea:
Look for an overnight or early-week sweep into 6,650–6,670 that quickly rejects (long lower wick on 1h / 4h, strong reclaim back above 6,680). Ideally, this happens outside the heaviest data windows so it’s more order-flow driven than headline noise.
If that fails and price drives into 6,595–6,610 instead, repeat the same logic there: washout, strong reaction, then a reclaim of 6,620–6,630 as confirmation that buyers stepped in.
Upside path from this setup:
First target is the 6,780–6,800 cap. If that gives way, next magnet is 6,840–6,880, then a possible extension run at the 6,900–6,930 recent high area. Later in the week, if macro tailwinds show up, this move can stretch toward 7,000 and, in an optimistic case, into the 7,100+ fib cluster.
Risk management conceptually:
From a swing perspective, the “line in the sand” for this idea is under 6,595. A clean daily close below that level would invalidate the shallow-pullback idea and suggest we are heading toward 6,530–6,560 or lower.
2. Short-term fade from the 6,840–6,880 / 6,900 pocket
Location: 6,840–6,880 first, 6,900–6,930 as extension.
Trigger idea:
If ES trades up into 6,840–6,880 ahead of Fed minutes or the Nvidia/Walmart prints and shows tired price action (long upper wicks on 15m/1h, loss of intraday momentum, failure to hold above 6,860), that area is attractive for a tactical short aiming back toward the 6,780–6,750 pivot.
A more aggressive fade is possible into 6,900–6,930 if the first test breaches 6,880 but immediately stalls at the prior high.
Downside path from this setup:
First magnet is the 6,780–6,800 band, then the balance base at 6,720–6,740. If that gives way on a macro shock, sellers can push for a retest of 6,650–6,670.
Risk management conceptually:
For shorts initiated at 6,840–6,880, a protective stop makes sense above 6,910–6,920. Fades taken into a full sweep of 6,900–6,930 should respect a hard stop above ~6,950; above that, risk of a proper breakout toward 7,000+ increases sharply.
3. Range-trade scalps inside 6,720–6,780
While ES is stuck inside this intraday box, there is room for mean-reversion trades: buying dips into 6,720–6,730 and selling pushes into 6,770–6,780 with tight intraday stops. This is a lower-quality idea compared to the bigger levels, but it’s relevant if Monday and early Tuesday stay choppy while everyone waits for the meat of the calendar mid-week.
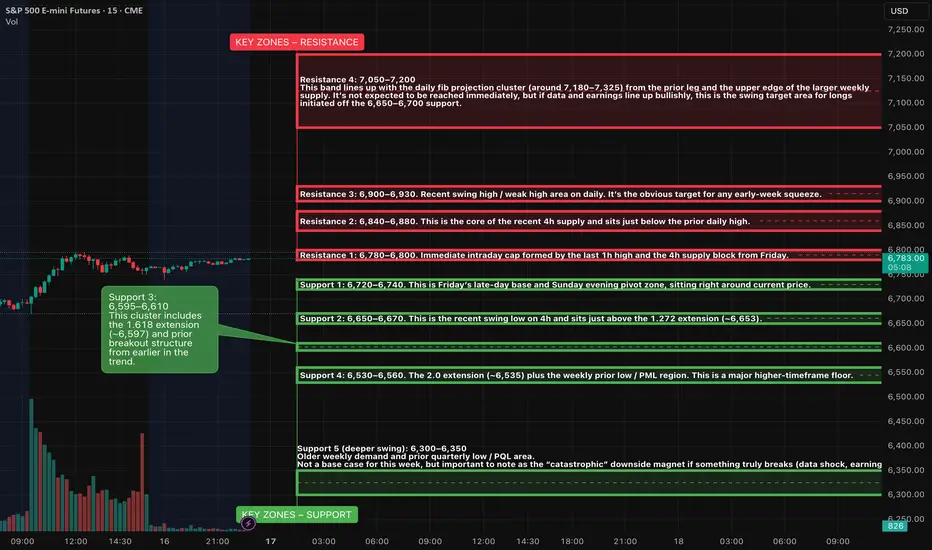
High-Potential PatternThe United States and Canada have always maintained a deeply intertwined economic relationship, shaped by nearly 9,000 kilometers of shared border and an unparalleled level of trade integration. Within this framework, the USD/CAD pair holds a special place among major currencies: it frequently alternates between extended directional trends and prolonged consolidation phases. Since early summer, the dominant trend has clearly worked against the Canadian dollar, with a steady and persistent rise in USD/CAD. As this move now appears mature, more analysts and investors are beginning to anticipate a potential turning point. The central question becomes: can the CAD finally initiate a sustainable reversal?
Fundamental Analysis
The Bank of Canada cut its policy rate to 2.25% on October 29, marking its fourth reduction of the year. However, unlike its previous decisions, the tone of the accompanying statement was noticeably more measured. The central bank now emphasizes that further rate cuts are not guaranteed, noting that current monetary policy is consistent with the evolution of inflation and labor market dynamics. While acknowledging the economic slowdown, the BoC views current financial conditions as sufficiently accommodative to help the economy navigate this adjustment period. In other words, the bank is signaling a technical pause after an already substantial easing cycle. This stance limits expectations for additional rapid cuts, offering structural support to the CAD by stabilizing Canada–U.S. rate differentials.
In the United States, the Federal Reserve also cut rates by 25 basis points on the same day. However, Chair Jerome Powell struck a more hawkish tone than anticipated, stressing macroeconomic uncertainty and the need to preserve flexibility before considering further easing. As a result, the implied probability of a rate cut in December dropped from 95% at the end of last month to less than 50% today, according to the CME FedWatch indicator.
At the intersection of these two dynamics, the CAD benefits from relative support: the BoC has more explicitly signaled the end of its cycle, while the Fed has merely slowed its pace without ruling out additional easing. This imbalance creates an environment where a CAD rebound appears fundamentally credible.
Commodity prices remain an important driver of CAD movements, but they currently have a neutral to slightly positive influence. Oil remains too weak to provide strong support, but the resilience of copper and industrial metals helps stabilize the Loonie after several weeks of pressure.
Technical Analysis
From a chart perspective, an initial attempt at a Canadian dollar rebound is emerging. The USD/CAD pair is testing key support at 1.40, a pivotal level watched closely across the market.
The CAD December futures contract (6CZ5) is moving away from a recent low of 0.7086 set on November 6. To confirm a more meaningful reversal, the CAD must break through successive resistance zones at 0.7220, 0.7320, and 0.7440. A move toward the latter would represent a genuine test and a potential profit-taking zone.
The current structure resembles an accumulation phase following a long bearish sequence. As long as support at 0.7086 holds, the odds of a rebound remain valid.
Sentiment Analysis
FX/CFD broker data shows balanced positioning on USD/CAD. Retail traders display no significant directional bias for now, limiting the availability of contrarian signals. However, it is well-established that as the CAD strengthens, retail traders tend to increase their short exposure, a typical behavior during trend reversals.
On the institutional side, the U.S. government shutdown has prevented the publication of the weekly COT report for several weeks, depriving the market of a key indicator. Nonetheless, several major U.S. bank desks continue to share their views:
JPMorgan believes that although Canadian fundamentals have improved only modestly, they remain strong enough to support a corrective move in the CAD.
Morgan Stanley and Goldman Sachs note that the USD has lost part of its post-FOMC momentum, opening the door to a temporary rebalancing in favor of cyclical currencies, including the CAD.
Crédit Agricole CIB highlights that U.S.–Canada data divergences now lean in favor of a lower USD/CAD in the near term.
Institutional consensus remains cautious, but several major players have begun positioning for a USD/CAD correction, reinforcing the notion of a potential inflection point.
Listed Options Analysis
Positions in listed options, assessed via the CME Group’s Open Interest Heatmap, reveal several areas of interest that may influence price behavior.
For the 6CZ5 contract, although put clusters appear between 0.7150 and 0.70, indicating lingering downside risk, there is a notable concentration of calls around the 0.7200 and 0.7300 strikes. This accumulation of open interest creates attraction zones that may exert a magnetic effect if the CAD initiates a normalization move.
Interestingly, a significant density of positions is also visible between 0.74 and 0.7450, aligned with the previously mentioned technical resistance. This suggests that if the market begins to rebound, gamma flows and option-seller repositioning could facilitate a move toward 0.7440 rather than impede it.
Trade Idea
Buy 6CZ5 at current levels, targeting a move toward 0.7320 and then 0.7440. Set a stop on a daily close below 0.7086, the November 6 low, with the option to re-enter near 0.70 if needed.
This strategy relies on a gradual CAD recovery supported by aligned fundamentals, technicals, and options-market signals.
Final Thoughts
Recent U.S. dollar strength, fueled by Jerome Powell’s more hawkish tone, has given the USD renewed momentum. Paradoxically, this may represent an opportunity to buy CAD at better levels. The Bank of Canada appears to have reached the end of its easing cycle, while nothing suggests the Fed is ruling out further cuts in the coming months, particularly in an environment of reduced macro visibility and still-restrictive financial conditions.
Taken together, fundamentals, technicals, sentiment, and options positioning, the overall picture favors a corrective rebound in the CAD after a lengthy period of weakness. If support around 0.7086 continues to hold, the scenario of a move toward 0.7320 and then 0.7440 gains substantial credibility.
---
When charting futures, the data provided could be delayed. Traders working with the ticker symbols discussed in this idea may prefer to use CME Group real-time data plan on TradingView: tradingview.com/cme/ .
This consideration is particularly important for shorter-term traders, whereas it may be less critical for those focused on longer-term trading strategies.
General Disclaimer:
The trade ideas presented herein are solely for illustrative purposes forming a part of a case study intended to demonstrate key principles in risk management within the context of the specific market scenarios discussed. These ideas are not to be interpreted as investment recommendations or financial advice. They do not endorse or promote any specific trading strategies, financial products, or services. The information provided is based on data believed to be reliable; however, its accuracy or completeness cannot be guaranteed. Trading in financial markets involves risks, including the potential loss of principal. Each individual should conduct their own research and consult with professional financial advisors before making any investment decisions. The author or publisher of this content bears no responsibility for any actions taken based on the information provided or for any resultant financial or other losses.
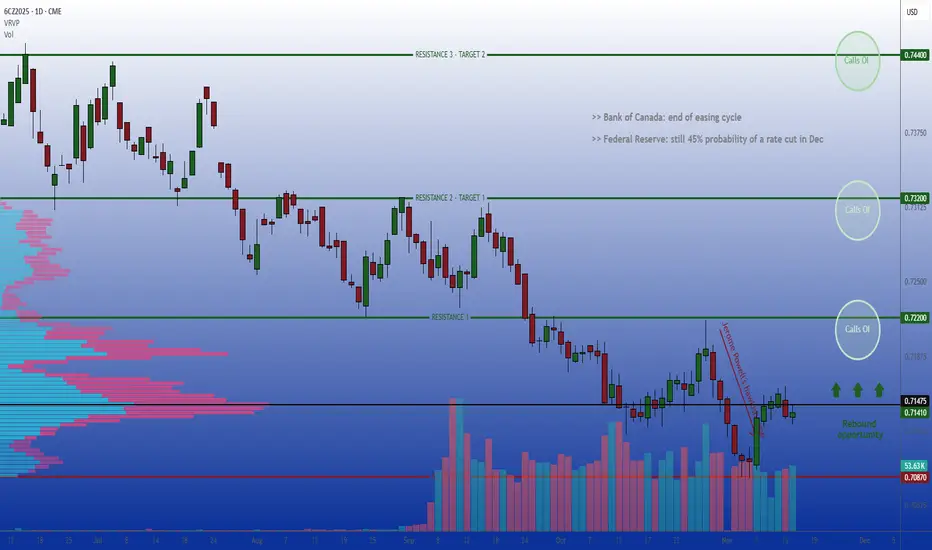
US100 – Consolidation Between FVGs, Watching for Bullish BreakouHello traders,
On the daily timeframe, NASDAQ (US100) is currently consolidating between a bullish and a bearish Fair Value Gap (FVG). Both sides present clear liquidity areas, and the market is preparing for its next directional move.
From my perspective, I’d like to see the price tap into the bullish FVG first, react from that zone, and then invalidate the bearish FVG on its way higher.
If this scenario plays out, the next targets would be the equal highs (EQH) and eventually a new all-time high (ATH).
However, if a daily candle closes below the bullish FVG, this idea becomes invalid and we could expect further downside movement.
For now, I remain bullish while the bullish FVG holds. 📈
💌It is my honor to share your comments with me💌
🔎 DYOR
💡Wait for the update!

ES (SPX, SPY) Analysis, Levels, Setups for Wed (Nov 12)Price closed near the prior week’s highs after a clear four-hour impulsive leg from last Friday’s low. Momentum appears constructive while the 15-minute swing structure holds higher lows above the New York value shelf.
Setups:
Play A — Acceptance Long: Wait for a 15m full-body close ≥6,900 and a 5m pullback that holds ≥6,892–6,895. Enter on a 1m HL reclaim. Hard SL = 15m trigger-wick low minus 0.25–0.50. TP1 6,915. TP2 6,935. TP3 6,955–6,975. Viability gate: TP1 must be ≥2.0R versus the 15m stop.
Play B — Rejection Fade: If 6,900–6,915 rejects with a 15m close back inside ≤6,889, enter on a 5m re-close lower and a 1m LH. Hard SL = 6,905–6,912 (above rejection wick). TP1 6,872. TP2 6,852. TP3 6,839→6,810 if momentum accelerates.
Bias & Invalidation: Bias is mildly bullish while 6,865–6,872 holds on 15m closes. Bias flips neutral-to-bearish on decisive 15m body-through below 6,839.
Kill-Zones (ET): NY AM 09:30–11:00 for entries. Manage through Lunch. NY PM 13:30–16:00 for follow-through or fades into exhaustion.
News & Events (tomorrow): No CPI risk on the docket. Watch the U.S. 10-Year Note auction around 13:00 ET and headline risk from the OPEC and IEA monthly oil reports in the morning; both can sway rates and index tone.

The Pattern That Looked Bullish… Until It Didn’t1. The “Too Good to Be True” Setup
You’ve seen it a hundred times — that shiny W-shaped pattern that screams reversal.
Traders spot it, celebrate it, and rush in before it even completes.
But not every double bottom deserves a standing ovation. Sometimes, what looks like a powerful comeback is actually the calm before another dip.
2. Meet the Real Players: FO vs. UFO
Behind every pattern hides a tug-of-war between two invisible forces:
FO (Filled Orders): Where buyers already did their job. The gas tank’s empty.
UFO (UnFilled Orders): Where fresh buyers are still waiting. That’s where the real fuel sits.
In our current setup, price bounced from an FO zone that already spent its energy.
The next UFO zone — the untouched demand — sits lower.
Translation? The market might need one more leg down to refuel before any real rally begins.
3. The Bear Hiding Inside the Bull
Chart shapes can lie.
Order flow doesn’t tend to.
When price sits on an FO support and the next UFO level is far below, odds tilt toward a break, not a bounce.
It’s like jumping on a trampoline that’s already been stretched too far — it might not spring you up again this time.
4. Rethink “Confirmation”
Pattern traders often buy the moment they spot symmetry. Smart traders wait for liquidity confirmation — the moment unfilled demand actually engages.
If that doesn’t happen, all you’ve got is a good-looking shape on a tired level.
5. The Real Lesson
Patterns attract attention.
Order flow reveals intent.
Patience separates analysis from impulse.
The next time a chart whispers “reversal,” ask yourself: Is it running on new energy or recycled hope?
Want More Depth?
If you’d like to go deeper into the building blocks of trading, check out our From Mystery to Mastery trilogy, three cornerstone articles that complement this one:
🔗 From Mystery to Mastery: Trading Essentials
🔗 From Mystery to Mastery: Futures Explained
🔗 From Mystery to Mastery: Options Explained
When charting futures, the data provided could be delayed. Traders working with the ticker symbols discussed in this idea may prefer to use CME Group real-time data plan on TradingView: www.tradingview.com - This consideration is particularly important for shorter-term traders, whereas it may be less critical for those focused on longer-term trading strategies.
General Disclaimer:
The trade ideas presented herein are solely for illustrative purposes forming a part of a case study intended to demonstrate key principles in risk management within the context of the specific market scenarios discussed. These ideas are not to be interpreted as investment recommendations or financial advice. They do not endorse or promote any specific trading strategies, financial products, or services. The information provided is based on data believed to be reliable; however, its accuracy or completeness cannot be guaranteed. Trading in financial markets involves risks, including the potential loss of principal. Each individual should conduct their own research and consult with professional financial advisors before making any investment decisions. The author or publisher of this content bears no responsibility for any actions taken based on the information provided or for any resultant financial or other losses.
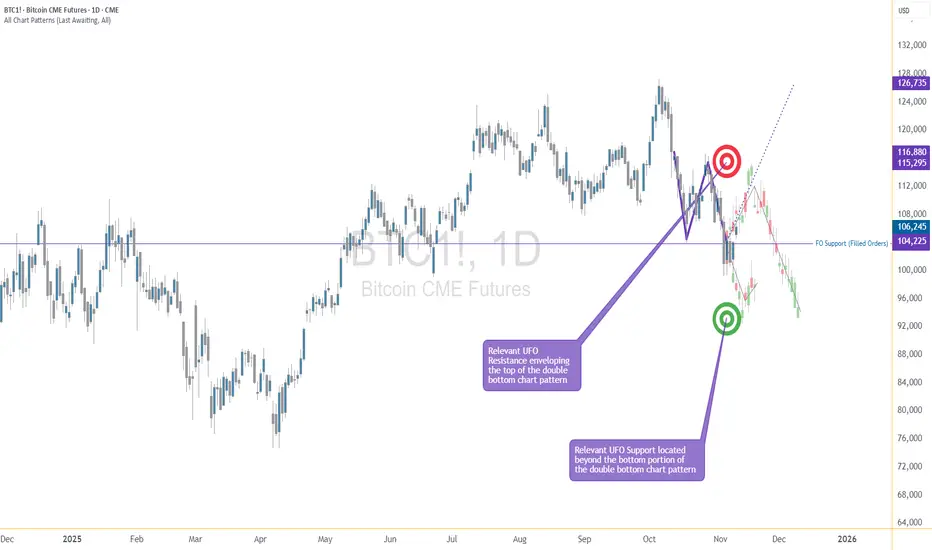
ES (SPX, SPY) Key Levels, Analysis and Setups for Fri (Oct 7th)EVENTS (ET, unaffected by shutdown): 3:00am NY Fed Williams speech; 7:00am Fed Vice Chair Jefferson speech; 10:00am Univ. of Michigan Consumer Sentiment (prelim); 2:00pm Fed G.19 Consumer Credit. Employment Situation report is postponed due to the shutdown (treat as no 8:30am print).
SETUPS (Level-KZ Protocol 15m→5m→1m)
ES LONG (A++) — 6,767 reclaim → 6,784 → 6,821
Entry: 6,768–6,772 after a 5m close and hold above 6,767 with 1m HL confirmation.
Hard SL: 6,755.
TP1: 6,784. TP2: 6,821. TP3: 6,845 if momentum persists.
ES SHORT (A++) — 6,784–6,790 pop-and-fail → 6,749 → 6,733
Entry: 6,782–6,789 on a 15m rejection close back inside the band followed by a 5m re-close down.
Hard SL: 6,796.
TP1: 6,767. TP2: 6,749. TP3: 6,733.
ES LONG (A+ Bounce) — 6,742–6,749 sweep & instant reclaim → 6,767 → 6,784
Entry: 6,750–6,753 after a swift reclaim and 1m HL.
Hard SL: 6,740.
TP1: 6,767. TP2: 6,784. TP3: 6,821.
ES SHORT (A+ Continuation) — 6,733 breakdown & retest → 6,700 → 6,659
Entry: 6,732–6,728 on 15m acceptance below 6,733 and a 5m LH retest.
Hard SL: 6,744.
TP1: 6,700. TP2: 6,659. TP3: 6,597.
KILL-ZONES & MANAGEMENT
Asia 20:00–00:00 optional and lighter size, London 02:00–05:00 optional, NY AM 09:30–11:00 primary for entries, Lunch 12:00–13:00 manage only, NY PM 13:30–16:00 allows second push or reversal plays. Daily guardrails: stop at −2R net or lock in ≥+3R net.
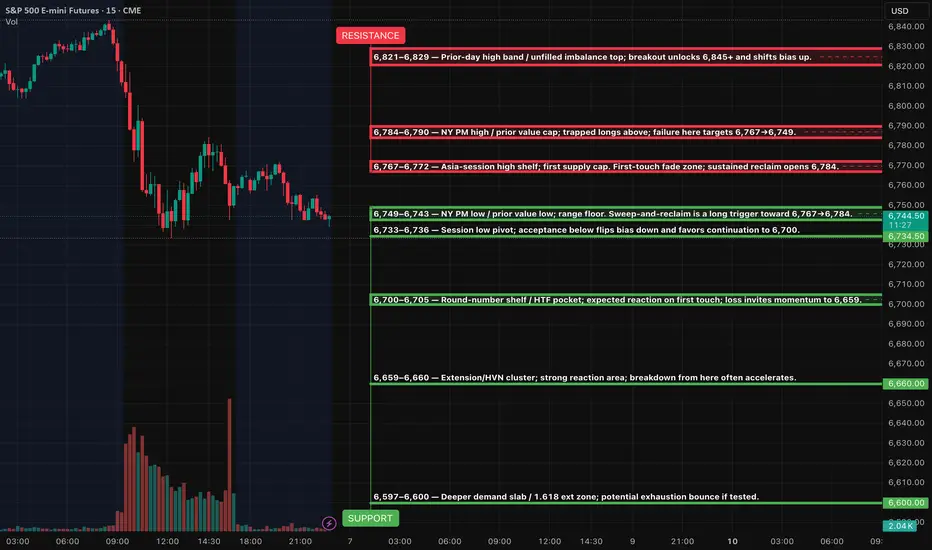
Nasdaq reversa 6-11-25Sellers were absorbed in that area, and the Nasdaq will likely reverse from this point in the coming days.
If it breaks through the supply zone, the trend could turn bullish in the next few days.

ES (SPX, SPY) Analysis, Key Zones, Setups for Thu (Nov 6)The daily trend has softened following the formation of a lower high. Analysis of the 4-hour chart indicates a bounce that encountered resistance near the 6860–6870 range, subsequently retreating to the 6810 support level. As we look ahead to tomorrow's trading, consider the 6805–6808 range as the key intraday “threshold” while the 6830–6835 zone will serve as the first significant resistance level to watch.
Setups (Level-KZ Protocol 15/5/1; NY KZ 09:30–11:00 & 13:30–16:00 ET)
1. Acceptance long from support
Trigger: 15m holds S1 6805–6808 → 5m reclaim 6823 VWAP → 5m close above 6830.
Entry: 6831–6834 on first 1m HL after the 5m re-close.
SL: 6821 (hard) or 15m trigger-wick −0.25–0.50 pt.
TP1: 6856–6861 (≥2R gate).
TP2: 6870–6873.
TP3: 6890–6895 if squeeze.
Management: No partials before TP1; at TP1 close 70%, set 30% runner to BE; no trail before TP2.
2. Rejection fade short from resistance
Trigger: Pop into 6856–6861, stall, then 5m full-body re-close back below 6856 with 1m LH.
Entry: 6850–6854.
SL: 6864.25 (hard) or 15m wick +0.25–0.50.
TP1: 6830–6832.
TP2: 6823 VWAP.
TP3: 6805–6808.
Note: If 5m re-claims 6861 after entry, exit early; setup invalid.
3. Breakdown continuation short
Trigger: 5m body close below 6805 with retest fail from beneath.
Entry: 6800–6803.
SL: 6810.75 (hard) or 15m wick +0.25–0.50.
TP1: 6790–6795.
TP2: 6768–6772.
TP3: 6747–6752.
Note: If reclaim and 5m closes back above 6808, cancel.
4. Breakout continuation long
Trigger: 5m acceptance above 6861 and hold on retest.
Entry: 6862–6865 on first 1m HL.
SL: 6853.25.
TP1: 6870–6873.
TP2: 6885–6890.
TP3: 6905–6912.
Note: If acceptance fails (5m body back under 6861), flip bias back to fade R3.
Event map for Thursday (ET)
FOMC meeting Day 1 (runs Thu–Fri; Fed is not affected).
EIA Weekly Natural Gas Storage 10:30.
Most BLS/DOL macro releases (e.g., Productivity & Costs, Weekly Jobless Claims) are suspended during the shutdown. Expect fewer 8:30 prints and thinner liquidity until the cash open.
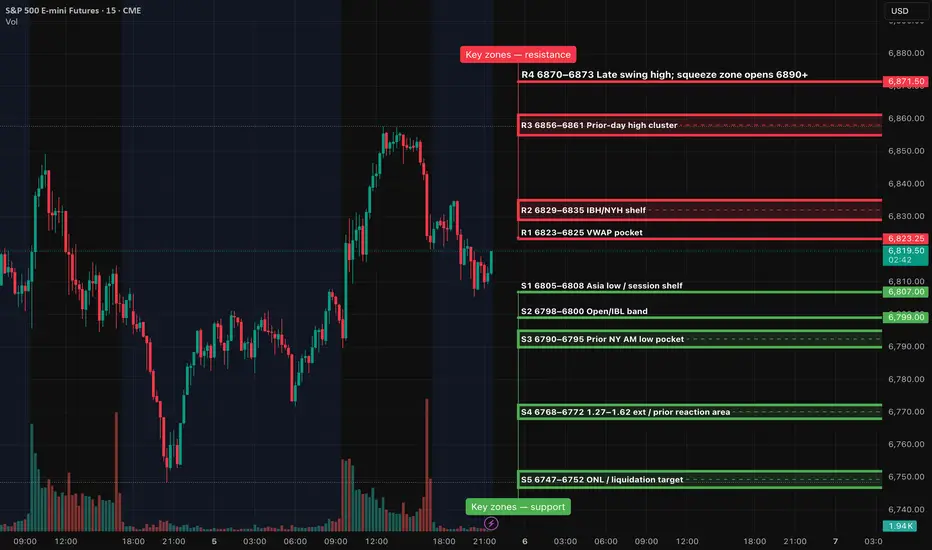
How to Trade with MACD in TradingViewMaster the MACD indicator using TradingView’s charting tools in this comprehensive tutorial from Optimus Futures.
The Moving Average Convergence Divergence (MACD) is a momentum and trend-following indicator that helps traders identify shifts in market direction and momentum strength. It measures the relationship between two exponential moving averages (EMAs) to reveal when momentum may be building or fading.
What You’ll Learn:
Understanding MACD as a tool that tracks the convergence and divergence of moving averages
How the MACD line is calculated as the difference between the 12-period and 26-period EMAs
How the Signal line acts as a 9-period EMA of the MACD line and serves as a trigger for potential buy or sell signals
How the Histogram visualizes the distance between the MACD line and Signal line to show momentum strength
Recognizing bullish and bearish crossovers between the MACD and Signal lines
How to interpret the Zero Line as a momentum baseline — above zero suggests an uptrend, below zero suggests a downtrend
Identifying bullish and bearish divergences between MACD and price to anticipate potential reversals
Why crossovers and divergences should be confirmed with price action and trend structure, not used in isolation
How to add MACD to a TradingView chart via the Indicators menu
Understanding the default settings (12, 26, 9) and how adjusting them changes responsiveness
Practical examples on the E-mini S&P 500 futures chart to illustrate MACD signals in real market conditions
Applying MACD across multiple timeframes — daily, weekly, or intraday — for higher-confidence confirmations
This tutorial will benefit futures traders, swing traders, and technical analysts who want to incorporate MACD into their trading process.
The concepts covered may help you identify trend changes, momentum shifts, and potential entry or exit points across different markets and timeframes.
Learn more about futures trading with TradingView:
optimusfutures.com
Disclaimer
There is a substantial risk of loss in futures trading. Past performance is not indicative of future results. Please trade only with risk capital. We are not responsible for any third-party links, comments, or content shared on TradingView. Any opinions, links, or messages posted by users on TradingView do not represent our views or recommendations. Please exercise your own judgment and due diligence when engaging with any external content or user commentary.
This video represents the opinion of Optimus Futures and is intended for educational purposes only.
Chart interpretations are presented solely to illustrate objective technical concepts and should not be viewed as predictive of future market behavior. In our opinion, charts are analytical tools — not forecasting instruments.

The Double Bottom Trap That Traders Might Miss1. The Comfort Zone of Classic Patterns
Few formations attract traders’ attention like a double bottom. It’s one of those timeless chart patterns that promise hope after a long decline—a visual story of selling exhaustion followed by a bullish reversal.
But markets rarely reward what’s obvious. In futures trading, especially when examining instruments like Bitcoin Futures (BTC) and Micro Bitcoin Futures (MBT), patterns are only half the story. What truly moves price isn’t just the shape on the chart—it’s the order flow behind it.
That’s where understanding FO (Filled Orders) and UFO (UnFilled Orders) becomes essential. Both represent past and potential liquidity imbalances, and reading their relationship can transform how traders interpret “classic” setups.
2. The Bitcoin Setup: A Tale of Two Bottoms
The current BTC daily chart paints what seems like a textbook double bottom. Two price troughs form near the same horizontal area around $104,000, setting up the typical “W” shape many traders see as a bullish reversal pattern.
However, when we dig deeper into the order flow structure, the illusion begins to fade.
A FO Support level exists near $103,860, meaning that this area previously attracted enough buyers to halt a decline—but those orders have already been filled and we know this given the fact that price turned at that price level before.
The next UFO Support zone sits much lower, around $95,640. That’s where unfilled buy orders are expected to remain waiting, untouched.
This distinction matters. While FO zones mark previous turning points, UFO zones highlight potential turning points that still contain resting liquidity. In simple terms, FO areas represent “used energy,” while UFO areas represent “stored energy.”
3. FO vs. UFO – The Order Flow Reality Check
Let’s define these two concepts with precision:
FO (Filled Orders): Price zones where significant buying or selling already occurred. These levels once reversed price, but because those orders were executed, fewer remain to defend the level again.
UFO (UnFilled Orders): Price zones containing pending buy or sell orders not yet triggered. They represent areas of fresh imbalance and therefore carry a higher probability of influencing future price moves.
In our Bitcoin case, the FO Support around $103,860 has done its job already—it stopped price before. But now, the unfilled buying interest lies lower, implying that the market may need to travel down to reach fresh demand at $95,640.
On the other side, UFO Resistance hovers near $112,410, enveloping the top of the double bottom structure. Should the price rebound toward that level, sellers waiting there could re-enter the scene, potentially capping any bullish recovery.
The conclusion? This pattern isn’t as bullish as it looks.
4. When Bullish Shapes Hide Bearish Probabilities
Most traders spot the double bottom and immediately think “trend reversal.” Yet, the distance between FO and UFO levels tells a more subtle story.
Since FO Support levels carry reduced strength after being tested, they’re more likely to break than hold. In this context, the probability favors a downside continuation rather than an immediate bounce.
If price breaches $103,860, the next probable destination becomes the UFO Support at $95,640. Only then, after reaching that pocket of unfilled demand, might a significant rebound have higher odds.
It’s a reminder that technical patterns, while valuable, must always be filtered through liquidity context. A pattern without order flow validation is like reading the market’s outline without its story.
5. Quantitative Insight: A Probabilistic Lens
Think of this in probabilistic terms:
When FO zones sit above UFO zones, the market often continues toward the unfilled liquidity.
When UFO zones lie closer to current price, reversals occur faster because demand (or supply) is still waiting to be executed.
In our example, BTC shows a larger gap between FO and UFO support levels, signaling lower immediate reversal odds. The chart may appear bullish, but the underlying order flow distribution points to weakness first, strength later.
This is not a prediction—it’s an observation of potential. It allows traders to structure their expectations based on where fresh participation is more likely to emerge.
6. Risk Management: Navigating the Trap
For traders considering setups around this structure, risk management is crucial.
Entry awareness: Avoid entering long positions purely because a double bottom “looks bullish.” Consider waiting for evidence of unfilled demand being triggered (confirmation at or near UFO Support).
Stop-loss placement: Stops below FO Support can easily be hunted in liquidity sweeps; better to align risk control with genuine unfilled demand areas.
Reward-to-risk thinking: A test of the UFO Support near $95,640 could later offer a more favorable upside-to-downside ratio than buying prematurely at $104,000.
Remember, pattern-based entries without liquidity confirmation often carry poor asymmetry—small upside with large downside risk.
7. Futures Structure and Margin Awareness
Both BTC and MBT represent Bitcoin exposure via futures contracts, but their sizing differs dramatically.
BTC equals 5 Bitcoin per contract, making it suitable for larger, institutional players. (1 Tick = 5 = $25. Required Margin = $132,500)
MBT, the Micro Bitcoin Futures, equals 0.1 Bitcoin per contract, offering flexibility for smaller accounts and finer position scaling. (1 Tick = 5 = $0.50. Required Margin = $2,600)
Understanding margin requirements is essential—these products are leveraged instruments, and small price changes can result in large percentage gains or losses.
8. Key Takeaway: The Hidden Lesson
This entire setup illustrates a powerful educational point:
Chart patterns may draw the eye, but order flow tells the truth.
The double bottom may invite buyers, but the imbalance between FO and UFO zones exposes an underlying weakness. Traders who rely solely on visual patterns may walk straight into a trap. Those who align patterns with liquidity insights, however, read the market at a deeper level.
In the current context, BTC and MBT might need to visit lower support levels before finding true stability. Watching how price behaves around these unfilled order zones will reveal whether this double bottom turns into a lasting floor—or just another false start.
When charting futures, the data provided could be delayed. Traders working with the ticker symbols discussed in this idea may prefer to use CME Group real-time data plan on TradingView: www.tradingview.com - This consideration is particularly important for shorter-term traders, whereas it may be less critical for those focused on longer-term trading strategies.
General Disclaimer:
The trade ideas presented herein are solely for illustrative purposes forming a part of a case study intended to demonstrate key principles in risk management within the context of the specific market scenarios discussed. These ideas are not to be interpreted as investment recommendations or financial advice. They do not endorse or promote any specific trading strategies, financial products, or services. The information provided is based on data believed to be reliable; however, its accuracy or completeness cannot be guaranteed. Trading in financial markets involves risks, including the potential loss of principal. Each individual should conduct their own research and consult with professional financial advisors before making any investment decisions. The author or publisher of this content bears no responsibility for any actions taken based on the information provided or for any resultant financial or other losses.

Choosing Your Path in Futures TradingThere’s more than one way to participate in the futures markets. Whether you're hands-on or prefer a more passive approach, selecting the right method depends on your trading goals, risk tolerance, and available time. Here’s a breakdown of the most common approaches used by active and aspiring futures traders.
1. Self-Directed Trading
If you like full control over your trades, this approach is for you. It requires staying up to date on market news, analyzing charts, and executing your own trades according to a plan and framework which can be referred to as your “strategy.” Experienced traders may prefer this model for its flexibility and transparency.
Past performance is not indicative of future results.
2. Automated Trading Systems
These systems use predefined rules to analyze data and execute trades without manual intervention. They can be ideal for traders who want to capitalize on algorithmic speed and logic while minimizing emotional decision-making, or for traders who might not have the time to dedicate to self-directed trading.
EdgeClear offers connectivity to a handful of automated programs, if you are interested in learning more please contact us.
3. Managed Futures
For a more passive route, managed futures allow you to invest in futures contracts through a Commodity Trading Advisor (CTA) or Commodity Pool Operator (CPO). The advisor handles the trading, using their expertise to manage risk and seek opportunity.
4. Broker-Assisted Trading
Prefer to have a trusted guide by your side? With broker-assisted trading, a professional helps execute trades, manage risk, and offer support—all tailored to your preferences.
Key Takeaway
Every trader’s journey in the futures markets looks different. Whether you thrive on taking full control of your trades, prefer automated systems, or rely on professional guidance, the key is to find the approach that aligns with your goals, risk tolerance, and lifestyle.
Understanding the options available self-directed, automated, managed, or broker-assisted empowers you to trade more confidently and effectively.
Call to Action
At EdgeClear, we’re dedicated to helping traders at every level find the tools, guidance, and support they need to succeed. Explore our platforms, connect with our expert brokers, or follow us on TradingView to discover more Trade Ideas and educational content to refine your edge.