Choosing Your Path in Futures TradingThere’s more than one way to participate in the futures markets. Whether you're hands-on or prefer a more passive approach, selecting the right method depends on your trading goals, risk tolerance, and available time. Here’s a breakdown of the most common approaches used by active and aspiring futures traders.
1. Self-Directed Trading
If you like full control over your trades, this approach is for you. It requires staying up to date on market news, analyzing charts, and executing your own trades according to a plan and framework which can be referred to as your “strategy.” Experienced traders may prefer this model for its flexibility and transparency.
Past performance is not indicative of future results.
2. Automated Trading Systems
These systems use predefined rules to analyze data and execute trades without manual intervention. They can be ideal for traders who want to capitalize on algorithmic speed and logic while minimizing emotional decision-making, or for traders who might not have the time to dedicate to self-directed trading.
EdgeClear offers connectivity to a handful of automated programs, if you are interested in learning more please contact us.
3. Managed Futures
For a more passive route, managed futures allow you to invest in futures contracts through a Commodity Trading Advisor (CTA) or Commodity Pool Operator (CPO). The advisor handles the trading, using their expertise to manage risk and seek opportunity.
4. Broker-Assisted Trading
Prefer to have a trusted guide by your side? With broker-assisted trading, a professional helps execute trades, manage risk, and offer support—all tailored to your preferences.
Key Takeaway
Every trader’s journey in the futures markets looks different. Whether you thrive on taking full control of your trades, prefer automated systems, or rely on professional guidance, the key is to find the approach that aligns with your goals, risk tolerance, and lifestyle.
Understanding the options available self-directed, automated, managed, or broker-assisted empowers you to trade more confidently and effectively.
Call to Action
At EdgeClear, we’re dedicated to helping traders at every level find the tools, guidance, and support they need to succeed. Explore our platforms, connect with our expert brokers, or follow us on TradingView to discover more Trade Ideas and educational content to refine your edge.
Futurestrading
How to enter a successful futures tradeDrop everything and let me show you how to enter a successful long position with the lowest possible risk.
You need to understand that the market maker usually acts against us at major support areas on the chart — like the 100 EMA, 0.618 Fibonacci level, or a trendline.
To make this clearer, let’s take TAO as an example and I’ll explain why.
TAO has strong momentum and a large market cap,
so don’t apply what I’m about to say to meme coins, for example.
Now let’s go step by step on how to enter a futures position after choosing the coin 👇
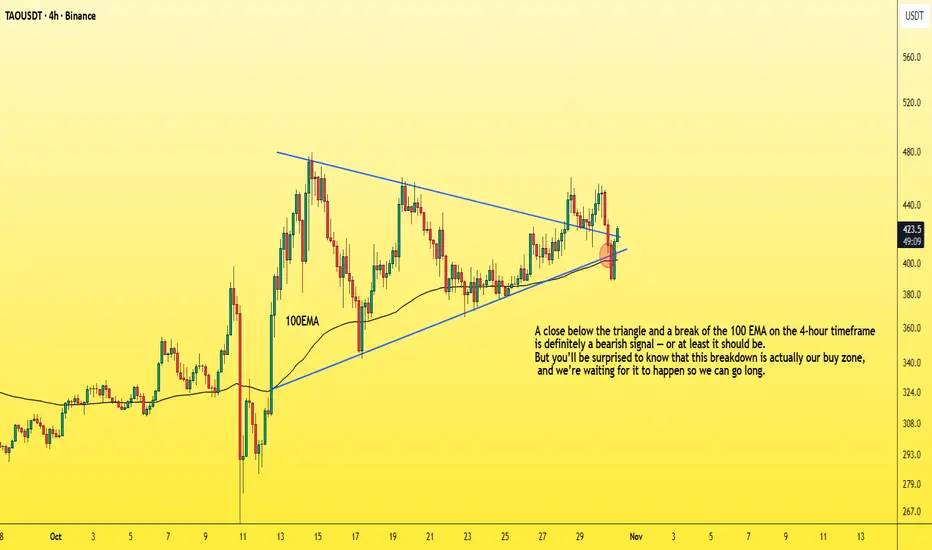
1. First, wait for a bullish pattern to form — like a triangle — and for the coin to break it upwards with increasing long momentum.
2. The price will then retest the trendline, encouraging people to enter with larger positions, and those who missed the first breakout will likely place buy orders at the retest zone.
3. Then, the market surprises them — it drops back inside the triangle, giving a small bounce at the lower side.
4. But it doesn’t stop there — it continues dropping, breaking below the triangle and closing below the 100 EMA on the 4-hour chart.
This makes you panic and close your long position.
Others start entering shorts thinking it’s a real breakdown.
5. That’s when the market reverses sharply upward,
trapping short traders in losses,
while long traders who exited too early also lose.
In the end, only those who placed buy orders slightly below the strong support level (not directly on it, like under the 100 EMA) — and of course the market maker — end up winning.
So basically, the long traders lose, the short traders lose,
and only a small percentage of smart traders and the market maker win.
Small things to pay attention to 👇
-Your entry point should be slightly below the support, not too far below it.
(That support could be the 100 EMA, below the triangle pattern, or the 0.618 Fibonacci level, as we mentioned.)
-Don’t use high leverage — x5 should be your maximum.
-Place your stop loss 5% below your entry zone,
which equals about 25% loss if you’re using x5 leverage.
And with that, you’ve got yourself a long setup with over a 90% success rate,
and you can apply the same logic in reverse when taking a short position.
Best Regards:
Ceciliones🎯
When Generals Run and Soldiers Nap — The Market’s Odd ParadeEver seen an army march where the generals sprint ahead, but the soldiers just yawn and stay behind?
That’s exactly what’s happening in the U.S. futures battlefield right now.
The ES, NQ, and YM — our large-cap “generals” — opened the week above their prior highs, looking ready for victory speeches. But the RTY, representing small caps, is still lagging like it hit the snooze button.
The Breadth Problem
Healthy rallies need everyone on board. When small caps don’t join the charge, it’s like running a marathon with only one leg — you might move forward, but not for long.
That’s why this gap between the big guys and the small ones is called bearish divergence — momentum without muscle.
How Deep Could It Go?
Under the surface, liquidity pockets (UFO supports) show the “landing zones” below price:
ES: ~5% lower
NQ: ~6% lower
YM: ~9% lower
RTY: ~14% lower (!)
Translation: if the market trips, the generals may bruise a knee — but the soldiers could roll down the hill.
Tick, Margin, and Scale
CME index futures come in two flavors — E-minis for the pros, Micro E-minis for precision control:
S&P 500 (ES/MES): tick 0.25 → $12.50 / $1.25; margin ≈ $21K / $2.1K
Nasdaq 100 (NQ/MNQ): tick 0.25 → $5 / $0.50; margin ≈ $30K / $3K
Dow Jones (YM/MYM): tick 1 → $5 / $0.50; margin ≈ $13K / $1.3K
Russell 2000 (RTY/M2K): tick 0.10 → $5 / $0.50; margin ≈ $9K / $0.9K
(Approximate numbers, educational only.)
The Lesson
Breadth divergences don’t “predict” the end of the rally — they just whisper: “Careful, this parade’s out of sync.”
So before chasing the next breakout, remember:
even the best generals can’t win a war if their soldiers stay in camp.
Want More Depth?
If you’d like to go deeper into the building blocks of trading, check out our From Mystery to Mastery trilogy, three cornerstone articles that complement this one:
🔗 From Mystery to Mastery: Trading Essentials
🔗 From Mystery to Mastery: Futures Explained
🔗 From Mystery to Mastery: Options Explained
When charting futures, the data provided could be delayed. Traders working with the ticker symbols discussed in this idea may prefer to use CME Group real-time data plan on TradingView: www.tradingview.com - This consideration is particularly important for shorter-term traders, whereas it may be less critical for those focused on longer-term trading strategies.
General Disclaimer:
The trade ideas presented herein are solely for illustrative purposes forming a part of a case study intended to demonstrate key principles in risk management within the context of the specific market scenarios discussed. These ideas are not to be interpreted as investment recommendations or financial advice. They do not endorse or promote any specific trading strategies, financial products, or services. The information provided is based on data believed to be reliable; however, its accuracy or completeness cannot be guaranteed. Trading in financial markets involves risks, including the potential loss of principal. Each individual should conduct their own research and consult with professional financial advisors before making any investment decisions. The author or publisher of this content bears no responsibility for any actions taken based on the information provided or for any resultant financial or other losses.
Live Day Trading Losing $1097Failed breakout to the upside.
Revenge traded by reentering several times.
Could of avoided if I quickly set my stop-loss at breakeven.
CBOT_MINI:YM1!

Live Trading - Breakeven pt.2Was aiming for a gap fill.
Sold at breakeven, and protected capital.
CBOT_MINI:YM1!

Live Trading pt.1Part 1 of a trade I am currently in right now.
Down around $300.
Aiming for a gap fill.

Understanding Margin & Mechanics in Futures MarketsBefore you trade Futures, it’s essential to understand how these markets operate, especially how margin, leverage, and settlement work. This insight helps you manage risk, stay capital-efficient, and avoid unnecessary surprises.
Margin Basics
Every future position requires margin. It’s important to note margin is not an added cost per contract, margin is a good-faith deposit or can be thought of as a “performance bond” to ensure you can meet your obligations. There are three main types:
Initial Margin: The exchange sets this as a percentage of the contract’s notional value based on a wide variety of factors including volatility, size of the contract, and average market movement.
Maintenance Margin: The minimum balance required to keep your position open. If your balance drops below this, you’ll get a margin call.
Day Trading Margin: Set by your broker, often a fraction of the exchanges Initial Margin. Day Trading margins can provide more leverage, but in turn this comes with more risk.
Leverage in Action
Futures are leveraged products. With just a small amount of capital, you can control a much larger position. For example, with the E-mini S&P 500 trading at 6800, one contract has a notional value of $50 x 6800 = $340,000. We illustrate this below using initial margin and day margins examples.
Leverage using Initial Margin:
Leverage = Notional Value / Initial margin required
Example:
For 1 Long ES contract, with initial margin $23429.
Leverage = 340,000 /23429
Leverage = 14.5x
Leverage using Day Trading Margin:
Leverage = Notional Value / Day margin required
For 1 Long ES contract, with day margin at $1000.
Leverage = 340,000/1000
Leverage = 340x
**As the notional value rises or falls, so does leverage. Leverage is a double-edged sword it can work for you and against you. Higher leverage increases the risk of gains as well as losses.
Depending on your margin, you might only need a few thousand dollars to take that trade. While this enhances your buying power, it also increases risk, as losses could exceed your initial deposit.
Mark-to-Market & Daily Settlements
Futures are marked to market daily. This means your P&L is updated at the end of each session based on the day’s closing price. Gains are credited to your account, and losses are debited, helping to ensure real-time risk management and capital adequacy.
Physical vs. Cash Settlement
When a contract expires, there are two possible outcomes:
Physical Delivery: You receive or deliver the actual commodity.
Example: An oil producer secures a price of $62.00 per barrel through a long futures position. At contract expiration, the producer is obligated to take delivery of 1,000 barrels, which represents $62,000 in total value. If market prices rise to $80.00 per barrel, the producer can sell the physical oil at an $18.00 per barrel gain (before accounting for commissions and futures and other related fees).
Cash Settlement: No goods change hands, and your account is adjusted based on the final settlement price set by the exchange. This is common in financial contracts like the E-mini S&P 500 (ES).
Understanding margin and leverage is fundamental to trading futures effectively. These mechanics define how much risk you’re taking, how your capital is allocated, and how your account is managed daily.
At EdgeClear, our mission is to help traders develop a deeper understanding of the markets and the tools that move them. Follow us on TradingView for more Trade Ideas like this one, or connect with our team to learn how you can trade futures with confidence, precision, and the right guidance.
Generals Charge, Soldiers Stall: Reading Bearish Divergence1. Context: The Battle Line Between Large and Small Caps
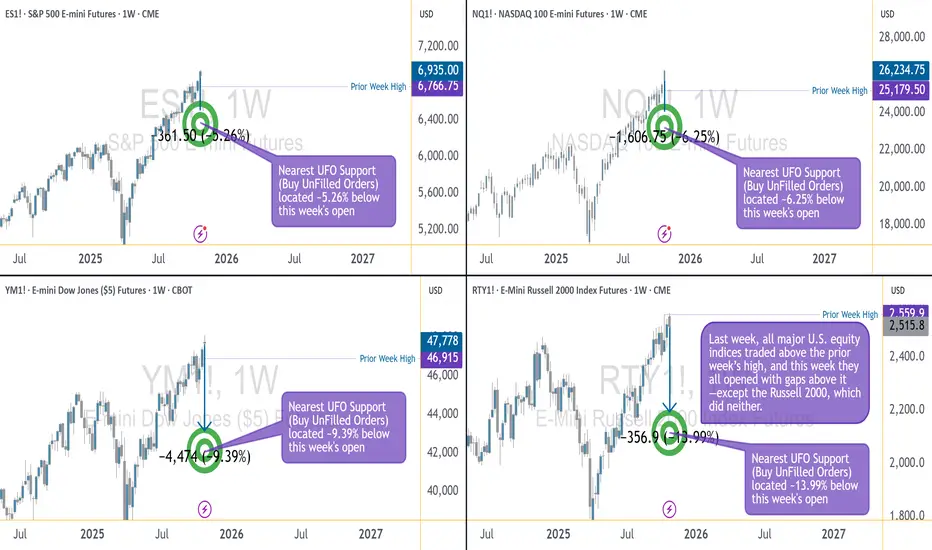
This week’s futures landscape paints a striking contrast between leadership and hesitation. In the CME equity index universe, the large caps — ES (E-mini S&P 500), NQ (E-mini NASDAQ 100), and YM (E-mini Dow Jones) — advanced as a united front, all opening above their prior week’s highs. The market generals were charging confidently uphill.
Yet, on the same battlefield, the RTY (E-mini Russell 2000) lagged behind. The small caps failed to take out the prior week’s high and opened below the aggressive gaps that marked their larger counterparts. In trader terms, breadth was narrowing. In storyteller terms, the generals were calling “forward!” — but the soldiers weren’t following.
Such divergences in participation often mark transition zones in market psychology. When large caps push while small caps stall, it doesn’t necessarily mean the campaign is lost — but it does mean confidence among the broader troops is weakening.
2. Reading the Divergence: When Breadth Narrows
The relationship between large-cap and small-cap indices often reveals more than just price action — it exposes the structure of conviction. In sustained bullish environments, small caps tend to lead or at least confirm the move. Their participation signals that risk appetite is healthy across the field, not confined to the biggest names.
When that breadth fades, the advance becomes fragile. A rally driven only by mega-cap components (the generals) can stretch further, but with decreasing participation, it becomes increasingly vulnerable to shocks. Traders who watch intermarket behavior know this phenomenon as bearish divergence — higher highs in the generals, lower or flat highs in the soldiers.
From a practical standpoint, narrowing breadth implies that fewer sectors are carrying the index higher. In other words, the market’s engine is running on fewer cylinders. This is not a timing trigger on its own, but it is a powerful contextual clue suggesting that volatility could expand when the leadership stumbles.
3. Quantifying the Risk: Supports and Market Depth
Looking beneath price, Order Flow (UnFilled Orders) provides a sense of where liquidity may reside once the current rally pauses. Key UFO support zones, acting as potential demand clusters, reveal how far the market might travel before encountering fresh buy interest.
From this week’s open:
ES shows its next support roughly 5.26% below current levels.
NQ sits around 6.25% below.
YM’s cushion lies approximately 9.39% beneath.
RTY, however, faces a much deeper air pocket — the next notable UFO support sits nearly 13.99% lower.
This asymmetry is critical. If markets retreat, small caps have the most unprotected downside terrain before reaching meaningful support. In other words, the generals may fall back a few miles, but the soldiers could tumble down the hill.
These percentages don’t guarantee a move — they outline the potential amplitude of correction if risk-off flows accelerate. The deeper the distance to support, the larger the volatility zone beneath.
4. Strategic View: Large Caps Lead, but Are They Overextended?
The current setup puts traders in a classic tactical dilemma:
Are the generals inspiring a new advance, or are they overextended and exposed?
Two plausible scenarios emerge:
Continuation scenario: If the small caps (RTY) regain strength and take out their prior week’s high, the breadth gap could close. This would validate the generals’ move and reestablish a broad-based advance.
Correction scenario: If RTY continues to stall while ES, NQ, and YM fail to sustain their gaps, it would confirm a divergence-led weakening. A close back below prior week’s highs could trigger a retreat toward the support zones identified earlier.
The idea is not to predict a reversal, but to prepare a framework in case weakness unfolds.
5. Contract Overview: E-mini and Micro Versions
To analyze or engage these markets, traders can study both E-mini and Micro E-mini contracts listed on the CME. These contracts represent standardized ways to participate in U.S. equity index movements, but at different notional sizes.
E-mini contracts (ES, NQ, YM, RTY) are the long-standing institutional benchmark instruments that track major U.S. equity indices with efficient liquidity and tight spreads.
Micro E-mini contracts (MES, MNQ, MYM, M2K) provide the same exposure pattern at one-tenth the size, offering more granularity in risk management and flexibility for smaller accounts or precise hedging.
It’s important to understand that these futures allow directional and hedging applications without requiring ownership of the underlying equities. However, as with any leveraged product, margin requirements can amplify both gains and losses. Traders should familiarize themselves with margin-to-equity ratios and maintenance requirements before participation.
S&P 500 – ES / MES
Minimum tick: 0.25 points
Tick value: $12.50 (E-mini) | $1.25 (Micro)
Typical margin: ≈ $21K (E-mini) | ≈ $2.1K (Micro)
NASDAQ 100 – NQ / MNQ
Minimum tick: 0.25 points
Tick value: $5.00 (E-mini) | $0.50 (Micro)
Typical margin: ≈ $30K (E-mini) | ≈ $3.0K (Micro)
Dow Jones – YM / MYM
Minimum tick: 1 point
Tick value: $5.00 (E-mini) | $0.50 (Micro)
Typical margin: ≈ $13K (E-mini) | ≈ $1.3K (Micro)
Russell 2000 – RTY / M2K
Minimum tick: 0.10 points
Tick value: $5.00 (E-mini) | $0.50 (Micro)
Typical margin: ≈ $9K (E-mini) | ≈ $0.9K (Micro)
Please note that all margin requirements are approximate and may be adjusted.
6. Risk Management Spotlight
Breadth divergences can test patience and positioning discipline. Managing exposure becomes as important as analyzing the signal itself.
Here are three core reminders:
Position Sizing: Adjust to volatility. If the distance to the nearest support is wide, scale down accordingly to maintain a consistent risk percentage per trade.
Stop-Loss Discipline: Predetermine exit points based on technical invalidation, not emotion.
Capital Preservation: Capital is ammunition; running out of it limits participation when true opportunity returns.
In the end, risk management isn’t about avoiding loss; it’s about surviving long enough to thrive when clarity returns. When markets are divided between generals and soldiers, maintaining balance becomes a trader’s greatest edge.
7. Educational Takeaway
The “generals vs. soldiers” analogy reminds us that market structure is not just about price—it’s about participation. When large caps surge but small caps lag, it signals a potential exhaustion point in the broader advance. The healthiest rallies are those in which all troops move in sync.
For traders and investors, breadth divergences serve as an early-warning system, not a countdown clock. They encourage a review of exposure, tighter stop placement, and a shift toward risk-awareness rather than return-chasing.
At this stage, the technical setup across U.S. index futures reads like a fragile truce: ES, NQ, and YM maintain their gains above prior-week highs, while RTY still lingers below. Should the soldiers eventually follow, confidence could rebuild. But if the generals start retreating first, the path toward their UFO supports could unfold quickly.
The core takeaway: breadth divergences don’t predict timing—they illuminate imbalance. Recognizing that imbalance early allows traders to respond intelligently instead of react emotionally when volatility expands.
When charting futures, the data provided could be delayed. Traders working with the ticker symbols discussed in this idea may prefer to use CME Group real-time data plan on TradingView: www.tradingview.com - This consideration is particularly important for shorter-term traders, whereas it may be less critical for those focused on longer-term trading strategies.
General Disclaimer:
The trade ideas presented herein are solely for illustrative purposes forming a part of a case study intended to demonstrate key principles in risk management within the context of the specific market scenarios discussed. These ideas are not to be interpreted as investment recommendations or financial advice. They do not endorse or promote any specific trading strategies, financial products, or services. The information provided is based on data believed to be reliable; however, its accuracy or completeness cannot be guaranteed. Trading in financial markets involves risks, including the potential loss of principal. Each individual should conduct their own research and consult with professional financial advisors before making any investment decisions. The author or publisher of this content bears no responsibility for any actions taken based on the information provided or for any resultant financial or other losses.

Analyzing the Upcoming Trading Week, FOMC Interest Rate DecisionCBOT_MINI:YM1!
FOMC interest rate decision on Wednesday.
Trading plan for tomorrow.
Emphasis on moving stop to breakeven on future trades.
Predictions post-fed.

ES (SPX, SPY) - Week-Ahead Analysis, Levels Oct 27th - 31stBig picture (D/4H/1H )
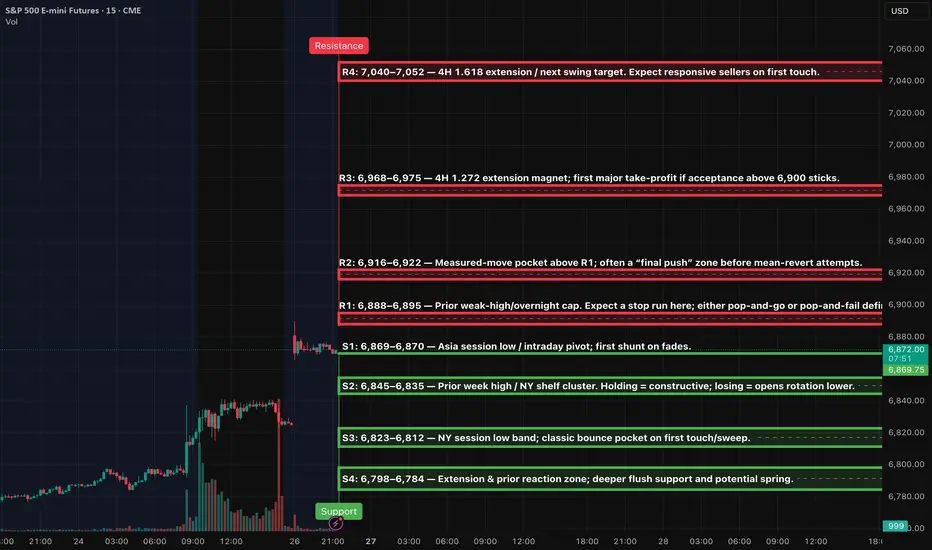
Price is pressing a thin ceiling at 6,875–6,895. With ES at ATHs, the next upside extension targets sit at 6,968 → 7,044 → 7,128 on 4H. HTF trend is up, but intraday is stretched and vulnerable to a sweep-and-revert before any fresh leg.
Setups (Level-KZ Protocol 15/5/1)
1) Rejection Fade at R1 (Tier-1 A++):
Look for a sweep above 6,888–6,895, then a 15m close back inside the band → 5m re-close under ~6,885 → take the first 1m pullback that stalls below.
Entry: 6,886–6,892 on the retest from beneath
SL: above the sweep wick (15m anchor)
TP1: 6,845–6,835 (S2); TP2: 6,823–6,812 (S3); TP3: 6,798–6,784 (S4)
Viability check: TP1 ≥ ~2R vs 15m-wick SL. At TP1 close 70%, set 30% runner to BE; no trailing before TP2.
2) Acceptance Continuation above R1 (Tier-1 A++):
If 15m full-body closes ≥6,895, treat that as acceptance. 5m pullback holds 6,892–6,895 → buy the 1m HL.
Entry: 6,893–6,898 hold
SL: below 6,885 (15m wick anchor)
TP1: 6,968–6,975 (R3); TP2: 7,040–7,052 (R4)
Invalidation: 15m body back below 6,885.
3) Quick-Reclaim Bounce at S2 (Tier-2 A+):
Fast flush into 6,845–6,835, tag/sweep, then immediate 1m reclaim with a 5m re-close back above ~6,840.
Entry: on the reclaim/pullback that holds 6,838–6,842
SL: under 6,832 (15m wick)
TP1: 6,888–6,895 (R1); TP2: 6,916–6,922 (R2)
4) Exhaustion Flush Bounce at S4 (Tier-3 A):
If selling extends to 6,798–6,784 with momentum divergence/absorption, buy the first 1m reclaim that converts 6,792–6,796 into a floor.
SL: under 6,780 (15m wick)
TP1: 6,823–6,812 (S3); TP2: 6,845–6,835 (S2); optional TP3 6,888–6,895 (R1)
Week-ahead catalysts to watch (plan risk around these)
• Tue: Conference Board Consumer Confidence 10:00 ET.
• Wed (AMC): MSFT earnings.
• Thu 08:30 ET: US Q3 GDP (Advance); Thu (AMC): AAPL and AMZN earnings.
• Fri 08:30 ET: Personal Income & Outlays (incl. PCE); Fri 09:45 ET: Chicago PMI.
Expect headline-driven jolts around 08:30 ET Thu/Fri and at the big tech calls after the bell.
Understanding the Foundation of Global MarketsFutures contracts are everywhere, from crude oil and stock indices to interest rates and even Bitcoin. They’re essential tools for traders and institutions to manage risk or capitalize on price speculation.
What Are Futures?
A futures contract is a legally binding agreement to buy or sell an asset at a set price on a future date. These contracts can involve commodities, currencies, or financial instruments.
Why Trade Futures?
Futures serve two core purposes
Hedging: Used by businesses to protect against adverse price moves. Example: A Corn farmer locks in $4.00 per bushel using a short futures position. If the price drops, they’re protected by gains in the contract. Conversely, if the price rises, the farmer should theoretically be able to sell the physical product at a higher amount.
Speculation: Speculators are a very important piece to market stability and liquidity. Many traders use futures to attempt to profit from market direction, in other words speculate on market moves. For instance, if a trader buys an E-mini S&P 500 contract at 6500 and it rises to 6550, they profit*. But losses can occur just as quickly if the market moves against the position.
*Always account for fees and commissions when evaluating performance."
Types of Futures Contracts
Commodity Futures — Crude oil, soybeans, gold.
Financial Futures — S&P 500, interest rates, Treasury bonds.
Currency Futures — Euro, Yen, and other FX contracts.
Cryptocurrency Products — Bitcoin, Etherum, Solana.
Key Takeaway
Whether you’re hedging or speculating, futures are dynamic and powerful tools. But they also carry significant risk. The first step is understanding what you're trading and why.
At EdgeClear, we’re here to help you trade with confidence. If you’re new or want to enhance your strategy, follow us on TradingView to learn more about Futures and read our latest Trade Ideas.
CME_MINI:ES1! CME_MINI:NQ1! COMEX:GC1! NYMEX:CL1! CME:BTC1!

Bullish continuation for NASDAQ?
📊 CME_MINI:NQZ2025 Analysis – Oct 18, 2025
🧠 Market Context:
Price recovered back into Premium of range (the upper part of the current weekly range) after the drop to 24,158. Creating an inside week that managed to provide a Bullish close.
Inside Week consolidated in an 1H frame.
Price currently upper band (Premium) of 1H consolidation.
Trapped Sellers at discount of 1H range which happens to be previous week Opening
Gap High area.
Lack of US scheduled Red Folder news until Friday morning.
8:30am
📕 Core CPI m/m
📕 Weekly wick 50% at 25196
📕 CPI y/y
9:45am
📕 Flash Manufacturing PMI
📕 Flash Services PMI
Price referencing areas between 25,050–25,210. Premium of a weekly range.
🔼 There are several thing to note here:
🎯 Daily wick 50% at 25121.75
🎯 Weekly wick 50% at 25196
🎯 A Daily REQ Close and Open ( Origin of Weekly Short) at 25354.00
🎯 And REQ (Relative Equal) Highs and ATHs (All Time Highs) at 25394.00
Price can continue to explore Premium of weekly range using these as targets but keep in mind the potential for weakness and reversal formations along these levels.
High timeframe bias as well as structure still Bullish, keeping in mind that Price is currently within a Bearish Range (Friday October 10, 2025) Mondays PA and range might clarify wether Bias will remain Bullish, or if there will be any more signs of weakness and reversal formations.
🔻 There are several thing to note on the short side here:
🙁 Trapped Sellers ( Passive Liquidity) at discount of 1H Range and accumulation or Lower Band.
📉 Week Opening Gap (Reference partially) at discount of bigger range
📉 Weekly Low at 24410.00
📉 Previous Weekly Low at 24158.50
🧩 Context: Still questioning whether Fridays drop could be labeled as Price displacement and considered signal, or Rebalance. The difference will be noticed Mon-Tues.
Still uncertain on 💲 Dollar TVC:DXY Pending Bullish continuation confirmation or reversal back into chop.

ES (SPX, SPY) Analysis, Key Levels, Setups for Fri (Oct 24)ES Two-Way Plan (A++) — Level-KZ 15/5/1
Calendar (ET) — Fri Oct 24:
08:30 CPI (Sept).
09:45 S&P Global flash Manufacturing/Services PMIs.
10:00 Univ. of Michigan Consumer Sentiment (final).
14:00 Federal Reserve Board open meeting.
Expect compression into 08:30 → expansion on release; execute inside NY AM 09:30–11:00 and PM 13:30–16:00 only.
Bias & overnight→NY forecast:
Into CPI, lean range-bound 6,770–6,787. A clean hold above the “weak-high” pocket should squeeze toward the 1.272–1.618 extension band; failure back inside favors a drift to the breakout shelves below. Treat the first post-CPI impulse as discovery; take the next confirmed 15m/5m/1m sequence only.
Setups - Level-KZ execution (15m→5m→1m)
1) Short Rejection Fade @ 6,785–6,787 (W3): 15m rejection closes back inside → 5m re-close below ~6,783.5 with LH → enter first 1m pullback that stalls beneath the shelf.
SL: above the 15m rejection wick ±0.25–0.50.
TP1: 6,776–6,777. TP2: 6,759–6,762. TP3: 6,739–6,744.
2) Long Acceptance Continuation > 6,797 (W3): 15m full-body close above 6,797 → 5m pullback holds/re-closes → 1m HL entry.
SL: below the 15m trigger/pullback wick ±0.25–0.50.
TP1: 6,818 (1.618). TP2: 6,830–6,835.
3) Long Quick-Reclaim Bounce @ 6,759–6,762 (W2): fast flush into the shelf → instant reclaim (15m wick, 5m re-close back above) → 1m HL entry.
SL: below the 15m flush wick ±0.25–0.50.
TP1: 6,776–6,777. TP2: 6,785–6,787.
4) Short Acceptance Breakdown < 6,759 (W2): 15m body-through below 6,759 → 5m confirms → 1m LH entry.
SL: above 15m trigger wick ±0.25–0.50.
TP1: 6,739–6,744. TP2: 6,720–6,725.

Recap of MYM Intraday Short & Strategy Moving ForwardReviewed my CBOT_MINI:MYM1! trade.
Used stop-order strategy.
Only risking 10% max.

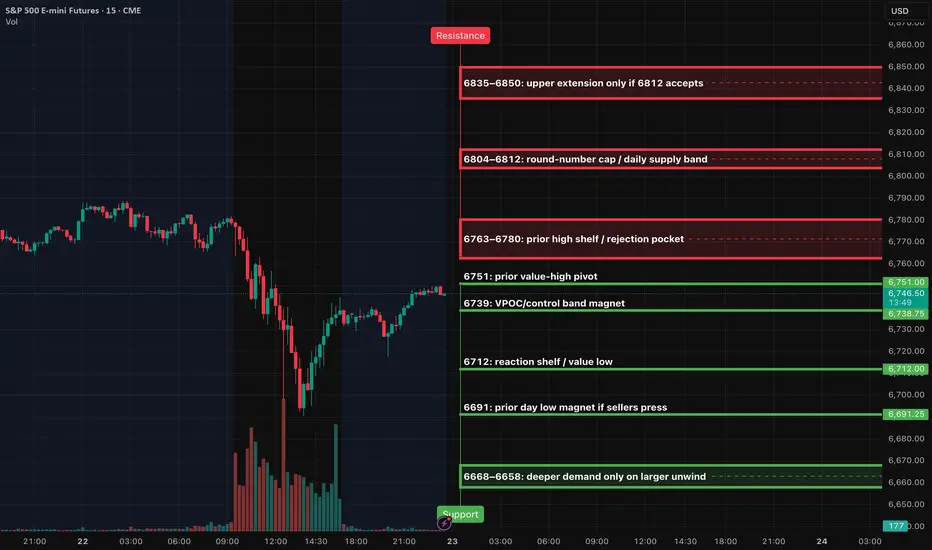
ES (SPX, SPY) Analysis, Key Levels, Setups for Thur (Oct 23)Bias: The market shows a neutral to slightly bullish outlook as long as prices remain above the 6739–6751 control band. A decisive break and sustained trading above 6780 would indicate a shift in momentum to the upside, targeting the levels of 6804 to 6812. Conversely, if we lose support at 6739, we could see a decline toward 6712, with 6691 serving as a key level that may attract selling pressure.
Execution windows: London 02:00–05:00 optional small size. NY AM 09:30–11:00 primary. NY PM 13:30–16:00 primary. Midday is manage-only; avoid initiating.
Setups
Short pop-and-fail at 6773–6780
– Trigger: 15m rejection back inside the band → 5m re-close below ~6773 → first 1m pullback stalls beneath 6773
– Entry: sell the pullback beneath 6773
– Stop: hard SL above the 15m rejection wick by 0.25–0.50
– Targets: TP1 6751, TP2 6739, TP3 6712
– Invalidation: 6780 converts to support on a full-body 15m close
Long breakout continuation above 6780
– Trigger: 15m full-body close beyond 6780 → 5m pullback holds 6777–6780 and re-closes up → 1m higher-low entry
– Entry: buy the hold at 6777–6780
– Stop: hard SL below the 15m trigger wick by 0.25–0.50
– Targets: TP1 6804, TP2 6812, TP3 6835–6850
Long sweep-and-reclaim at 6712 → 6691
– Trigger: quick sweep of 6712 (or flush toward 6691) that immediately reclaims 6712 on 5m → 1m higher-low entry
– Entry: buy first pullback after the reclaim of 6712
– Stop: hard SL below the 15m sweep wick by 0.25–0.50
– Targets: TP1 6739, TP2 6751, TP3 6773–6780
BTC - Prepare for Wick to 35,000Here I display the long stop loss orders contained in order blocks below price.
These leveraged sell orders only fulfill when price crosses over the level, leaving a chain reaction or sell orders in the chart already - ready to trigger off one into the next.
This mechanic within crypto is what created wicks. I’m showing you here that they can be predicted and traded.
Prepare for this to happen anytime now.
- DD

Breakout or Fake-Out — Corn’s Price Action Under the Microscope1. When Breakouts Lie
Few things in trading are more exciting than a clean breakout. But for every breakout that soars, there’s another that fakes out and traps eager traders.
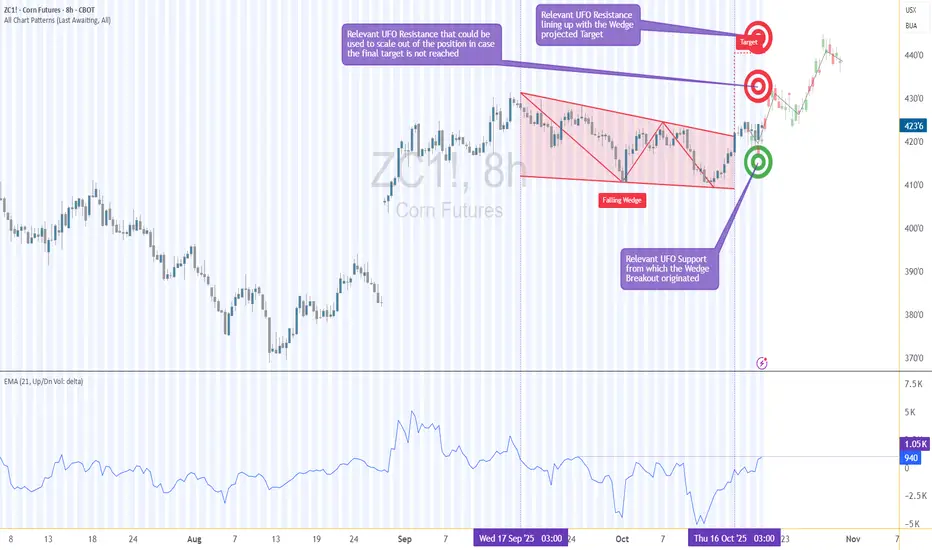
Corn Futures (ZC) on the 8-hour chart just gave us that classic test — a breakout from a falling wedge that has traders asking: Is this the real thing, or another false alarm?
The pattern looks textbook. Price compressed lower within a wedge and broke above its upper trendline. However, the true strength of any breakout lies not in the pattern itself, but in the story told by volume and order flow. That’s what we’ll unpack in this article — using ZC (Corn Futures) and MZC (Micro Corn Futures) as our guide.
2. The Falling Wedge in Focus
Falling wedges often represent market exhaustion, where selling pressure slows and buyers quietly begin to accumulate positions. On the Corn Futures 8-hour chart, price has indeed pushed beyond the wedge’s descending resistance line — the visual signal that usually excites breakout traders.
But structure alone doesn’t make a sustainable move. Beneath the surface, the UFO support and resistance levels — zones of UnFilled Orders — provide the invisible scaffolding that can support or reject price movement.
In this case:
Support Zone: 418–411
Resistance Levels: 430 and 442
These areas represent pending potential new support and resistance areas where buy and sell orders that can act as launchpads or barriers. The key is to see how the market interacts with them while volume builds or fades.
3. The Volume Delta Story
Here’s where things get interesting.
Volume Delta — the difference between buy and sell volume — shows us who’s winning the tug-of-war between buyers and sellers.
During the wedge formation, the maximum delta reached +1.05K, indicating meaningful buying activity despite the downtrend. But as the breakout unfolded, delta turned slightly negative. In plain terms, fewer new buyers are stepping in — and without new buying energy, breakouts often lose traction.
That’s a classic setup for a potential fake-out: price pokes above the wedge, but order flow doesn’t confirm. This mismatch between technical breakout and volume delta is often the canary in the coal mine for fading momentum.
4. The Trade Logic — Let the Market Come to You
Instead of chasing the breakout, the smarter play here could be to wait for the market to revisit demand/support.
Why? Because that’s where new volume tends to enter — where pending buy orders (the UFOs) become filled, strengthening the delta and giving the move fresh fuel.
A potential plan might look like this:
Entry: 418 (within support)
Stop-Loss: 411 (below the zone)
Target 1: 430 (first resistance, partial exit)
Target 2: 442 (final resistance, full exit)
This setup maintains a clear reward-to-risk ratio above 3:1, assuming disciplined execution and volatility-adjusted sizing. It’s not about prediction — it’s about preparation. Waiting for retracement allows participation in a confirmed move, rather than reacting to emotional excitement at the breakout.
5. Contract Specifications & Margin Requirements
Understanding your instrument is as important as reading your chart.
Here’s what traders should know about these CME-listed Corn contracts:
ZC – Corn Futures (Standard Contract)
Contract Size: 5,000 bushels
Tick Size: ¼ cent per bushel (0.0025) → Tick Value = $12.50
Approx. Margin: Around $1,000 USD, varying by broker and volatility
MZC – Micro Corn Futures
Contract Size: 500 bushels (1/10th of ZC)
Tick Size: ½ cent per bushel (0.0050) → Tick Value = $2.50
Approx. Margin: Around $100 USD, varying by broker and subject to market conditions
Micro contracts allow smaller-scale traders to apply the same analysis and structure as the full-size contract, but with controlled risk exposure — a major advantage for capital management.
6. When New Volume is Injected in the Market
Think of Volume Delta as a glance in the rear-view mirror — it tells us what’s already been filled. On the other hand, analyzing support and resistance levels with the idea of where new unfilled orders might come in helps us prepare to enter trades just before momentum potentially reactivates.
When both are combined:
Rising delta confirms a healthier follow-through on breakouts.
Negative delta near resistance warns of a likely fading move.
Key support and resistance zones show where resting orders could inject new volume.
7. Risk Management — Protect Before You Project
Every solid trade plan starts with a stop.
For this setup, a logical stop below 411 ensures protection if the wedge breakout fails completely.
Scaling out at 430 reduces exposure early, locking gains in case the move stalls.
Always size positions relative to account equity and volatility — the most underrated edge in trading is survival.
The best traders don’t just hunt profits — they hunt consistency. Managing risk transforms a potentially stressful market environment into a structured decision process.
8. CME Context & Final Thoughts
Both ZC and MZC are cornerstone agricultural contracts traded on the CME Group’s CBOT exchange, giving traders exposure to one of the world’s most economically significant commodities.
While the setup we’ve explored is a case study, the takeaway extends beyond Corn:
Breakouts need participation. Volume confirms conviction. Key support and resistance levels reveal intention.
In markets where fake-outs are common, aligning technical structure, order flow, and patient trade planning gives traders the clearest edge of all — confidence grounded in data, not emotion.
When charting futures, the data provided could be delayed. Traders working with the ticker symbols discussed in this idea may prefer to use CME Group real-time data plan on TradingView: www.tradingview.com - This consideration is particularly important for shorter-term traders, whereas it may be less critical for those focused on longer-term trading strategies.
General Disclaimer:
The trade ideas presented herein are solely for illustrative purposes forming a part of a case study intended to demonstrate key principles in risk management within the context of the specific market scenarios discussed. These ideas are not to be interpreted as investment recommendations or financial advice. They do not endorse or promote any specific trading strategies, financial products, or services. The information provided is based on data believed to be reliable; however, its accuracy or completeness cannot be guaranteed. Trading in financial markets involves risks, including the potential loss of principal. Each individual should conduct their own research and consult with professional financial advisors before making any investment decisions. The author or publisher of this content bears no responsibility for any actions taken based on the information provided or for any resultant financial or other losses.
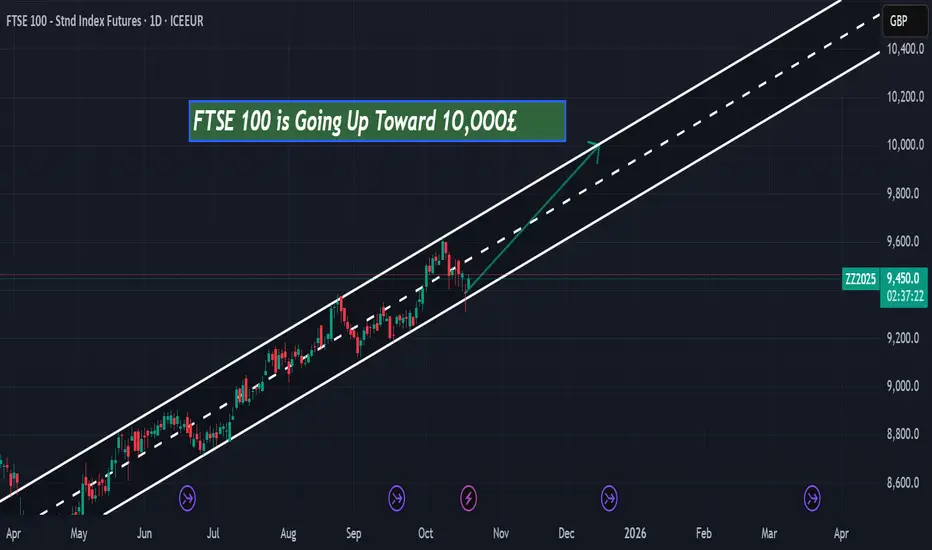
FTSE 100 Outlook: Is the Index on Track to Reach £10,000 by the According to my technical analysis, the FTSE 100 has been moving within a well-defined bullish channel since April 2025. The price structure continues to show higher highs and higher lows, confirming sustained buying pressure and a strong uptrend.
As long as the index remains within this rising channel, the bullish momentum is likely to persist toward the £10,000 level. Based on the current trajectory, this target could be reached in the coming months or by the end of 2025.
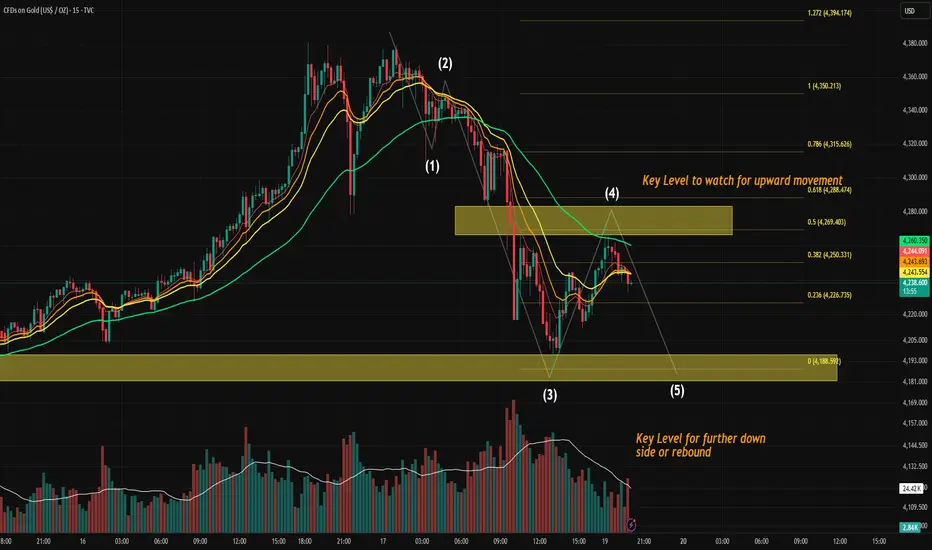
Elliott Wave Analysis: Gold Near Potential Wave 5 Reversal PointGold Price Action Analysis - Potential Wave 5 Setup (sub waves within Wave A going down)
Wave Structure Overview
The current structure on the 15-minute chart appears to be unfolding in a classic 5-wave impulsive sequence:
Wave (1) — Initial sell-off following local top formation.
Wave (2) — Sharp retracement, testing previous supply, rejected at previous premarket range high (Friday US Stocks premarket high)
Wave (3) — Strong impulsive move down with expanding volume, typical of a wave 3 extension.
It respected one of our previous opening range high (lower yellow level).
Wave (4) — Counter-trend rally into a prior supply block / zone, showing hesitation and rejection. (we are likely done, since it had retraced to 0.5 Fib of Wave 3), i am not ruling out where we may have one more small wave up before we get into the real wave (5).
Wave (5) — Still developing, assuming wave (4) is done, we are likely to push into the lower yellow demand zone, where either continuation or a significant rebound may occur.
One scenario that can happen is that we double bottom where wave 5 meet end of wave 3, and we start a corrective wave up which is a potential Wave B going up.
🟧 Key Levels to Watch
Upper Zone (around 4271–4290)
This zone aligns with the ORH level and prior Wave (4) rejection area.
➝ If broken with strong momentum, it can invalidate the immediate bearish Wave 5 scenario and hint at a deeper retracement or new bullish structure.
Lower Zone (around 4198–4181)
This is a strong demand zone, confluence with Wave (3) extension targets and potential end of Wave (5).
➝ Price reaction here is crucial: either we see a clean 5-wave completion and rebound, or further downside acceleration.
📊 Momentum Confirmation (MACD)
The MACD shows a decelerating bearish momentum going into Wave (5), which fits the classic pattern where Wave 3 has the strongest momentum and Wave 5 often shows divergence or a weaker push.
If MACD prints a higher low while price makes a lower low, that would confirm bullish divergence, a common reversal signal after an impulse.
📝 Trading Implications
Scenario A — Bounce at Demand Zone:
Look for reversal signals or bullish divergence near 4180–4198 to confirm the end of Wave (5). Potential short-covering rally could take us close to 4300
Scenario B — Breakdown Below Demand Zone:
A clean break and close below 4180 may open the door to extended bearish continuation — likely a larger degree correction or Wave C structure.
Invalidation:
A move and acceptance above the upper ORH zone would invalidate this short-term bearish count.
Final Thoughts
This setup is technically clean:
Clear Elliott structure
Key liquidity zones mapped
Momentum oscillator in sync with price action
⚠️ But remember, Wave 5s can truncate or extend, so flexibility is key. Watch how price behaves at the lower yellow zone — that’s where the next big move could be born.
Wait for price to SHOW ME WHERE TO MAKE MONEY!Hey Squad,
Im going to keep this short and sweet but I want you to PEEP......lol the possible setups that are coming. This week we can not tell exactly what to look for since the market is giving us opposing call outs. For example, The Weekly looks like a double top has formed showing bears/selling favor but the 4/8h shows respecting of a low and shows the forming of a double bottom!
so what does this mean? We are waiting for price to show us who to follow!! But if you were to ask me....I believe the USD will suffer this week due to shutdown and uncertainty so I believe we will be trending low! Good for gold and silver traders and those that see weakness in the $!
If we can break below the 1.163 area and hold I think its clear we are moving down until we hit a high time frame FVG.
Tell me your thoughts and comments on this Analysis!
and like always! Gd look out there and TAKE PROFIT!

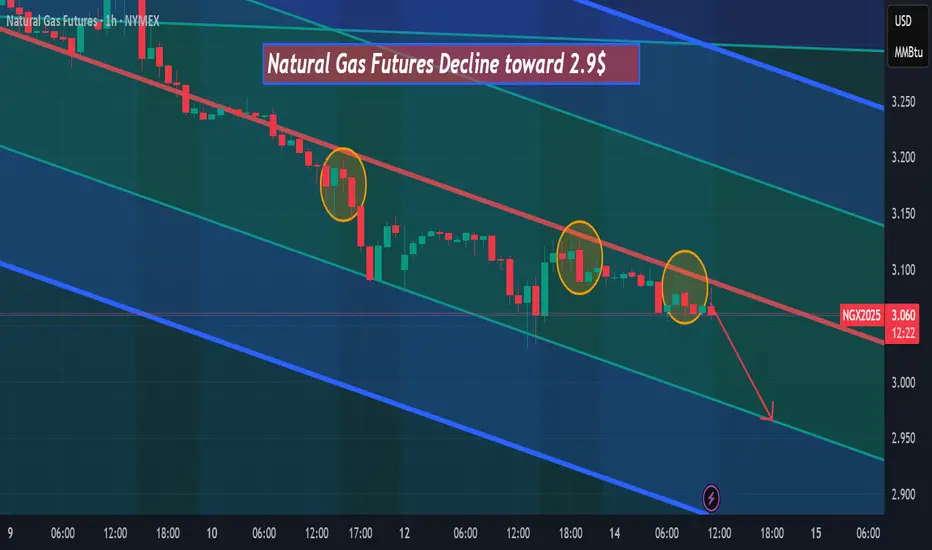
Natural gas futures are declining toward $2.90 Natural gas futures are declining toward $2.90 after three pullbacks on the bearish red trendline, according to my analysis on the 1-hour timeframe.
Sellers continue to dominate after the recent failure to hold above the bearish red trendline, increasing the probability of a move toward the $2.90 support zone
ETH - Ascending Channel Breakdown - Short the WickETH has broken down this large ascending parallel channel.
Expecting a wick down to the uber low levels coinciding with Bitcoin.
Short Entry - 4,000 to 4,020
Stop Loss - 4,300
Target 1 - 3,370
Target 2 - 2,540
Target 3 - 1,645
Target 4 - 200
- DD

Difference Between Forward and Futures Forex Markets1. Definition and Basic Concept
Forward Market:
A forward forex contract is a private agreement between two parties to buy or sell a specific amount of a currency at a predetermined rate on a future date. It is a customizable contract where the terms—such as amount, delivery date, and exchange rate—are negotiated directly between the buyer and the seller.
Futures Market:
A futures forex contract, on the other hand, is a standardized agreement traded on an organized exchange (such as the Chicago Mercantile Exchange - CME) to buy or sell a currency at a set price on a specific future date. Futures contracts are governed by exchange rules and are not negotiable between individuals.
Example:
If an Indian importer knows they must pay $1 million in three months, they can lock in today’s rate with a forward contract negotiated with their bank. Alternatively, they could use a futures contract on the exchange to hedge the same exposure, but under standardized terms.
2. Trading Venue and Regulation
Forward Market:
The forward forex market is Over-the-Counter (OTC), meaning trades occur directly between parties—usually through banks, brokers, or large financial institutions. It is unregulated compared to futures markets, giving flexibility but also introducing counterparty risk.
Futures Market:
Futures contracts are traded on regulated exchanges, ensuring transparency, standardized contract sizes, and proper oversight by authorities such as the Commodity Futures Trading Commission (CFTC) in the U.S. This makes the futures market more secure and trustworthy for investors.
Key Difference:
OTC forward markets offer privacy and customization, whereas futures markets emphasize standardization, regulation, and transparency.
3. Contract Customization
Forward Market:
Forward contracts are fully customizable. Parties can decide the exact amount, currency pair, settlement date, and method of delivery. This flexibility suits businesses and institutions with specific hedging needs.
Futures Market:
Futures contracts are standardized in terms of contract size, maturity dates (e.g., March, June, September, December), and settlement procedures. Traders must accept these fixed terms, which can limit flexibility but make trading easier for speculative purposes.
Example:
A company wanting to hedge €2.5 million in three months can easily set that amount in a forward contract. In contrast, a futures contract might have a fixed lot size (say, €125,000 per contract), so the company would need to trade multiple contracts to approximate the desired amount.
4. Settlement and Delivery
Forward Market:
Settlement occurs on the agreed future date, and most forward contracts end in actual delivery of the currencies. However, some may be settled in cash based on the difference between the agreed rate and the spot rate at maturity.
Futures Market:
Most futures contracts are cash-settled before expiry, as traders often close their positions before the delivery date. Only a small percentage result in physical delivery of the currencies.
Key Point:
Forwards typically end with physical delivery, while futures are mainly used for speculation and hedging without actual currency exchange.
5. Counterparty Risk
Forward Market:
Since forwards are private agreements, there is a high counterparty risk—the possibility that one party may default on the contract. There is no intermediary guaranteeing the trade.
Futures Market:
Futures contracts eliminate counterparty risk because the exchange clearing house acts as the intermediary, guaranteeing that both sides meet their obligations. Traders must maintain margin accounts to manage default risk.
Result:
Futures offer greater security due to exchange-backed settlement mechanisms.
6. Mark-to-Market and Margin Requirements
Forward Market:
Forward contracts are not marked to market, meaning profits or losses are realized only at the contract’s maturity. No margin or daily settlement is required.
Futures Market:
Futures contracts are marked to market daily, meaning gains and losses are settled every trading day. Traders must maintain margin accounts (initial and maintenance margins) to cover potential losses, ensuring market integrity.
Example:
If the exchange rate moves unfavorably in a futures position, the trader must deposit additional funds to maintain their margin. In forwards, the loss or gain is realized only at the end.
7. Liquidity and Market Participants
Forward Market:
Liquidity in forwards depends on the specific currency pair and the parties involved. It’s dominated by banks, multinational corporations, and institutional investors seeking to hedge specific exposures.
Futures Market:
The futures market is highly liquid due to standardized contracts and participation from a wide range of players—hedgers, speculators, and institutional traders. Continuous trading ensures tight spreads and efficient pricing.
In summary:
Forwards serve mainly for hedging; futures attract both hedgers and speculators due to liquidity and transparency.
8. Purpose and Usage
Forward Market:
Primarily used for hedging long-term exposures. Forwards protect against adverse currency movements for future transactions like exports, imports, or loans in foreign currencies.
Futures Market:
Used for both hedging and speculation. Hedge funds and traders use futures to profit from short-term price movements in currency pairs or to manage portfolio risk efficiently.
Example:
A corporate treasurer uses forwards to hedge a future payment, while a speculator might use futures to bet on the dollar strengthening against the euro.
9. Pricing and Cost Structure
Forward Market:
Forward prices are determined by the interest rate differential between the two currencies and the current spot rate. There are no exchange fees, but the pricing may include a bank’s spread or commission.
Futures Market:
Futures prices are also influenced by interest rate differentials but may deviate slightly from forward rates due to daily margin settlements and market expectations. Traders also pay exchange and brokerage fees.
Key Insight:
Forward pricing is customized and negotiated privately, while futures pricing is transparent and visible on exchanges.
10. Transparency and Accessibility
Forward Market:
Forward markets are less transparent, as prices and deals are not publicly available. Only large players like banks and corporations typically participate due to the high transaction size.
Futures Market:
Futures markets are highly transparent. Prices, trading volumes, and open interest data are publicly available in real time, enabling fair competition and analysis for all traders.
Final Comparison:
Transparency in futures ensures fairness and easier access for retail and institutional investors, while forwards remain largely institutional and relationship-based.
Conclusion
While both forward and futures forex markets allow participants to hedge or speculate on future currency movements, their structure, purpose, and participants differ greatly.
Forwards offer customization and flexibility but come with higher counterparty risk and limited liquidity.
Futures provide standardization, security, and transparency, making them ideal for speculative trading and risk management in a regulated environment.
In summary:
Aspect Forward Market Futures Market
Trading Venue OTC (Private) Exchange-Traded
Customization Fully customizable Standardized
Regulation Unregulated Regulated
Settlement On maturity Daily (mark-to-market)
Counterparty Risk High Minimal
Participants Corporates, Banks Traders, Investors
Transparency Low High
Liquidity Moderate High
Margin Requirement None Required
Usage Long-term hedging Hedging & speculation