GOLD Massive Long! BUY!
My dear friends,
My technical analysis for GOLD is below:
The market is trading on 4708.4 pivot level.
Bias - Bullish
Technical Indicators: Both Super Trend & Pivot HL indicate a highly probable Bullish continuation.
Target - 4829.8
Recommended Stop Loss - 4622.8
About Used Indicators:
A pivot point is a technical analysis indicator, or calculations, used to determine the overall trend of the market over different time frames.
Disclosure: I am part of Trade Nation's Influencer program and receive a monthly fee for using their TradingView charts in my analysis.
———————————
WISH YOU ALL LUCK
Fx

EURUSD Technical Analysis! BUY!
My dear followers,
I analysed this chart on EURUSD and concluded the following:
The market is trading on 1.1850 pivot level.
Bias - Bullish
Technical Indicators: Both Super Trend & Pivot HL indicate a highly probable Bullish continuation.
Target - 1.1935
About Used Indicators:
A super-trend indicator is plotted on either above or below the closing price to signal a buy or sell. The indicator changes color, based on whether or not you should be buying. If the super-trend indicator moves below the closing price, the indicator turns green, and it signals an entry point or points to buy.
Disclosure: I am part of Trade Nation's Influencer program and receive a monthly fee for using their TradingView charts in my analysis.
———————————
WISH YOU ALL LUCK

NATGAS Will Collapse! SELL!
My dear subscribers,
NATGAS looks like it will make a good move, and here are the details:
The market is trading on 4.416 pivot level.
Bias - Bearish
My Stop Loss - 4.568
Technical Indicators: Both Super Trend & Pivot HL indicate a highly probable Bearish continuation.
Target - 4.168
About Used Indicators:
The average true range (ATR) plays an important role in 'Supertrend' as the indicator uses ATR to calculate its value. The ATR indicator signals the degree of price volatility.
Disclosure: I am part of Trade Nation's Influencer program and receive a monthly fee for using their TradingView charts in my analysis.
———————————
WISH YOU ALL LUCK

BTCUSD Expected Growth! BUY!
My dear friends,
BTCUSD looks like it will make a good move, and here are the details:
The market is trading on 83868 pivot level.
Bias -Bullish
Technical Indicators: Supper Trend generates a clear long signal while Pivot Point HL is currently determining the overall Bullish trend of the market.
Goal - 86403
About Used Indicators:
Pivot points are a great way to identify areas of support and resistance, but they work best when combined with other kinds of technical analysis
Disclosure: I am part of Trade Nation's Influencer program and receive a monthly fee for using their TradingView charts in my analysis.
———————————
WISH YOU ALL LUCK

US100 On The Rise! BUY!
My dear followers,
This is my opinion on the US100 next move:
The asset is approaching an important pivot point 25520
Bias - Bullish
Safe Stop Loss - 25420
Technical Indicators: Supper Trend generates a clear long signal while Pivot Point HL is currently determining the overall Bullish trend of the market.
Goal - 25687
About Used Indicators:
For more efficient signals, super-trend is used in combination with other indicators like Pivot Points.
Disclosure: I am part of Trade Nation's Influencer program and receive a monthly fee for using their TradingView charts in my analysis.
———————————
WISH YOU ALL LUCK

APPLE The Target Is DOWN! SELL!
My dear subscribers,
This is my opinion on the APPLE next move:
The instrument tests an important psychological level 259.34
Bias - Bearish
Technical Indicators: Supper Trend gives a precise Bearish signal, while Pivot Point HL predicts price changes and potential reversals in the market.
Target - 254.61
About Used Indicators:
On the subsequent day, trading above the pivot point is thought to indicate ongoing bullish sentiment, while trading below the pivot point indicates bearish sentiment.
Disclosure: I am part of Trade Nation's Influencer program and receive a monthly fee for using their TradingView charts in my analysis.
———————————
WISH YOU ALL LUCK

QQQ Trading Opportunity! BUY!
My dear friends,
Please, find my technical outlook for QQQ below:
The instrument tests an important psychological level 621.70
Bias - Bullish
Technical Indicators: Supper Trend gives a precise Bullish signal, while Pivot Point HL predicts price changes and potential reversals in the market.
Target - 626.73
Recommended Stop Loss - 618.93
About Used Indicators:
Super-trend indicator is more useful in trending markets where there are clear uptrends and downtrends in price.
Disclosure: I am part of Trade Nation's Influencer program and receive a monthly fee for using their TradingView charts in my analysis.
———————————
WISH YOU ALL LUCK

SILVER What Next? BUY!
My dear subscribers,
This is my opinion on the SILVER next move:
The instrument tests an important psychological level 8500.4
Bias - Bullish
Technical Indicators: Supper Trend gives a precise Bullish signal, while Pivot Point HL predicts price changes and potential reversals in the market.
Target - 9562.0
About Used Indicators:
On the subsequent day, trading above the pivot point is thought to indicate ongoing bullish sentiment, while trading below the pivot point indicates bearish sentiment.
Disclosure: I am part of Trade Nation's Influencer program and receive a monthly fee for using their TradingView charts in my analysis.
———————————
WISH YOU ALL LUCK

CADJPY Massive Short! SELL!
My dear friends,
Please, find my technical outlook for CADJPY below:
The price is coiling around a solid key level - 113.78
Bias - Bearish
Technical Indicators: Pivot Points High anticipates a potential price reversal.
Super trend shows a clear sell, giving a perfect indicators' convergence.
Goal - 113.01
About Used Indicators:
The pivot point itself is simply the average of the high, low and closing prices from the previous trading day.
Disclosure: I am part of Trade Nation's Influencer program and receive a monthly fee for using their TradingView charts in my analysis.
———————————
WISH YOU ALL LUCK

USDJPY Under Pressure! SELL!
My dear followers,
I analysed this chart on USDJPY and concluded the following:
The market is trading on 154.22 pivot level.
Bias - Bearish
Technical Indicators: Both Super Trend & Pivot HL indicate a highly probable Bearish continuation.
Target - 153.74
Safe Stop Loss - 154.53
About Used Indicators:
A super-trend indicator is plotted on either above or below the closing price to signal a buy or sell. The indicator changes color, based on whether or not you should be buying. If the super-trend indicator moves below the closing price, the indicator turns green, and it signals an entry point or points to buy.
Disclosure: I am part of Trade Nation's Influencer program and receive a monthly fee for using their TradingView charts in my analysis.
———————————
WISH YOU ALL LUCK

GOLD My Opinion! BUY!
My dear friends,
GOLD looks like it will make a good move, and here are the details:
The market is trading on 5130.2 pivot level.
Bias - Bullish
Technical Indicators: Supper Trend generates a clear long signal while Pivot Point HL is currently determining the overall Bullish trend of the market.
Goal - 5240.1
Recommended Stop Loss - 5071.0
About Used Indicators:
Pivot points are a great way to identify areas of support and resistance, but they work best when combined with other kinds of technical analysis
Disclosure: I am part of Trade Nation's Influencer program and receive a monthly fee for using their TradingView charts in my analysis.
———————————
WISH YOU ALL LUCK

CHFJPY A Fall Expected! SELL!
My dear followers,
This is my opinion on the CHFJPY next move:
The asset is approaching an important pivot point 199.69
Bias - Bearish
Technical Indicators: Supper Trend generates a clear short signal while Pivot Point HL is currently determining the overall Bearish trend of the market.
Goal - 199.07
About Used Indicators:
For more efficient signals, super-trend is used in combination with other indicators like Pivot Points.
Disclosure: I am part of Trade Nation's Influencer program and receive a monthly fee for using their TradingView charts in my analysis.
———————————
WISH YOU ALL LUCK

EURCHF Set To Grow! BUY!
My dear subscribers,
This is my opinion on the EURCHF next move:
The instrument tests an important psychological level 0.9162
Bias - Bullish
Technical Indicators: Supper Trend gives a precise Bullish signal, while Pivot Point HL predicts price changes and potential reversals in the market.
Target - 0.9174
My Stop Loss - 0.9155
About Used Indicators:
On the subsequent day, trading above the pivot point is thought to indicate ongoing bullish sentiment, while trading below the pivot point indicates bearish sentiment.
Disclosure: I am part of Trade Nation's Influencer program and receive a monthly fee for using their TradingView charts in my analysis.
———————————
WISH YOU ALL LUCK

USD - The Oversold TestRSI on the daily chart of DXY got down to extreme levels earlier in the week with a Tuesday close below the 25-level. This would be the lowest value for the indicator since 2020 when, at the time, the Fed was pushing loose monetary policy to stimulate growth despite much of the globe still being shut down. That instance soon led to a significant low and that was followed by a roaring rally in 2021 and 2022 as the Fed finally reacted to inflation.
RSI is not a great timing indicator - but it can be fantastic context and that's what I'm taking this as currently. It doesn't mean automatic reversal but it does mean caution if chasing the trend lower.
As for drivers, I think it's obvious what would need to push to allow the sell-off to continue and that's continued unwind of the USD/JPY carry trade, which for the past two days has been stalled. Going into Friday the big question is whether we see another push of weakness in USD/JPY which can have an outsized impact in DXY and, in-turn, USD-pairs, even something like EUR/USD despite the fact that the Euro is a much larger component of the DXY basket. - js

NZDJPY Trading Opportunity! SELL!
My dear friends,
Please, find my technical outlook for NZDJPY below:
The instrument tests an important psychological level 93.106
Bias - Bearish
Technical Indicators: Supper Trend gives a precise Bearish signal, while Pivot Point HL predicts price changes and potential reversals in the market.
Target - 92.202
About Used Indicators:
Super-trend indicator is more useful in trending markets where there are clear uptrends and downtrends in price.
Disclosure: I am part of Trade Nation's Influencer program and receive a monthly fee for using their TradingView charts in my analysis.
———————————
WISH YOU ALL LUCK

GBPCAD Will Explode! BUY!
My dear friends,
Please, find my technical outlook for GBPCAD below:
The price is coiling around a solid key level - 1.8660
Bias - Bullish
Technical Indicators: Pivot Points High anticipates a potential price reversal.
Super trend shows a clear buy, giving a perfect indicators' convergence.
Goal - 1.8717
Safe Stop Loss - 1.8632
About Used Indicators:
The pivot point itself is simply the average of the high, low and closing prices from the previous trading day.
Disclosure: I am part of Trade Nation's Influencer program and receive a monthly fee for using their TradingView charts in my analysis.
———————————
WISH YOU ALL LUCK

GBPUSD What Next? SELL!
My dear subscribers,
My technical analysis for GBPUSD is below:
The price is coiling around a solid key level - 1.3781
Bias - Bearish
Technical Indicators: Pivot Points Low anticipates a potential price reversal.
Super trend shows a clear sell, giving a perfect indicators' convergence.
Goal - 1.3668
About Used Indicators:
By the very nature of the supertrend indicator, it offers firm support and resistance levels for traders to enter and exit trades. Additionally, it also provides signals for setting stop losses
Disclosure: I am part of Trade Nation's Influencer program and receive a monthly fee for using their TradingView charts in my analysis.
———————————
WISH YOU ALL LUCK

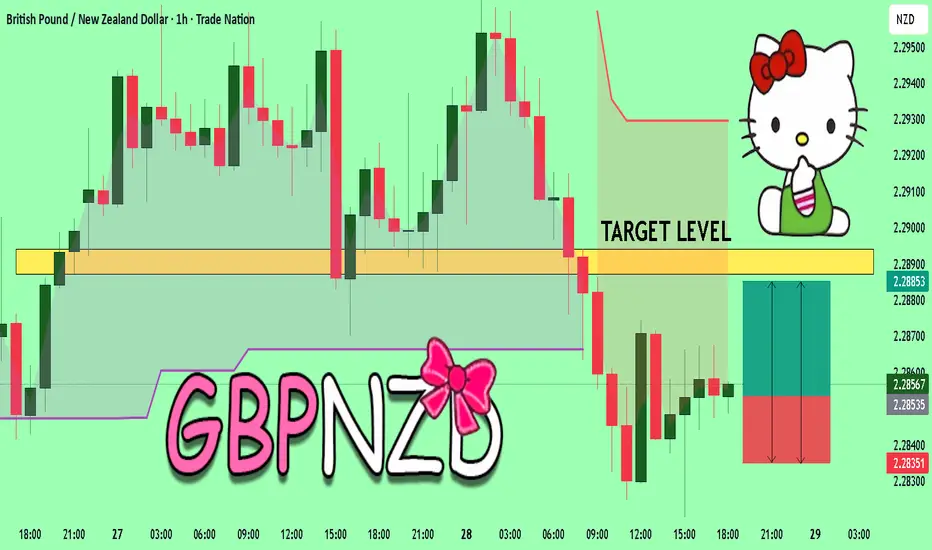
GBPNZD The Target Is UP! BUY!
My dear friends,
My technical analysis for GBPNZD is below:
The market is trading on 2.2852 pivot level.
Bias - Bullish
Technical Indicators: Both Super Trend & Pivot HL indicate a highly probable Bullish continuation.
Target - 2.2887
Recommended Stop Loss - 2.2835
About Used Indicators:
A pivot point is a technical analysis indicator, or calculations, used to determine the overall trend of the market over different time frames.
Disclosure: I am part of Trade Nation's Influencer program and receive a monthly fee for using their TradingView charts in my analysis.
———————————
WISH YOU ALL LUCK
EURJPY Sellers In Panic! BUY!
My dear followers,
I analysed this chart on EURJPY and concluded the following:
The market is trading on 182.77 pivot level.
Bias - Bullish
Technical Indicators: Both Super Trend & Pivot HL indicate a highly probable Bullish continuation.
Target - 183.96
About Used Indicators:
A super-trend indicator is plotted on either above or below the closing price to signal a buy or sell. The indicator changes color, based on whether or not you should be buying. If the super-trend indicator moves below the closing price, the indicator turns green, and it signals an entry point or points to buy.
Disclosure: I am part of Trade Nation's Influencer program and receive a monthly fee for using their TradingView charts in my analysis.
———————————
WISH YOU ALL LUCK

GOLD The Target Is DOWN! SELL!
My dear subscribers,
GOLD looks like it will make a good move, and here are the details:
The market is trading on 5267.0 pivot level.
Bias - Bearish
My Stop Loss - 5295.1
Technical Indicators: Both Super Trend & Pivot HL indicate a highly probable Bearish continuation.
Target - 5208.0
About Used Indicators:
The average true range (ATR) plays an important role in 'Supertrend' as the indicator uses ATR to calculate its value. The ATR indicator signals the degree of price volatility.
Disclosure: I am part of Trade Nation's Influencer program and receive a monthly fee for using their TradingView charts in my analysis.
———————————
WISH YOU ALL LUCK

GOLD Buyers In Panic! SELL!
My dear followers,
I analysed this chart on GOLD and concluded the following:
The market is trading on 5088.9 pivot level.
Bias - Bearish
Technical Indicators: Both Super Trend & Pivot HL indicate a highly probable Bearish continuation.
Target - 5049.0
Safe Stop Loss - 5114.5
About Used Indicators:
A super-trend indicator is plotted on either above or below the closing price to signal a buy or sell. The indicator changes color, based on whether or not you should be buying. If the super-trend indicator moves below the closing price, the indicator turns green, and it signals an entry point or points to buy.
Disclosure: I am part of Trade Nation's Influencer program and receive a monthly fee for using their TradingView charts in my analysis.
———————————
WISH YOU ALL LUCK

EURJPY On The Rise! BUY!
My dear followers,
This is my opinion on the EURJPY next move:
The asset is approaching an important pivot point 182.48
Bias - Bullish
Technical Indicators: Supper Trend generates a clear long signal while Pivot Point HL is currently determining the overall Bullish trend of the market.
Goal - 183.75
About Used Indicators:
For more efficient signals, super-trend is used in combination with other indicators like Pivot Points.
Disclosure: I am part of Trade Nation's Influencer program and receive a monthly fee for using their TradingView charts in my analysis.
———————————
WISH YOU ALL LUCK

EURGBP Expected Growth! BUY!
My dear subscribers,
EURGBP looks like it will make a good move, and here are the details:
The market is trading on 0.8677 pivot level.
Bias - Bullish
Technical Indicators: Both Super Trend & Pivot HL indicate a highly probable Bullish continuation.
Target - 0.8697
About Used Indicators:
The average true range (ATR) plays an important role in 'Supertrend' as the indicator uses ATR to calculate its value. The ATR indicator signals the degree of price volatility.
Disclosure: I am part of Trade Nation's Influencer program and receive a monthly fee for using their TradingView charts in my analysis.
———————————
WISH YOU ALL LUCK
