GBPCAD - Price Is At A Strong Daily ResistanceGBPCAD has been trading in a broad rising channel with repeated reactions from the upper and lower boundaries, so fading extremes of the range is reasonable.
Price is at a strong daily resistance and at the top of the rising channel, so the idea is to wait for a clear bearish rejection there and then look for short entries with tight stops above the high and targets first toward mid‑range, then possibly the lower support zone if downside momentum strengthen
Fxtrading

USDJPY - Potential Dip Buying Opportunity This image is a USD/JPY technical analysis chart (likely daily timeframe) with a bullish bias.
Key points: 🎯
Overall outlook: Bullish ("OVERALL BULLSH") ⬆️
Action suggested: Look for long/buy positions ("LOOK FOR LONGS")
Key level: A horizontal support zone is highlighted, indicating an area to watch for potential bounce/entry opportunities.
Key Zone & Analysis
Price has historically found buyers (bounced upwards).
The analyst expects future declines to halt and reverse.
This zone acts as a potential entry region for long trades.
Summary in One Sentence: ✍️
The analyst identifies a critical support zone on the USD/JPY chart and recommends looking to buy the dip there, based on the conviction that the long-term bullish trend will resume after the current correction. ⬆️

USDJPY – Daily Distribution Phase On the daily timeframe, USDJPY is showing a classic distribution structure. Price made multiple tests into the highs (1st and 2nd test), swept liquidity, and filled the daily gap—a common sign of smart money unloading positions. Momentum is weakening, structure is compressing, and buyers are failing to push higher. This usually precedes a markdown phase, with price targeting lower inefficiencies and unfilled gaps below.
If this level continues to hold as resistance, the probability favors downside rotation toward the next major daily gap and demand zone.
📉 This is how institutions distribute before the drop — not random price action.
Pitch
I don’t trade indicators.
I trade structure, liquidity, and HTF logic like this.
If you want to:
Read distribution early
Stop buying tops
Trade with a clear HTF bias
👉 Follow me on TradingView and trade side-by-side with real market logic, not guesswork.

USDCAD Simple SetupUnder the new leadership of Mark Carney, Canada is positioning itself intelligently for the next phase of global economic stress. Carney isn’t a politician learning economics on the fly—he’s a former Governor of the Bank of England who has already managed crises at the highest level. That matters when capital gets selective, and policy mistakes get punished.
Canada is also moving in the right external direction, deepening trade and industrial ties with the EU and China, particularly in energy and EV supply chains. At the same time, the U.S. is moving the opposite way—more isolationist, more confrontational, and less predictable under Trump, politically, militarily, and economically. Relative positioning matters in FX. Policy divergence plus capital flows make this pair structurally vulnerable to the downside—exactly what the chart is already signaling.
Lastly, CAD is a commodity trade as a little bonus. ;)
Counting is not political, so don't try to make it so.
If you enjoy the work:
👉 Drop a solid comment
Let’s push it to 6,000 and keep building a community grounded in raw truth, not hype.

USDCAD Weekly planThe 1W FVG on the sellers’ side has triggered a bearish 1D OF with a target at the 1W FP. The higher-timeframe trend remains short: 1M FVG ➡️ 1M RB ➡️➡️➡️ 1M FP (1.354).

USDJPY Weekly planOn JPY, I expect a move to the downside following this logic: 1M FP ➡️ 1W OB ➡️➡️➡️ 1M FVG. I will consider trades if price tests the 1W OB and forms confirmation on the 1D timeframe.

EURUSD Weekly planI expect a continuation of the bullish 1W OF and will consider a trade in case of a pullback into the 1W OB zone.

AUDUSD CRACKING!After 15 years of AUD underperformance versus the USD, AUD/USD is approaching a potential long-term regime shift.
The U.S. faces bad politics, rising debt burdens, growing interest expense, fiscal instability, and diminishing returns from financial engineering, while economic growth remains increasingly policy-supported.
Australia enters this period with good politics, lower public debt, greater fiscal flexibility, a comparatively stable economy, and net commodity exports that generate real external income.
Australia runs ~45% debt-to-GDP; the U.S. runs ~120%+. One economy earns foreign income from production — the other increasingly borrows to sustain itself. Currencies eventually reflect that math.
That divergence creates the macro conditions for a structural repricing in AUD/USD.
After 15 years, Australia is in the sweet spot right now for a huge breakout. This is NOT some short-term trade. There is a lot of meat on that bone!
This is not POLITICAL! This is COUNTING!
#FAFO
If you enjoy the work:
👉 Drop a solid comment
Let’s push it to 6,000 and keep building a community grounded in raw truth, not hype.

DXY Cracking!With all this nonsense coming from Trump it is only a matter of time before the $ index collapses along with the stock market and the economy.
This is not political, I call it as I see it, without stubility and the rule of law, investment capital grows wings and flies away.
XOM executive said best when he denied Trump to go into Venezuela due to volitile political system. No different here in the US.
This mini wave up in the DXY is already cracking.
The situation is becoming more and more serious with Trump's insistance in destroying America from within. Not a single American has net benefited from any of his actions after 1 year in office. In fact its just getting worse and worse.
As I have been saying GTFO and STFO.
Being a hero is the world's shortest-lived job.
This is not POLITICAL! This is COUNTING!
#FAFO
If you enjoy the work:
👉 Drop a solid comment
Let’s push it to 6,000 and keep building a community grounded in raw truth, not hype.

GBPNZD - Price is in Overall uptrend from the Daily and WeeklyThis financial chart is a technical analysis for the GBP/NZD currency pair (British Pound / New Zealand Dollar). The analysis indicates a strong long-term bullish trend and suggests an opportunity to buy the pair.
Chart Analysis Summary 📊
Currency Pair: The chart is for the British Pound against the New Zealand Dollar (GBP/NZD), as indicated by the British and New Zealand flags. The price level shown is around 2.30. 💴
Trend: The analysis highlights that both the daily and weekly timeframes are bullish, meaning the price is in an overall uptrend. ⬆️
Actionable Insight: The text "LOOK FOR LONGS" is an instruction for traders to look for opportunities to enter a long position (buy the currency pair), anticipating that its price will increase.
Context: The chart shows the price has pulled back into a potential support or "demand zone" where buyers are expected to re-enter the market, consistent with an ascending channel pattern.

USDCHF - Anticipating the Price to Bounce off Weekly SupportThe image provided displays a technical analysis chart for the USD/CHF (US Dollar/Swiss Franc) currency pair on a weekly timeframe, showing price consolidation within a triangle pattern.
Chart Analysis and Trading Strategy 📊
The chart indicates the following key technical elements and a potential trading bias:
Currency Pair: USD/CHF. 💴
Pattern: The price action is consolidating within a "Triangle" or symmetrical triangle pattern, characterized by converging trendlines (lower highs and higher lows). This generally indicates a period of market indecision before a potential breakout.
Key Levels: 🎯
Weekly Resistance: A resistance zone is marked near the upper boundary of the triangle. A breakout above the resistance area (around 0.8145 according to recent analysis) would confirm a strong upward movement.
Weekly Support: A support area is indicated near the lower boundary of the triangle (around 0.7865). A break below this support would invalidate the bullish scenario and suggest further decline.
Indicated Bias: The annotation "LOOK FOR LONGS" suggests a bullish bias, anticipating that the price will bounce off the lower trendline/support and eventually break out to the upside. Other recent analyses on the pair also suggest a potential for recovery after testing key support levels. ⬆️

ETHUSD CRACK! Wave 3 Warning!🚨When it rains, it pours. We’re seeing concurrent breakdowns across multiple asset classes, consistent with the risks I’ve been flagging for some time.
ETH is at stage 5️⃣ Panic / Liquidity Event, more on this later.
ETH is now down -47% from ATH, after Wave 1 down.
ETH has been trading below the Death Cross X countertrend Wave 2, flagging out "Deeking"(Honey ticking)
Now it is Cracking the Flag. (Like many other asset classes)
🚩 Warning us that Wave 3 down is coming!
1️⃣ Early Drop (-5% to -10%) — Denial Phase
2️⃣ Correction Phase (-10% to -20%) — Reassurance Phase
3️⃣ Official Bear Market (-20%) — Commitment Trap
4️⃣ Deep Decline (-30%) — Moral Pressure Phase
5️⃣ Panic / Liquidity Event (-40% to -50%) — Narrative Flip
6️⃣ Late Stage / Bear Rally — False Hope
At Stage 5️⃣ Panic, you will hear these phrases.
“This was a black swan”
“No one could’ve predicted this”
“It’s different this time — but markets adapt”
“Valuations are now attractive”
“Big Money won’t allow a collapse”
📌 Translation: The damage is done. Rewrite history.
I need to make another post to get you all ready for what is to come, so you don't get suckered like I did when I was first starting out.
I paid the price, so you don't have to.
#FAFO
If you enjoy the work:
👉 Drop a solid comment
Let’s push it to 6,000 and keep building a community grounded in raw truth, not hype.

EURUSD Breakout from Rising Channel – Possible Pullback SetupPrice respected a rising channel structure and finally gave a strong breakout above the resistance / seller zone, showing bullish momentum.
After the breakout, price is now reacting at the previous seller zone, which can act as a retest area before the next move.
🔹 Buyer Zone: 1.1640 – 1.1650 (possible support on pullback)
🔹 Seller Zone: 1.1685 – 1.1700 (previous resistance)
🔹 Breakout Confirmation: Strong bullish candle close above resistance
🔹 Target (TP): 1.1648 (marked on chart)
🔹 Bias: Short-term pullback → continuation possible
📌 Plan:
Wait for price to retest the seller zone and look for confirmation (rejection / structure break) before entering.
If buyer zone holds, bullish continuation is still valid.
⚠️ Risk Management: Always use stop-loss and manage risk properly.

Gold needs a correction after the ATH!Greetings!
If you see me at the charts, it means a fresh dose of solid analysis is coming.
Today my focus is on XAUUSD.
Yesterday we updated the ATH at 4642. Congrats to all holders and bullish traders. 🔥
This move happened amid global uncertainty. Greenland, Cuba, Iran, Trump is actively talking about all of this after what happened in Venezuela.
Because of that, investors are rushing into safe-haven assets to protect capital from a potential crisis.
And gold is the #1 safe-haven asset of all time.
Now to the chart:
The local uptrend started with Wyckoff accumulation. After that, at the top of the channel, price went sideways and formed a Wyckoff distribution.
For those who don’t know:
Accumulation → potential reversal up
Distribution → potential reversal down
At the highs, smart money distributes, so I’m expecting the start of a correction (for now, local).
There are 2 key zones where we could potentially see a reversal.
Profits to everyone! 💰
Follow for more 🚀

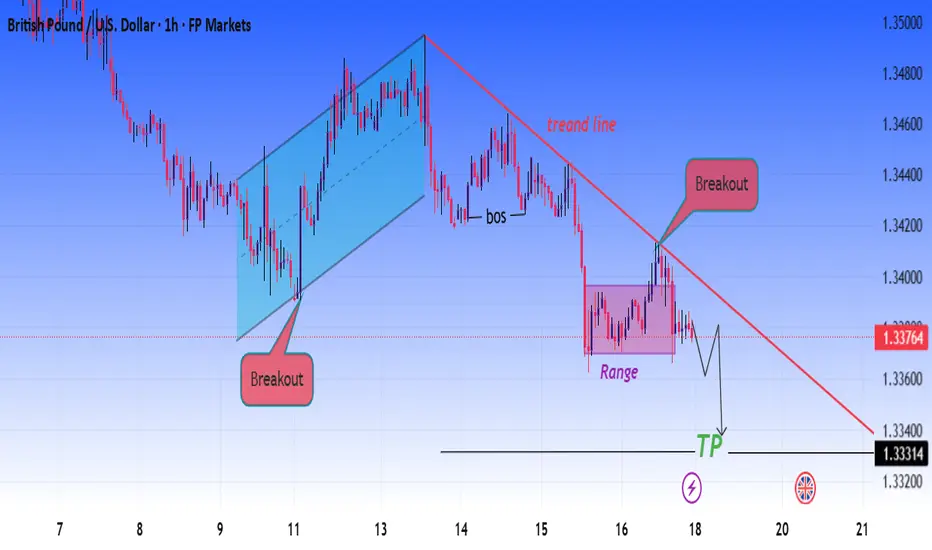
GBPUSD Breakdown from Trendline – Bearish Continuation SetupGBPUSD is respecting a clear descending trendline, and price has just given a strong breakout + retest confirmation. After the break of structure (BOS), price consolidated in a small range and failed to reclaim the trendline, indicating sellers are still in control.
This setup suggests a bearish continuation toward the next support zone.
Bias: Bearish
Entry: After rejection from trendline / range high
Target: 1.3330 – 1.3320 zone
Invalidation: Strong close above trendline
Risk Management:
⚠️ Always use stop-loss above the trendline
⚠️ Risk only 1–2% per trade
⚠️ Wait for confirmation candle before entry
BTCUSD Facing Supply Zone – Demand Area as Next SupportBitcoin is currently trading inside a range after breaking the ascending channel structure. The bullish momentum has weakened, and price is now respecting a descending supply line, showing sellers are in control.
A clear breakdown from the range confirms short-term bearish bias. Price is likely to move toward the demand zone around 94,000 – 93,900, where buyers may step in for a reaction.
If demand holds, we could see a bounce. If it breaks, expect further downside continuation.
Key Levels:
Supply / Resistance: 97,600 – 98,000
Current Range: 95,000 – 96,200
Demand / Support: 94,000 – 93,900
Bias:
📉 Bearish below supply
📈 Bullish only if strong demand reaction appears
Risk Management:
Always wait for confirmation at demand zone.
Use tight stop-loss below demand to protect capital.
Never risk more than 1–2% per trade.

XAUUSD (Gold) 1H – Buy the Dip from Strong Demand ZoneGold is currently pulling back into a key demand/support zone, which previously acted as a strong base for bullish continuation. This area is marked as a high-probability buy zone, where smart money showed interest earlier.
Price reaction from this zone suggests buyers are still active. As long as the support holds, we can expect a bullish reversal and continuation toward higher highs.
🔹 Trade Idea:
Buy Zone: Marked demand area (best place for buy)
Target: Previous highs / upside continuation
Invalidation: Clear break and close below the demand zone
⚠️ Always wait for confirmation and follow proper risk management.

Dollar is strengthening against euro Hello! This is your finance professional speaking. Today we will look at one of the most important currency pairs in the global economy - EUR/USD.
Let’s start with fundamental analysis.
The EUR/USD pair reflects the ratio of the euro to the US dollar and reacts sensitively to central bank decisions, macroeconomic statistics, and overall risk appetite in global markets. Two institutions play a key role here - the European Central Bank (ECB) and the U.S. Federal Reserve (Fed).
Now let’s break down the key indicators and see how they influence the EUR/USD exchange rate.
1. Interest rates of the ECB and the Fed
This is the main driver of the pair’s movement. When rates in the U.S. are higher, the dollar becomes more attractive to investors and EUR/USD usually declines. If ECB policy is tighter or rates in the eurozone are relatively higher, the euro receives support.
2. Inflation
Rising inflation forces central banks to tighten monetary policy.
High inflation in the U.S. increases the likelihood of Fed rate hikes and supports the dollar.
Rising inflation in the eurozone strengthens expectations of tightening from the ECB and supports the euro.
3. Labor market
Strong U.S. employment data (NFP, unemployment) strengthens the dollar and raises expectations of higher interest rates. A weakening labor market, on the other hand, puts pressure on the dollar. The same logic applies to the eurozone.
4. Economic growth (GDP)
Higher growth makes a country’s assets more attractive.
Strong U.S. economic growth supports the dollar; strong eurozone growth supports the euro.
5. Market risk sentiment
In periods of uncertainty, investors move into safe-haven assets. The dollar traditionally plays the role of a "safe haven", so when global risks increase, the EUR/USD pair often declines.
Now let's move on to technical analysis.
1)EUR/USD has formed 5 Elliott waves up, indicating a potential trend completion.
2)At the end of the trend, a Wyckoff distribution structure has formed, signaling selling activity.
3)The reverse USDEUR chart shows that the dollar is being bought.
DXY is also an important indicator. In the attached screenshot, you can see that the dollar index is currently strengthening, and if it continues to rise, all dollar-denominated assets may undergo a correction.
Overall, that’s the situation!
Write in the comments what you think

EURJPY smart money is here!Hi! A financier is at the screens - today I’ll show you the trade I entered.
In front of us is the EURJPY chart.
First, it’s worth noting that the inverse chart JPYEUR looks very weak. This tells us that the euro is indeed stronger now, and we may see growth.
Second, in mid-December we had a similar structure. I’ve highlighted these structures with a blue rectangle.
Inside these rectangles, an accumulation schematic based on Wyckoff formed. This suggests that we have potential for a reversal and solid upside. It’s also worth noting that the structures are similar to each other and exhibit fractality.
So overall, I opened a long position, aiming to trade it up to the high where we have a liquidity shelf.

USDJPY Wait For The Beak!The Bank of Japan just hiked interest rates by 25 bps to 0.75%, the highest level in ~30 years. FED lowering while BOJ raising rates is bad juju for the carry trade.
Why carry risk is rising
BOJ hikes = funding cost up. Yen is no longer “free money.”
Fed cuts = yield advantage shrinking. The whole carry equation weakens.
Compression kills carry. You don’t need parity — you just need the gap to narrow.
What actually breaks carry trades
Not the BOJ hike
Not the Fed cut
The moment markets believe the trend is durable
Carry trades die on expectations, not announcements.
Keep an eye out for the breakout.
If carry breaks, bad juju for Crypto & AI trade,

XAUUSD (Gold) – Bullish Exhaustion → Short OpportunityGold is currently trading near a strong resistance zone after a sharp impulsive move, showing signs of bullish exhaustion. Price is respecting the rising trendline, but rejection from the upper zone suggests a potential pullback / correction.
🔹 Key Observations:
Strong bullish push followed by consolidation
Price reacting near a premium resistance area
Possible lower high formation
Trendline break or rejection could trigger downside momentum
🎯 Bearish Scenario:
If price fails to hold above resistance, we may see a corrective move toward the demand zone highlighted on the chart.
📌 Targets:
First support near 4536 area, followed by deeper continuation if momentum increases.
🛑 Invalidation:
A strong close and hold above the resistance zone will invalidate the short setup.
⚠️ Risk Management:
Always wait for confirmation and manage risk properly. This is not financial advice.

AUDCAD going long!Hello! This is your finance professional, and here is a new high-quality analysis.
Today we will review the AUDCAD currency pair.
On the chart, we can see that after a strong impulse the price went into a correction. The decline did not follow a usual structure but formed a wedge pattern.
A wedge pattern is a reversal structure. That is exactly what happened — the price reversed and we saw the continuation of the uptrend.
Right now, I have taken a long position according to my trend-following strategy and set the target at the asset’s high.

BTCUSD 1H – Trendline Resistance + Supply Zone RejectionBitcoin is trading under a strong descending trendline, showing clear bearish pressure on the 1H timeframe. Price has revisited a key supply/resistance zone (green area) and failed to break above it, indicating seller dominance.
The recent pullback looks corrective, and price is expected to reject from the supply zone and continue the downside move. A bearish continuation is likely as long as BTC remains below the trendline resistance.
Target:
➡️ Previous demand/support zone around 89,700 – 89,800
Invalidation:
❌ Sustained candle close above the supply zone & trendline
Risk Management:
Use proper position sizing and wait for confirmation before entry.
⚠️ This is not financial advice. Trade with discipline.
