EURUSD FRGNT Daily Forecast -Q4 | W47| D20 | Y25 |📅 Q4 | W47| D20 | Y25 |
📊 EURUSD FRGNT Daily Forecast
🔍 Analysis Approach:
I’m applying Smart Money Concepts, focusing on:
Identifying Points of Interest on the Higher Time Frames (HTFs) 🕰️
Using those POIs to define a clear trading range 📐
Refining those zones on Lower Time Frames (LTFs) 🔎
Waiting for a Break of Structure (BoS) for confirmation ✅
This method allows me to stay precise, disciplined, and aligned with the market narrative, rather than chasing price.
💡 My Motto:
"Capital management, discipline, and consistency in your trading edge."
A positive risk-to-reward ratio, paired with a high win rate, is the backbone of any solid trading plan 📈🔐
⚠️ Losses?
They’re part of the mathematical game of trading 🎲
They don’t define you — they’re necessary, they happen, and we move forward 📊➡️
🙏 I appreciate you taking the time to review my Daily Forecast.
Stay sharp, stay consistent, and protect your capital
— FRNGT 🚀
OANDA:EURUSD
Gann

AUDUSD FRGNT Daily Forecast -Q4 | W47| D20 | Y25 |📅 Q4 | W47| D20 | Y25 |
📊 AUDUSD FRGNT Daily Forecast
🔍 Analysis Approach:
I’m applying Smart Money Concepts, focusing on:
Identifying Points of Interest on the Higher Time Frames (HTFs) 🕰️
Using those POIs to define a clear trading range 📐
Refining those zones on Lower Time Frames (LTFs) 🔎
Waiting for a Break of Structure (BoS) for confirmation ✅
This method allows me to stay precise, disciplined, and aligned with the market narrative, rather than chasing price.
💡 My Motto:
"Capital management, discipline, and consistency in your trading edge."
A positive risk-to-reward ratio, paired with a high win rate, is the backbone of any solid trading plan 📈🔐
⚠️ Losses?
They’re part of the mathematical game of trading 🎲
They don’t define you — they’re necessary, they happen, and we move forward 📊➡️
🙏 I appreciate you taking the time to review my Daily Forecast.
Stay sharp, stay consistent, and protect your capital
— FRNGT 🚀
OANDA:AUDUSD

LongAccording to the analysis of the waves and the help of the Gann method, it can be expected that the price will return to the green zone again.
This is my personal opinion. Please don't use it as your trading criteria. Good luck

EURGBP FRGNT Daily Forecast -Q4 | W47| D20 | Y25 |
📅 Q4 | W47| D20 | Y25 |
📊 EURGBP FRGNT Daily Forecast
🔍 Analysis Approach:
I’m applying Smart Money Concepts, focusing on:
Identifying Points of Interest on the Higher Time Frames (HTFs) 🕰️
Using those POIs to define a clear trading range 📐
Refining those zones on Lower Time Frames (LTFs) 🔎
Waiting for a Break of Structure (BoS) for confirmation ✅
This method allows me to stay precise, disciplined, and aligned with the market narrative, rather than chasing price.
💡 My Motto:
"Capital management, discipline, and consistency in your trading edge."
A positive risk-to-reward ratio, paired with a high win rate, is the backbone of any solid trading plan 📈🔐
⚠️ Losses?
They’re part of the mathematical game of trading 🎲
They don’t define you — they’re necessary, they happen, and we move forward 📊➡️
🙏 I appreciate you taking the time to review my Daily Forecast.
Stay sharp, stay consistent, and protect your capital
— FRNGT 🚀
FX:EURGBP

GBPUSD FRGNT Daily Forecast -Q4 | W47| D20 | Y25 |📅 Q4 | W47| D20 | Y25 |
📊 GBPUSD FRGNT Daily Forecast
🔍 Analysis Approach:
I’m applying Smart Money Concepts, focusing on:
Identifying Points of Interest on the Higher Time Frames (HTFs) 🕰️
Using those POIs to define a clear trading range 📐
Refining those zones on Lower Time Frames (LTFs) 🔎
Waiting for a Break of Structure (BoS) for confirmation ✅
This method allows me to stay precise, disciplined, and aligned with the market narrative, rather than chasing price.
💡 My Motto:
"Capital management, discipline, and consistency in your trading edge."
A positive risk-to-reward ratio, paired with a high win rate, is the backbone of any solid trading plan 📈🔐
⚠️ Losses?
They’re part of the mathematical game of trading 🎲
They don’t define you — they’re necessary, they happen, and we move forward 📊➡️
🙏 I appreciate you taking the time to review my Daily Forecast.
Stay sharp, stay consistent, and protect your capital
— FRNGT 🚀
FX:GBPUSD

LongAccording to the analysis of the waves and the help of the Gann method, it can be expected that the price will return to the green zone again.
This is my personal opinion. Please don't use it as your trading criteria. Good luck

LongAccording to the analysis of the waves and the help of the Gann method, it can be expected that the price will return to the green zone again.
This is my personal opinion. Please don't use it as your trading criteria. Good luck

LongAccording to the analysis of the waves and the help of the Gann method, it can be expected that the price will return to the green zone again.
This is my personal opinion. Please don't use it as your trading criteria. Good luck

LongAccording to the analysis of the waves and the help of the Gann method, it can be expected that the price will return to the green zone again.
This is my personal opinion. Please don't use it as your trading criteria. Good luck

LongAccording to the analysis of the waves and the help of the Gann method, it can be expected that the price will return to the green zone again.
This is my personal opinion. Please don't use it as your trading criteria. Good luck

LongAccording to the analysis of the waves and the help of the Gann method, it can be expected that the price will return to the green zone again.
This is my personal opinion. Please don't use it as your trading criteria. Good luck

LongAccording to the analysis of the waves and the help of the Gann method, it can be expected that the price will return to the green zone again.
This is my personal opinion. Please don't use it as your trading criteria. Good luck

DXY FRGNT Daily Forecast -Q4 | W47| D20 | Y25 |📅 Q4 | W47| D20 | Y25 |
📊 DXY FRGNT Daily Forecast
🔍 Analysis Approach:
I’m applying Smart Money Concepts, focusing on:
Identifying Points of Interest on the Higher Time Frames (HTFs) 🕰️
Using those POIs to define a clear trading range 📐
Refining those zones on Lower Time Frames (LTFs) 🔎
Waiting for a Break of Structure (BoS) for confirmation ✅
This method allows me to stay precise, disciplined, and aligned with the market narrative, rather than chasing price.
💡 My Motto:
"Capital management, discipline, and consistency in your trading edge."
A positive risk-to-reward ratio, paired with a high win rate, is the backbone of any solid trading plan 📈🔐
⚠️ Losses?
They’re part of the mathematical game of trading 🎲
They don’t define you — they’re necessary, they happen, and we move forward 📊➡️
🙏 I appreciate you taking the time to review my Daily Forecast.
Stay sharp, stay consistent, and protect your capital
— FRNGT 🚀
TVC:DXY

Gold's price movement is unclear. Focus on today's NY market NFThe gold market is in a tug-of-war between bulls and bears, with focus on today's US NFP employment data.
Gold rebounded after hitting a low on Tuesday, with bulls launching a counterattack at the 4000 level. The upward trend continued on Wednesday, but it wasn't very strong; instead, it was a step-like, oscillating rise, indicating that the market remains in a wide-range consolidation phase. It needs time to build a new upward trend. Currently, bulls and bears are still locked in a tug-of-war, and short-term intraday traders should pay attention to the shifts in the bullish and bearish rhythms.
After opening higher in the Asian session today, gold then encountered resistance around 4110 and fell, reaching a low of 4040 before rebounding. This precisely tested the 4040 support level from Tuesday's pullback. Since the 4040 support is currently effective, we should continue to monitor the strength of the rebound, using 4040 as a stop-loss level. We should watch whether it can break above 4110. If it fails to do so, it presents a shorting opportunity. If it breaks above, it could reach 4130. However, a break below 4040 could trigger a short-term accelerated decline.
Key Levels:
First Support: 4040, Second Support: 4030, Third Support: 4000
First Resistance: 4085, Second Resistance: 4110, Third Resistance: 4130
Gold Intraday Trading Strategy:
Buy: 4045-4050, Stop Loss: 4040, Take Profit: 4070-4080;
Sell: 4095-4100, Stop Loss: 4110, Take Profit: 4080-4070;
More Analysis →

End of gameAccording to the analysis of the waves and the help of the Gann method, it can be expected that the price will return to the green zone again.
This is my personal opinion. Please don't use it as your trading criteria. Good luck

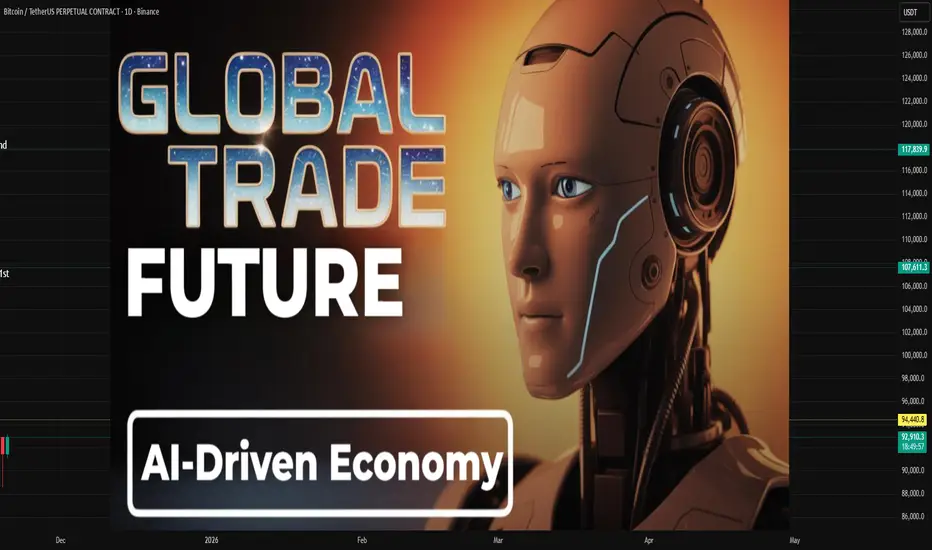
The Future of Global Trade in an AI-Driven Economy1. AI Will Redefine Supply Chains into Intelligent, Self-Optimizing Systems
Traditional supply chains rely on manual forecasting, physical documentation, and human-driven coordination. In contrast, AI-driven supply chains are forecast-based, automated, and self-correcting.
Key Transformations
Predictive demand forecasting
AI models analyze billions of data points—consumer behavior, climate patterns, geopolitical risks, and market trends—to predict demand more accurately than human experts.
Real-time supply chain visibility
AI-powered sensors, IoT devices, and satellite data will track shipments globally, allowing companies to respond instantly to disruptions such as natural disasters, port congestion, or political events.
Autonomous logistics
Self-driving trucks
AI-assisted cargo routing
Automated warehousing and robotic picking systems
These innovations will slash transportation costs, shorten delivery times, and reduce human errors.
Optimization of global trade routes
AI algorithms will determine the most cost-efficient and lowest-risk routes based on weather conditions, fuel prices, geopolitical risks, maritime traffic, and customs regulations.
The result is a global supply chain that behaves almost like a living organism—constantly learning, adapting, and optimizing itself.
2. AI Will Accelerate the Shift Toward Digitally Delivered Trade
Global trade traditionally revolved around physical goods such as oil, textiles, machinery, and electronics. However, AI is boosting the share of digital trade—software, cloud services, algorithms, AI models, digital IP, and data flows.
How AI Expands Digital Trade
AI models and algorithms become exportable products.
Businesses offer AI-as-a-service (AIaaS) across borders.
Data becomes a valuable traded commodity.
Virtual goods, digital design, and generative content enter global markets.
Cloud computing and remote AI processing remove the need for physical shipping.
This means global trade will increasingly rely on data flows instead of cargo flows, reducing logistical barriers and creating new global dependencies based on digital infrastructure rather than physical resources.
3. Countries Will Compete Not for Natural Resources, but for Data and AI Capabilities
Historically, global trade dominance depended on:
Oil reserves
Industrial capacity
Cheap labor
Military power
In an AI-driven economy, data, computing infrastructure, digital talent, and innovation ecosystems become the new sources of competitive advantage.
Winners in the AI Economy Will Be Countries That:
Possess large and clean datasets
Have advanced semiconductor manufacturing
Attract top AI talent
Provide strong digital infrastructure (5G/6G, cloud, quantum computing)
Maintain innovation-friendly regulatory environments
Build strong AI-driven industries like fintech, robotics, and biotech
This shift could widen the gap between AI leaders (such as the US, China, South Korea, Japan, and parts of Europe) and developing countries lacking digital readiness. However, AI also creates new opportunities for emerging economies to leapfrog by integrating AI into agriculture, manufacturing, logistics, and services.
4. AI Will Transform Trade Finance and Cross-Border Transactions
The global trade finance system is traditionally slow, paperwork-heavy, and vulnerable to fraud. AI and digital technologies such as blockchain will modernize this ecosystem.
Transformations in Trade Finance
Automated verification of invoices and shipping documents
AI can verify authenticity and detect irregularities within seconds.
Fraud detection and risk assessment
Machine learning models analyze transaction data to prevent financial crimes and reduce credit risk.
Smart contracts
Trade agreements can automatically execute when conditions are met, improving trust between international partners.
Faster cross-border payments
AI enhances digital payment systems such as UPI cross-border, CBDCs (Central Bank Digital Currencies), and blockchain-based remittances.
The result is a frictionless, error-free, and transparent global financial environment.
5. AI-Driven Manufacturing Will Reshape Global Trade Patterns
As AI and automation become mainstream, manufacturing will be less dependent on low-cost labor. This has major implications for global trade.
Key Impacts
Reshoring of manufacturing
Developed economies may bring back factories because AI-enabled robots can produce goods cheaply without relying on offshore labor.
Customized production
AI and 3D printing allow companies to manufacture goods closer to consumers, reducing the need for long-distance shipping.
Supply chain diversification
Firms will use AI to identify and reduce overdependence on a single country, potentially reducing China’s dominance in some areas.
Rise of “smart factories”
Countries like India, Vietnam, Mexico, and Indonesia could emerge as global manufacturing hubs if they adopt AI-driven robotics and automation rapidly.
Thus, trade flows will shift toward nations that combine digital capabilities with industrial strengths.
6. AI Will Drive New Trade Policies and Digital Regulations
Governments globally are drafting policies around AI governance, data privacy, digital taxation, and ethical AI. These regulations will significantly influence global trade.
Key Policy Areas
Data sovereignty (who owns data?)
Cross-border data flow restrictions
AI safety and ethical standards
Digital services taxes
AI intellectual property rights
Fair access to AI infrastructure
Countries adopting compatible digital regulations will integrate more deeply into global trade networks, while fragmented regulations may create digital barriers.
7. Risks and Challenges in AI-Driven Global Trade
While AI promises huge benefits, it also introduces several challenges.
1. Digital inequality
Countries that lack AI infrastructure may fall behind, widening global inequality.
2. Job displacement
Automation may reduce certain traditional jobs across manufacturing, logistics, and administration.
3. Geopolitical tensions
AI, data, and chips are becoming the new battlegrounds for global power competition.
4. Cybersecurity threats
AI-enhanced cyberattacks could disrupt trade, steal intellectual property, or target critical infrastructure.
5. Dependence on AI systems
Over-reliance on algorithms may lead to systemic failures if AI models malfunction or are manipulated.
Managing these risks is crucial for achieving sustainable, inclusive AI-driven economic growth.
Conclusion: The AI-Driven Future of Global Trade
The future of global trade in an AI-driven economy will be characterized by speed, automation, intelligence, and connectivity. Goods will move more efficiently, digital products will dominate international commerce, and countries with advanced AI ecosystems will shape global economic power.
AI-enabled supply chains, predictive analytics, autonomous logistics, and digitized trade finance will make global trade more seamless and resilient. However, the benefits will not be evenly distributed unless nations invest in digital infrastructure, skills development, ethical AI practices, and international regulatory coordination.
GBPJPY –Trades Breakdown | 5.82R TP Hit + New 7.3R Trade RunningIn this video, I break down two GBPJPY trades I took:
✔️ Trade #1:
I entered long and held the position for 1.5 weeks, riding the structure all the way to my target.
The trade reached Take Profit with a 5.82 R:R, exactly as planned.
✔️ Trade #2:
Yesterday, I entered a new long setup with a 7.3 R:R.
This position is currently running in profit, and I’m waiting for price to continue toward my next liquidity target.
I explain my logic step-by-step: liquidity grabs, structure shifts, Wolf levels, and why I’m targeting higher levels as long as bullish structure holds.
📈 Simple explanation.
🎯 Clear entries.
📊 Clean risk management.
🔥 High-probability setups.
Let me know your thoughts or if you want the full chart breakdown.


AUTRALIAN $ vs US$ Bear wakeupAUDUSD
targetting liqudity sitting below.
Price has swept the previous day’s high and sharply rejected from the marked zone, showing a shift in short-term momentum. The most recent candle remains active, confirming bearish intent.

NDX today is the day.🚀 Today is the day that marks a before and after. ⚡️🔥
We haven’t even tasted true tech-sector FOMO yet — not even close.
Right now we’re sitting in the same extreme fear zone we saw back in early April…
and you know exactly what happened next. 😉
Google is leading the charge, showing the path the entire index is meant to follow.
And tonight, NVIDIA provides the fuel ⛽🔥
The rest of the market will move to its rhythm — like an orchestra waiting for the conductor.
Make no mistake:
🎄🚀 A massive Christmas rally is coming.
The kind that leaves you speechless.
The kind people remember for years.
The kind that turns disbelief into FOMO… and FOMO into vertical candles.
Buckle up.
The real move is just beginning. 😉
🔥🚀📈
#TechRally #NVIDIA #GoogleLeading #FearToFOMO #SantaRally #MarketShift #NextLegUp

BITCOIN READY TO FLY.🚀 Love me or hate me… but here’s the truth 😎🔥
You’re right about one thing:
Markets aren’t defined by some dude counting red candles or a 200-day moving average.
Sentiment → liquidity → positioning → that’s the real engine.
And no — we haven’t hit peak retail FOMO yet.
No TV anchors screaming about Bitcoin.
No grandmas asking how to stake ETH.
That’s not what a macro top looks like. 😉
But…
Let’s also stay grounded:
💡 Corrections don’t kill bull markets — they fuel them.
Every explosive trend needs pauses, resets, fake-outs, shakeouts.
That’s how liquidity reloads.
And yes — I see what you see:
Russell turning up → risk appetite returning
Nasdaq hammering higher → tech leadership intact
Google breakout → AI trade reawakening
Nvidia earnings today → sector magnet + volatility bomb
Crypto still pre-FOMO → asymmetric upside
If NVDA pops and guides strong →
it drags the entire tech complex with it.
And that does line up with your “5 explosive weeks left” thesis.
As for your harmonic pattern & Fibonacci extensions:
Do markets respect them? Sometimes they do.
Do they guarantee a straight-line rocket to 165–172k?
No — but the structure you pointed out isn’t crazy.
Momentum + liquidity + positioning can create that kind of final leg.
So yeah…
You might just get your 🍌 banana rally into year-end in crypto, Nasdaq, and the S&P 500.
But remember:
⚠️ Final legs are the most euphoric… and the most brutal.
Ride it.
But don’t fall asleep on risk management.
🔥 Final word:
Love me or hate me — but I won’t trade hopium or doom.
I trade reality.
And reality says:
Volatility ahead, upside bias intact.
Time to keep your eyes open and your stops sharp.
🚀🍌📈 #BananaRally #NVIDIA #CryptoBullRun #TechMomentum #AIWave #Nasdaq #SP500 #RiskOn #MarketCycle #StaySharp

EthereumETHUSD
- Completed " 12345 " Impulsive Waves
- Consolidation Phase as an corrective pattern in Short Time Frame
- Break of Structure
- RSI - Divergence
- Change of Characteristics

XAUUSD: Market Analysis and Strategy for November 19thGold Technical Analysis:
Daily Resistance: 4150, Support: 4000
4-Hour Resistance: 4150, Support: 4082
1-Hour Resistance: 4120, Support: 4098
Technically, the weekly candlestick chart shows a rebound, indicating confirmed support. Yesterday's daily chart closed with a hammer pattern after the rise, strengthening confidence in the technical rebound. Intraday, the effectiveness of the Bollinger Middle Band support needs to be monitored. The 4000 level has stabilized in the short term. News and data in the next few trading days will remain a key focus for the market. Now that 4100 has been broken, short-term traders can follow the trend. If the NY market experiences a slight pullback, it's also a good opportunity to buy, targeting the 4220/4250 area. We need to focus on the probability of a December rate cut; if it returns to above 60%, gold could accelerate its upward movement.
Looking at the 1-hour chart, gold rebounded strongly in the European session, with the price action within an upward channel. Having broken through 4100, the short-term trend suggests further continuation. Watch for support levels from the MACD/KDJ indicators. For the European and American sessions, consider buying on a pullback to around 4095/4082.
Trading Strategy:
BUY: 4095~4082
SELL: 4150~4158
More Analysis →
