Gold remains bullish.From a technical perspective, the monthly chart continues its bullish trend, while the weekly and daily charts closed with significant gains. Last week, after testing the 10-day moving average (MA10) at 4050/40, the price regained support in that area. The daily chart also shows strength, with the MA10 and 7-day moving averages trending upwards, and the lows gradually moving higher. The price is trading within the upper Bollinger Band channel, and the RSI indicator is above the midline. The short-term 4-hour and 1-hour charts also show an upward-trending moving average system, with the Bollinger Bands expanding upwards. The initial trading strategy for gold at the start of the week should focus on buying on dips, followed by selling at key resistance levels.
In the short term, gold prices finally broke through the resistance at 4210, after which they pulled back slightly. Currently, a strong upward trend has formed on a smaller timeframe, and further gains are possible after the pullback. On the 4-hour chart, the main support level is at 4200. If the upward trend continues, a significant pullback is unlikely; therefore, it's important to watch for buying opportunities after a short-term bottom is established.
Key Levels:
First Support: 4208, Second Support: 4190, Third Support: 4172
First Resistance: 4260, Second Resistance: 4276, Third Resistance: 4298
Gold Trading Strategy:
BUY: 4195-4200, SL: 4185, TP: 422-4230;
SELL: 4270-4275, SL: 4285, TP: 4250-4240;
More Analysis →
Gann

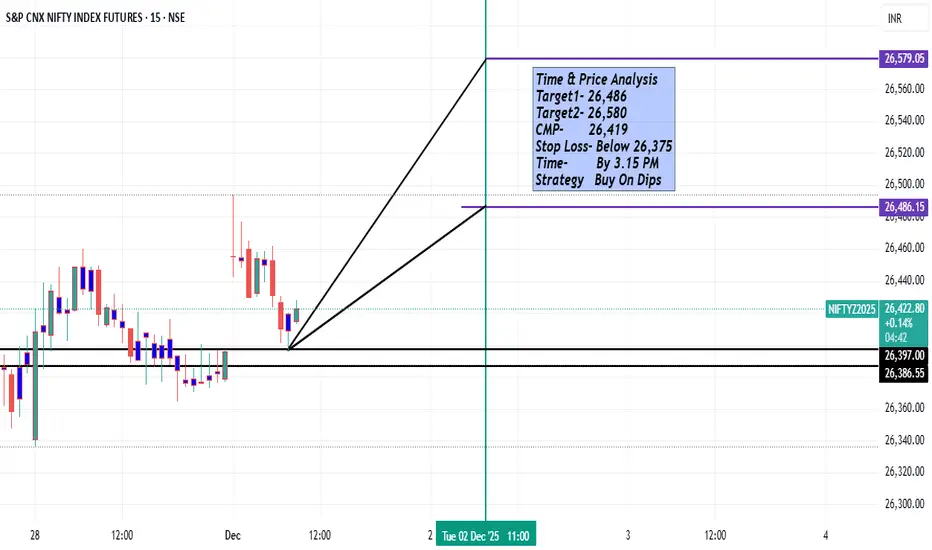
NIFTY INTRADAY TIME & PRICE SETUP — READY FOR LIFTOFF! NIFTY INTRADAY TIME & PRICE SETUP — READY FOR LIFTOFF! CMP: 26,419
🎯 Target 1: 26,486
🎯 Target 2: 26,580
🛡️ Stop-loss: Below 26,375
⏰ Time Window: Move expected before 3:15 PM
📌 Strategy: Buy on dips only!
🔥 The price is holding strong above key demand zones and the time cycle suggests a sharp move is loading. Dips = Opportunities. Breaks below 26,375 — setup invalid, stay disciplined.
If momentum kicks in… Target 1 & 2 can get taken out FAST.
Let’s ride the move! 💥📈
After the market opens, I will continue to go long on gold!The countdown to the opening of the gold market has begun! Before the market opens, let's review last week's market movements and trading strategies.
Last week's market performance was very stable compared to previous weeks, with an overall upward trend and relatively small intraday pullbacks without significant volatility. This kind of market movement is very favorable for traders. Our trading strategy, from opening to closing, focused on going long on gold for several trading days, with our thinking largely in sync with the market movement, including our prediction that Friday's closing price would be above $4200, which all came true. It's no exaggeration to say that I still have long positions held in my account, bought at $4050. For those who haven't followed me, you can check out my historical perspectives.
As seen from last week's price action, gold is regaining its strength, gradually recovering lost ground and approaching previous highs. The weekly price has rebounded above all major moving averages, and the daily and hourly charts also show strength. Therefore, after the market opens, our strategy will remain primarily long. I plan to enter the market in batches in the $4190-$4210 range, a level with strong support and relatively safe entry.
The above views represent my personal thoughts. If you do not yet have a clear trading strategy or the ability to independently analyze market trends, you are welcome to refer to them! Let's improve together! If the market changes, I will notify you in the channel!

Gold Ready for a Big Move?iew-ready analysis description based on your XAUUSD chart:
📊 XAUUSD – 1H Analysis
Gold is currently testing a major horizontal resistance zone, aligned with a strong ascending trendline that has been guiding price upward for several days. This creates a critical decision point where price can either break out or reject.
🔹 Scenario 1: Bullish Breakout
If price breaks and closes above the resistance zone, we can expect bullish continuation toward the upper target zone around 4,320–4,360.
A retest of the broken level could provide a clean continuation entry.
🔹 Scenario 2: Bearish Rejection
If price fails to break through resistance, a pullback toward the ascending trendline is likely.
A breakdown of that trendline may trigger a deeper correction toward the lower target zone around 4,080–4,120.
📌 Key Levels
Resistance: 4,240–4,255
Bullish Target: 4,320–4,360
Bearish Target: 4,080–4,120
Trendline Support: rising structure from Nov 21
✔️ Bias
Neutral at current level — direction depends on how price reacts to resistance.

XAUUSD 2H — Bullish Continuation SetupOANDA:XAUUSD
Price has already cleared several liquidity points and broken a major descending trendline. As long as the structure remains intact and support holds, continuation toward the next premium level is likely.
Key Scenarios
✅ Bullish Case 🚀
If price retests and holds above 4,154 zone
→ 🎯 Target 1: 4,210
→ 🎯 Target 2: 4,250–4,270 major resistance
❌ Bearish Case 📉
Break and close below 4,129 invalidation zone
→ 🎯 Downside Target: 4,105–4,070
Current Levels to Watch
Resistance 🔴: 4,210 🡆 4,250–4,270
Support 🟢: 4,154 🡆 4,129 (invalidation)
Liquidity Swept: Prior highs cleared
⚠️ Disclaimer: This analysis is for educational purposes only — not financial advice.

BNB Weekly Demand Zone Reversal Ready
#BNB Binance Coin is reacting strongly from the 0.786 Fibonacci demand zone, showing early signs of a major trend reversal📉➡️📈
As long as price holds this weekly support block, BNB is positioned for a powerful breakout in the coming weeks.
🎯 Targets:
• $1,296.11
• $1,456.54

LINK NEXT TARGET#LINK is completing a clean harmonic reversal pattern on the 4D timeframe — with price sitting exactly at point A, a key demand zone and structural support🔥📈
BIST:LINK If this harmonic plays out, we should see a multi-leg expansion toward:
🎯 Point B → 0.473 ratio
🎯 Point C → 0.484 completion
🎯 Point D → 1.244 – 4.373 extension zone (major breakout targets)

Broadcom: The Sleeping Giant Awakens— The New Leader in AIBroadcom is no longer the quiet infrastructure company it used to be.
In 2025, AVGO has transformed into a direct AI compute powerhouse, and the chart is reflecting this shift with powerful clarity.
Chart Reading — AVGO
AVGO has reclaimed its April 7th key angle—the foundational 1-degree / 1-dollar-per-day trendline that defined the entire advance of 2025.
Regaining this angle places the stock back inside places it in a much stronger position especially as it closes into all-time highs and also closing weekly above 400$
The Business Shift Driving the Move
Broadcom is now at the center of the AI boom because:
Google’s TPU/XPU adoption has pushed AVGO into custom AI compute.
Hyperscalers want cheaper, more efficient, in-house AI silicon.
AVGO now controls AI networking + AI compute, not just one layer.
This shift expands Broadcom’s market dramatically and accelerates future earnings. AVGO is no longer just a networking company — it’s now a core AI hardware provider, offering hyperscalers a cheaper, efficient alternative to NVIDIA’s chips. Gemini 3 Pro proved that the world’s most advanced language model doesn’t need to run exclusively on NVDA hardware.
Forecast
AVGO now carries the potential for materially higher prices as the next AI wave unfolds. A clear structural path has unfolded toward $450–$500. Its breakout has already allowed it to outperform both the S&P 500 and the semiconductor sector from the October 28th top to now—a key signal of emerging leadership.
If current momentum holds, Broadcom is positioned not only to participate in the next AI advance, but to lead it, becoming one of the primary drivers of the cycle heading into 2026.

PUMP NEXT TARGET ??✅ NYSE:PUMP
#PUMP The coin is completing a falling wedge on the 4D timeframe — one of the strongest reversal patterns📈🔥
Price is sitting exactly inside the demand zone, and any bounce from here could trigger a vertical move.
Targets:
0.00343 🔔
0.00684 🔔
0.01028 🔔

British PoundIn making of Head and shoulder.
It should take rejection here and then reach till neckline.

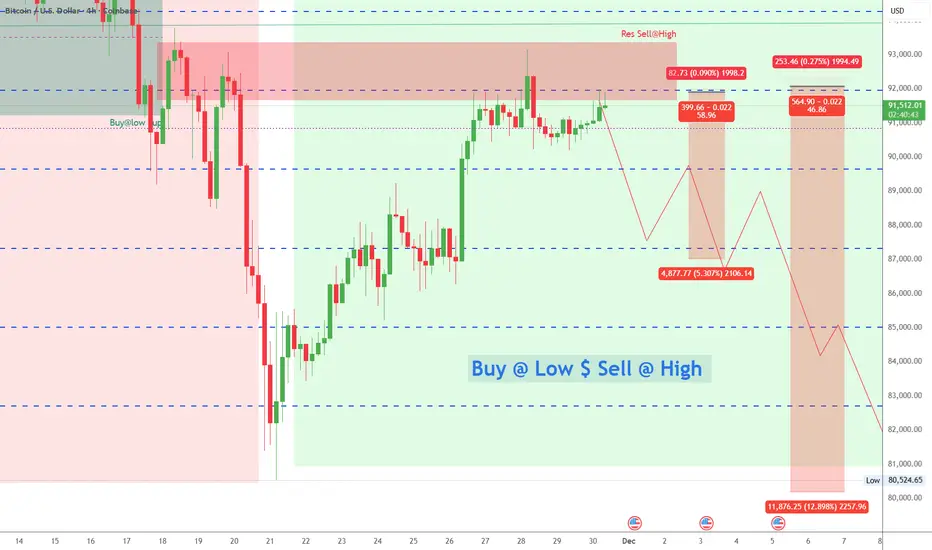
#bitcoin sell@High strategy in this level#btc recent Lower High has been hit at 93k and creating #doubletop, and this is the perfect sell@high strategy with a solid resistance level.
If this Lower high reaches the recent lower low, then we could see the #crypto #btcusd below 80k in the upcoming weeks.
#BTC #forex #supportortandresistance #tradinging #swingtradingstrategies #buy #sellll #EURUSD #goldd #niftyy #s&p #etf #qqq #iwm #future #options #longterm #btc #forex #etf #option #money #earning #dollars #bitcoin,#btc,#spy,#forex,#bitcoin,#supportlevel,#RESISTANCELEVEL,#TESLA,#S&P500,#NVDIA,#APPLE,#AMAZON,#NIFTY,#META,#RSI,#STOCKMARKET,#SHAREMARKET,#GOLD,#OIL,#SILVER,#INTRADAY,#SWINGTRADE,#LONGTERM,#INVESTMENT,#SELL,#BUY,#BID,#ASK,#MARKET,#INVESTORS,#IWM,#OPTION,#FUTURES,#US,#ALIBABA,#CASH,#CASHFLOW
nifty50, rel,sbi,buyside liquidity,ict,ict ob,ict fvg,ict hindi, FVG, OB, false order block, nifty order block, bank nifty order block, why stop loss hit, nifty sl, nifty tgt,n ifty options,banknifty options, Nifty vix, nifty and bank nifty, Day trading ict, Liquidity ict, BOC, COCH, Breaker Block, ICT BREAKER BLOCK, nifty in discount price, ICTBITCOIN, BTCUSD,#btc,#bitcon, gold, silver, buy, sell,btcusd, spy,iwm,qqq, tesla,appl, google,nvda, amazon,etf, bond,ibkr ,margin,moneymanagment

sell AudusdOur current bias on AUD/USD remains bearish.
Price is showing clear signs of weakness, with momentum favoring the downside. As long as the market continues to respect the current lower-high structure, we expect further selling pressure and the possibility of a deeper retracement toward lower support levels.

xauusd"Precision over prediction. In this video, I break down key institutional zones on XAUUSD using volume, smart money concepts, and multi-timeframe confluence. Every level is backed by logic—not hope. Whether you're scalping or positioning for swing trades, this analysis gives you structure, clarity, and control. No signals. No shortcuts. Just disciplined trading. Watch, learn, and elevate your edge."

AUDUSD FRGNT WEEKLY FORECAST -Q4 | W49 | Y25 |📅 Q4 | W49 | Y25 |
📊 AUDUSD FRGNT WEEKLY FORECAST
🔍 Analysis Approach:
I’m applying Smart Money Concepts, focusing on:
Identifying Points of Interest on the Higher Time Frames (HTFs) 🕰️
Using those POIs to define a clear trading range 📐
Refining those zones on Lower Time Frames (LTFs) 🔎
Waiting for a Break of Structure (BoS) for confirmation ✅
This method allows me to stay precise, disciplined, and aligned with the market narrative, rather than chasing price.
💡 My Motto:
"Capital management, discipline, and consistency in your trading edge."
A positive risk-to-reward ratio, paired with a high win rate, is the backbone of any solid trading plan 📈🔐
⚠️ Losses?
They’re part of the mathematical game of trading 🎲
They don’t define you — they’re necessary, they happen, and we move forward 📊➡️
🙏 I appreciate you taking the time to review my Daily Forecast.
Stay sharp, stay consistent, and protect your capital
— FRNGT 🚀
FX:AUDUSD

GBPUSD FRGNT WEEKLY FORECAST - Q4 | W49 | Y25 |📅 Q4 | W49 | Y25 |
📊 GBPUSD FRGNT WEEKLY FORECAST
🔍 Analysis Approach:
I’m applying Smart Money Concepts, focusing on:
Identifying Points of Interest on the Higher Time Frames (HTFs) 🕰️
Using those POIs to define a clear trading range 📐
Refining those zones on Lower Time Frames (LTFs) 🔎
Waiting for a Break of Structure (BoS) for confirmation ✅
This method allows me to stay precise, disciplined, and aligned with the market narrative, rather than chasing price.
💡 My Motto:
"Capital management, discipline, and consistency in your trading edge."
A positive risk-to-reward ratio, paired with a high win rate, is the backbone of any solid trading plan 📈🔐
⚠️ Losses?
They’re part of the mathematical game of trading 🎲
They don’t define you — they’re necessary, they happen, and we move forward 📊➡️
🙏 I appreciate you taking the time to review my Daily Forecast.
Stay sharp, stay consistent, and protect your capital
— FRNGT 🚀
FX:GBPUSD

EurUsd 30 Nov 2025 Sell PlanEurUsd 30 Nov 2025 Sell Plan
Swept Previous month high,
Market structure shift,
From bullish to bearish.

USDCAD FRGNT RECAP + 4% / + 18 % - Q4 | W48 | Y25 |📅 Q4 | W48 | Y25 |
📊 USDCAD FRGNT RECAP + 4% / + 18 %
🔍 Analysis Approach:
I’m applying Smart Money Concepts, focusing on:
Identifying Points of Interest on the Higher Time Frames (HTFs) 🕰️
Using those POIs to define a clear trading range 📐
Refining those zones on Lower Time Frames (LTFs) 🔎
Waiting for a Break of Structure (BoS) for confirmation ✅
This method allows me to stay precise, disciplined, and aligned with the market narrative, rather than chasing price.
💡 My Motto:
"Capital management, discipline, and consistency in your trading edge."
A positive risk-to-reward ratio, paired with a high win rate, is the backbone of any solid trading plan 📈🔐
⚠️ Losses?
They’re part of the mathematical game of trading 🎲
They don’t define you — they’re necessary, they happen, and we move forward 📊➡️
🙏 I appreciate you taking the time to review my Daily Forecast.
Stay sharp, stay consistent, and protect your capital
— FRNGT 🚀

TSLA: Navigating Key Support and Resistance Levels for Future Mo
Title:
TSLA: Navigating Key Support and Resistance Levels for Future Moves
Greetings, Traders!
🌟 Hello everyone,
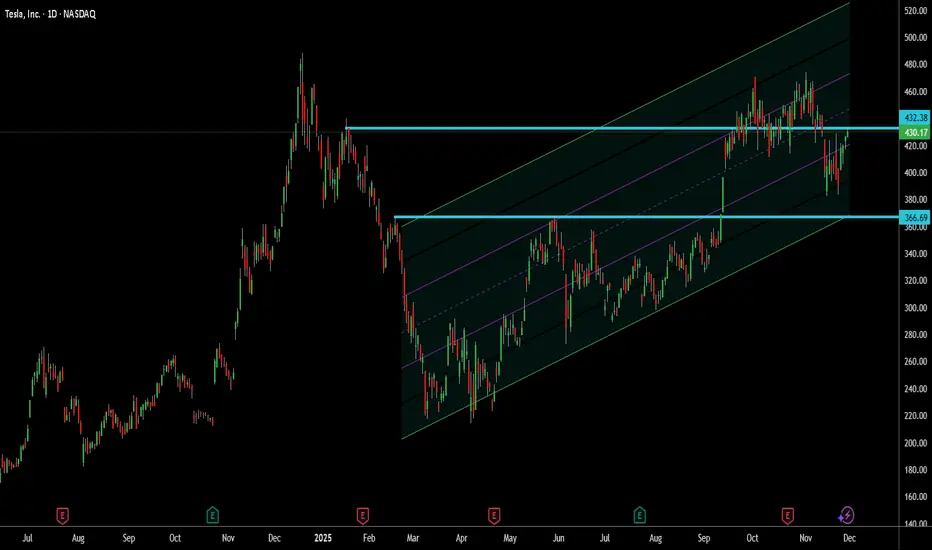
As we analyze Tesla (TSLA), we observe critical support and resistance levels that are shaping the current price action. Understanding these levels can help traders navigate TSLA's potential movements effectively.
NASDAQ:TSLA
Key Observations:
- TSLA has moved significantly from ** 220 ** to ** 500 **, reflecting strong bullish momentum.
- The key support and resistance levels are identified between ** 366 ** and ** 430 **, providing crucial areas for potential price reactions.
- An upward channel with four distinct slopes—inner slope for short-term and outer slope for long-term—helps in identifying optimal entry and exit points.
Technical Analysis:
The price action of TSLA respects the upward channel, indicating that the stock is moving within defined boundaries. If TSLA breaks above the ** 430 ** resistance, the next target is ** 460 **. However, a minor pullback might occur before the upward movement continues.
Fundamental Factors:
While technical levels are crucial, it's also essential to consider Tesla’s fundamental strengths, including innovation, market share, and overall industry trends. These factors contribute to the long-term bullish outlook.
Trading Strategies:
Traders may consider positioning long near the support at ** 366 ** and watching for confirmation of the breakout above ** 430 **. If the price faces bearish pressure, ** 366 ** will serve as a critical support level.
In Conclusion:
With TSLA navigating key support and resistance levels, traders should stay alert to potential breakouts and pullbacks. By leveraging the channel slopes and maintaining a disciplined approach, traders can capitalize on the opportunities ahead.
Engage with Us:
🟢 If you find this analysis insightful, please give it a LIKE.
🟡 Don’t forget to FOLLOW for more updates.
🔵 SHARE with fellow traders who might benefit from this information.
🔴 Feel free to COMMENT with your thoughts and insights!
Your active participation enriches our trading community, fostering knowledge exchange and collective growth. Share your feedback and ideas in the comments below or by boosting this post.
Looking forward to connecting with you in the next post.
Happy trading!
NIFTY 50: Navigating the Past Year’s Volatility for Future Gains
Title:
NIFTY 50: Navigating the Past Year’s Volatility for Future Gains
Greetings, Traders!
🌟 Hello everyone,
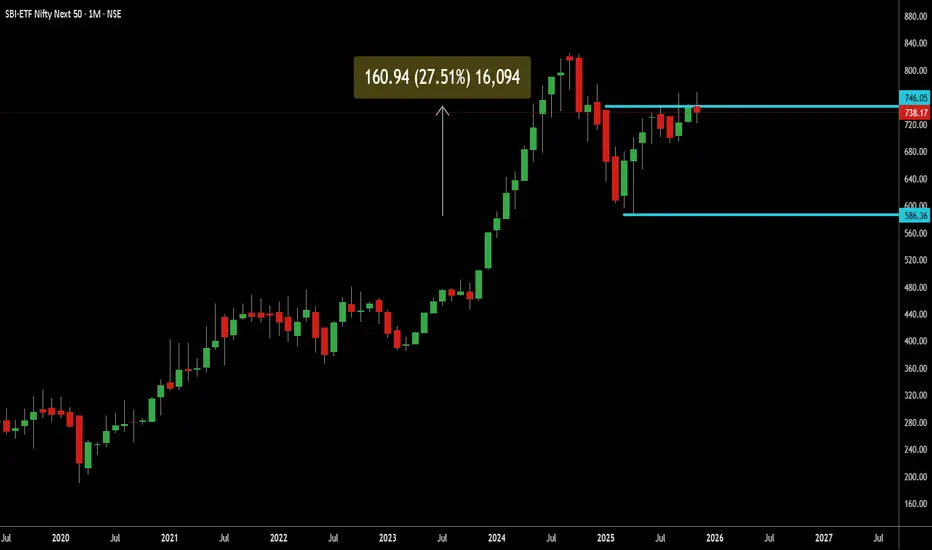
Over the past year, NIFTY 50 has shown significant volatility, with a notable decline and subsequent recovery. Understanding this movement can help traders make informed decisions for future opportunities.
$NIFTY50
Key Observations:
- From January to the present, NIFTY 50 experienced a fall of approximately **27.51%**, dropping from **738** to **586**.
- Many traders who entered positions in January may feel that returns have been stagnant, but the key is to recognize the value of averaging down during market corrections.
- By strategically adding to positions during declines of **10-15%**, traders can effectively lower their average cost basis, setting the stage for stronger returns as the market recovers.
Technical Analysis:
The current price of NIFTY 50 stands at **746**, and technical indicators suggest that there is potential for further upside. A move towards **840** is likely, and beyond that, the index could continue climbing higher. This indicates a promising upward trend in the longer term.
Fundamental Factors:
While technical patterns guide short-term strategies, fundamental factors such as economic growth, corporate earnings, and macroeconomic conditions support the long-term bullish outlook for NIFTY 50. A consistent **15% CAGR** over time can contribute significantly to wealth accumulation.
Trading Strategies:
To capitalize on these insights, traders may consider adopting a disciplined approach:
- Averaging down during market dips to reduce cost basis.
- Holding positions for the long term to benefit from the market’s recovery and growth.
- Monitoring key resistance levels, such as **840**, and preparing for further upside.
In Conclusion:
NIFTY 50’s past year of volatility highlights the importance of patience and strategic investment. By leveraging market dips and maintaining a long-term perspective, traders can achieve substantial growth and build wealth over time.
Engage with Us:
🟢 If you find this analysis insightful, please give it a LIKE.
🟡 Don’t forget to FOLLOW for more updates.
🔵 SHARE with fellow traders who might benefit from this information.
🔴 Feel free to COMMENT with your thoughts and insights!
Your active participation enriches our trading community, fostering knowledge exchange and collective growth. Share your feedback and ideas in the comments below or by boosting this post.
Looking forward to connecting with you in the next post.
Happy trading!
XAUUSD: Will It Continue to Decline? We have been receiving long profit signals for a consecutive week, and I believe all of you have already gotten them. The market has once again validated my view by breaking through the 4200 level, allowing us to reap substantial profits.
Next week, gold is expected to enter a correction phase and may decline to test the support level around 4160-4180. If you still have short orders in your account, this will be your final chance to close them.
I will send out accurate trading signals as soon as the market opens next week—don’t miss out.

PRO Relief Rally? Price has been locked in a persistent downtrend for over a year, showing little relief. However, November’s candle tested a key demand zone and attracted a strong bid. This reaction suggests the downtrend may be nearing completion. While we don’t yet have full confirmation of a trend reversal, the risk‑to‑reward profile is compelling.
Trade Scenario
• Keep the approach straightforward: the initial target sits at the yearly S1 pivot.
• Should price break through that level with conviction, the next objective would be the 50% retracement zone. Projected from the start of the downtrend and November low.
Should the November low give way, expect a sharp push lower. If this move is followed by a monthly bullish hammer or doji candle close above the pivot, the setup remains valid with an even more favorable risk‑to‑reward dynamic.

