BTC Reacts at $60K — Relief Rally Toward $80K Before Next Dump?Bitcoin has now re-entered the major trading range formed between February 2024 and November 2024 — a zone that has historically acted as a high-reaction area. As expected, price has once again responded strongly upon reaching this range.
Today’s price action confirms this reaction. BTC is printing a strong bullish (green) candle right around the $60,000 support, signaling active buyer defense and a short-term rebound from this key level.
However, it’s important to keep the higher-timeframe structure in mind. Despite the bounce, market structure remains bearish, and this move should be viewed as a corrective rally, not a trend reversal.
If this relief rally continues, price is likely to target the $80,000 region, a major confluence zone defined by:
A large Fair Value Gap (FVG) overhead
The 0.5 Fibonacci retracement
Prior structural resistance
This area is expected to act as strong resistance, where selling pressure could resume. A rejection from this zone would open the door for continuation of the broader bearish trend, with $55,000 remaining the key downside target.
One factor supporting the current rebound is volume behavior. Spot market buying (BTCUSDT) is significantly stronger than perpetual futures volume, suggesting that this move is driven by real demand rather than leveraged speculation. Historically, this type of imbalance often fuels temporary relief rallies, even within bearish market conditions.
Key takeaway:
➡️ Short-term bullish reaction
➡️ Medium-term corrective rally
➡️ Higher-timeframe trend still bearish
Gann Fan

Gann time and price HBR The swing high is at 333.8. Price then fell to the swing low at 144 in 332 days. You can see the symmetry in price and time.
I have marked the square up on the chart back at 333.8 in 335 days.
Price has a lot of work to do in next 90/100 days. This falls in line with ganns idea of price acceleration in the last phase of swing.
The company has recently been on a purchasing spree to expand its reach into the gulf of America.
They have also been buying back shares.

Pepe Gann Fann Bottom LevelDoing a quick up and down gann on Pepe shows us the best possible entry:
0.033 to 0.034 as a possible bottom not he weekly.
The move would then takes us to 1/1 of the red downward facing gann for next breakout and TP

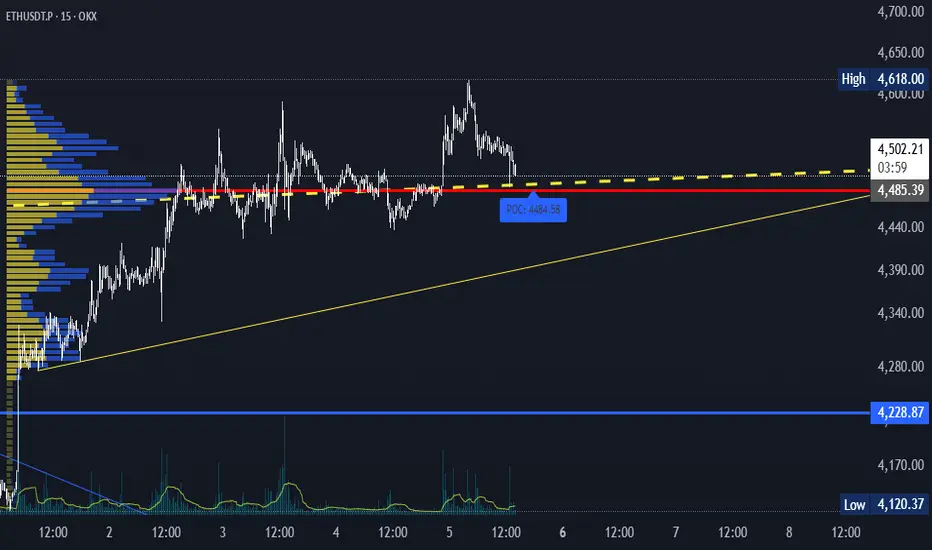
Elloit wave ETH 12/15/2025ETH has been forming a complex correction recently, which could represent either a larger wave (II) or a minor wave 4 within wave (I). This corrective structure is difficult to count precisely; however, as time passes, it appears that the correction has not yet finished.
The recent downward pressure likely marks the end of wave (b) within the Ⓨ wave. This view is further supported by Gann resistance, leading me to expect that the correction may complete around the 3,450–3,500 level.

Btc 105kClick bait title. Harmonic 5/0 pattern. Continuation pattern of downtrend. 74k there is a gap only one not filled on btc chart. So guessing 74k is big decision until closed.

PLAN THE TRADE. TRADE THE PLAN. IT'S THIS SIMPLE !📅 Q4 | W50 | D8 | Y25 |
📊 EURGBP FRGNT FULL TRADE BREAKDOWN - TAKE PROFIT + 2%
🔍 Analysis Approach:
I’m applying Smart Money Concepts, focusing on:
Identifying Points of Interest on the Higher Time Frames (HTFs) 🕰️
Using those POIs to define a clear trading range 📐
Refining those zones on Lower Time Frames (LTFs) 🔎
Waiting for a Break of Structure (BoS) for confirmation ✅
This method allows me to stay precise, disciplined, and aligned with the market narrative, rather than chasing price.
💡 My Motto:
"Capital management, discipline, and consistency in your trading edge."
A positive risk-to-reward ratio, paired with a high win rate, is the backbone of any solid trading plan 📈🔐
⚠️ Losses?
They’re part of the mathematical game of trading 🎲
They don’t define you — they’re necessary, they happen, and we move forward 📊➡️
🙏 I appreciate you taking the time to review my Daily Forecast.
Stay sharp, stay consistent, and protect your capital
— FRNGT 🚀

FTSE This chart shows a clear change.
The upside swing has lost the 90 degree angle.
The bearish swing was volatile.
The bullish swing was, until it wasnt.
Clear 4hr change in delivery.
Momentum lost .

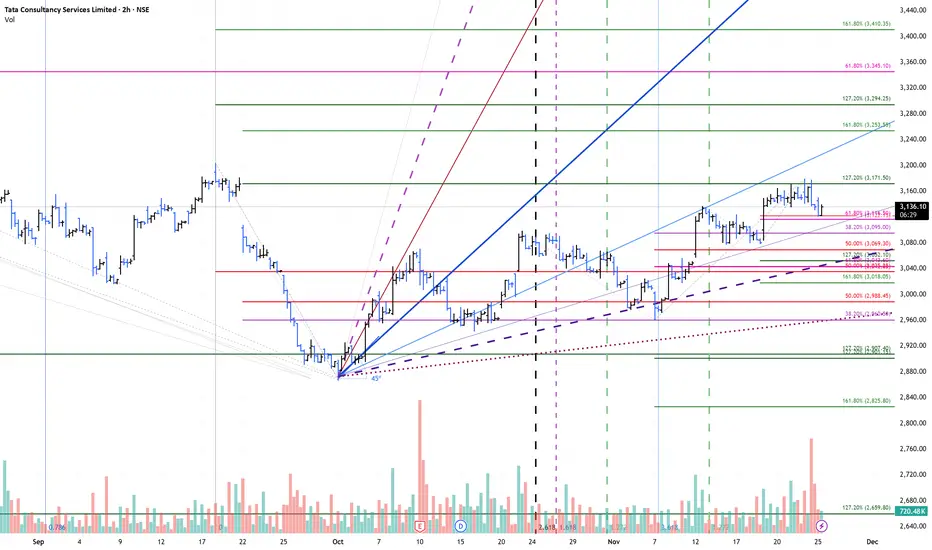
TCS - Daily view - continue to scroll !TCS - Daily view - continue to scroll ! ; monitoring to check if it continue to build base from here ?

Gann possessed me and made me publish thishe visits me in my dreams and gives me trade ideas. I love you Gann

JSW Infrastrture - Daily/Weekly - JSW - Weekly / Daily levels, post upside termination at 350 backing off down to the cluster zone, watching to see if it could clear declining symmetry ?

TCS - 2hour Chart with Price Cluster levels to watch .TCS - 2 hour chart price cluster level along with GANN Fans, initial reaction back down from extension.
BTC Elliott wave 11/18/2025The BTC correction might have ended by the Gann fan support and finished Elliott wave . We are now going to the last higher high before the real huge corrective for BTC after next higher high.

EURUSD FRGNT Daily Forecast -Q4 | W47| D18 | Y25 |📅 Q4 | W47| D18 | Y25 |
📊 EURUSD FRGNT Daily Forecast
🔍 Analysis Approach:
I’m applying Smart Money Concepts, focusing on:
Identifying Points of Interest on the Higher Time Frames (HTFs) 🕰️
Using those POIs to define a clear trading range 📐
Refining those zones on Lower Time Frames (LTFs) 🔎
Waiting for a Break of Structure (BoS) for confirmation ✅
This method allows me to stay precise, disciplined, and aligned with the market narrative, rather than chasing price.
💡 My Motto:
"Capital management, discipline, and consistency in your trading edge."
A positive risk-to-reward ratio, paired with a high win rate, is the backbone of any solid trading plan 📈🔐
⚠️ Losses?
They’re part of the mathematical game of trading 🎲
They don’t define you — they’re necessary, they happen, and we move forward 📊➡️
🙏 I appreciate you taking the time to review my Daily Forecast.
Stay sharp, stay consistent, and protect your capital
— FRNGT 🚀
OANDA:EURUSD

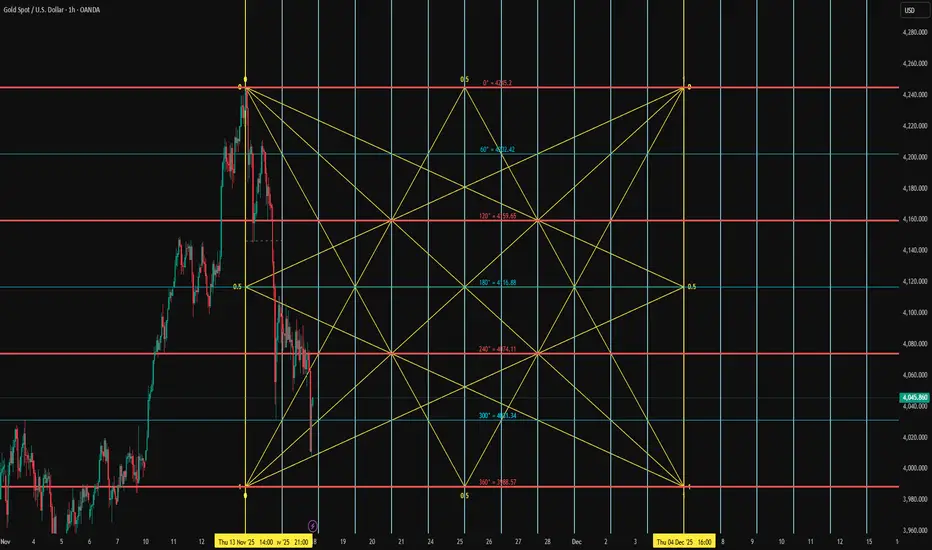
Key Gold Reversal Times for Daily Trading“Time-based analysis focuses on identifying the specific times when the market is likely to reverse or show strong movement. Instead of analyzing only price levels, it studies cycles, timing patterns, and repetitive market behaviors to predict when major or minor turning points may occur.”
BTC "Next infinity Movement"Geberated BY | 〽️YSignal Trader :
BTC "Next infinity Movement" achived its interaction with the intersections of GAN FAN & some trend lines

ZEC Expected to Cool DownAnalysts predict a possible sharp retrace after ZCash's 1,500% surge.
Let's imagine how the price might evolve if it were to retest the historical trend line, Fib .382, confident that ZEC is poised for a 5 digits price in the medium term.

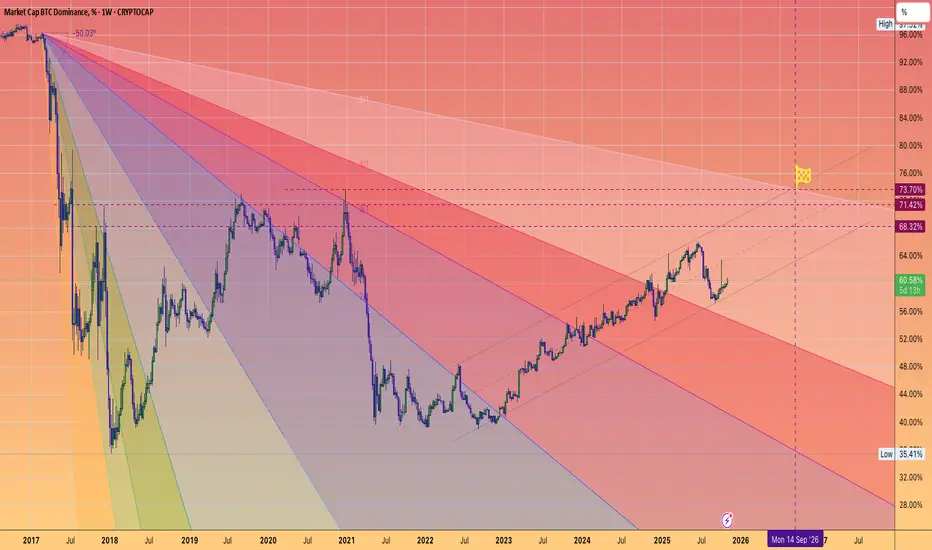
BTC.D May not TOP until next September!Despite alt/BTC pairs looking battered
**Capitulation is likely not complete**
Most Altcoins remain in downtrends v BTC
Timeline:
2025: grind to 63-65%
2026 Final Push to 73%?
Altcoins to seek relief once this finally turns around.
You may be able to start DCA'ing BTC as early as next March in preparation to buy beaten down quality Alts...
focusing on ETH, SOL, and 2's that have usage... not simply clogging up the landscape of empty chains.
Ep. 4 - BTC Prediction By Channels, Secret Fib & Unique Gann FanBitcoin Price Prediction Using Channels, Fibonacci & Gann Fan | Signal & Structure Episode 4
In this concise yet powerful episode, we combine three advanced technical analysis tools to identify high-probability support zones for Bitcoin's current correction. This multi-confluence approach demonstrates how stacked logarithmic channels, Fibonacci retracements, and Gann fans work together to pinpoint critical price levels.
Techniques Demonstrated:
1. Channel Validation Theory
- Proves that any trend line can become a valid channel
- Shows how to convert the COVID crash to bear market bottom trendline into a working channel
- Demonstrates perfect alignment with historical tops
2. Stacked Channel Refinement
- Creates a smaller channel where the top touches the midline of the larger channel
- This subdivides the original channel into quarters
- Provides additional confluence levels for support/resistance
3. Fibonacci Retracement Application
- Maps the key retracement levels from recent bottom to top
- Focuses on the "Golden Pocket" (0.618-0.786)
- Identifies 0.702 as the Optimal Trade Entry (OTE) level
4. Gann Fan on Logarithmic Scale (Unique Technique)
- Anchors 45-degree angle from the peak
- Aligns Gann Fan 1x1 line with the 45-degree angle
- Uses Gann lines to track momentum decay:
- 1/8 → 1/4 → 1/3 (bearish progression)
- 1/1 as recovery signal
- 8/1 as ultimate resistance breakout
Key Confluence Zone Identified:
The analysis reveals a critical support box between:
- 0.618 - 0.786 Fibonacci levels
- Validated by 1/3 Gann Fan line
- Supported by stacked channel structure
This triple confluence creates a high-probability reversal zone where multiple technical factors align.
Trading Insights:
Current Market Position:
- Price following bearish momentum path along Gann lines
- Moving from 1/8 toward 1/3 line
- Range-bound action expected until 1/1 line reclaimed
Recovery Signals to Watch:
- Breaking above 1/1 Gann line (45-degree angle) = trend recovery
- Ultimate bullish confirmation: Breaking 8/1 line
- Support zone provides optimal risk/reward entry area
Technical Setup:
- Timeframe: Weekly chart
- Scale: Logarithmic (essential for both channels and Gann)
- Tools: TradingView's Fib Retracement, Gann Fan, Parallel Channel
This episode demonstrates how combining multiple technical tools on logarithmic scale can identify precise support/resistance zones. The convergence of three independent methods at the same price area significantly increases the probability of a meaningful reaction.
The unique application of Gann Fan on log scale, aligned with the 45-degree angle, provides a momentum roadmap that most traders miss. This technique is particularly powerful for tracking trend strength degradation and identifying potential reversal points.
Feel free to teach out for partnership opportunities. I'm open to provide TA and educational services.

ETH Elliott wave analysis 13/10 /2025In my view, ETH has not yet completed its upside cycle, and the recent decline is simply part of wave (c) within wave (IV).
I believe we are currently in wave (5), specifically within wave 3 of that structure. The reason is that if waves 1 and 3 were corrective ABC structures, then wave C should not exceed 138.2% of wave A, otherwise it would invalidate the b-failure flat pattern—and this limit has already been exceeded, confirming the impulsive nature of the current move.
The Shark harmonic pattern indicates a potential target zone around $5,000–$5,100, which aligns with the requirement for a higher high to complete wave 5. Interestingly, this target also coincides with a Gann Fan resistance level, adding further confluence to this projection.
The invalidation level for this bullish scenario is at $3,800.
A break below this level would suggest that a full bear market structure has already begun.

Continuation of the previous idea based on the Harmonious EnergyThe consolidation phase is coming to an end. The market structure is gradually moving into the next stage of the energy cycle, where a new flow direction is forming.
At the moment, I am observing a continuation of the energy movement with a noticeable manifestation of buyer strength. The key focus is on price behaviour near the resistance level — this is where it will become clear whether buyers will be able to maintain control and continue the upward momentum, or whether the market will enter a redistribution phase.
According to the GPE concept, this moment reflects the transition from balance to energy release — when the accumulated potential turns into real movement.
📌 Observation: price reaction to resistance and confirmation of the flow's strength.
💬 If you have any questions or would like to discuss the idea in more detail, I am always open to dialogue.

Trading idea based on the Harmonious Energy Flow (HEF) conceptAt the current stage, there is a clear manifestation of buyers’ strength, even though the market environment is changing rapidly without any significant price movement. This forms a state of consolidation, where energy is being accumulated for the next impulse.
According to the HEF concept, consolidation represents a transitional phase — the market is searching for balance before initiating a new wave of directional movement. My current expectation is focused on the moment of breakout from consolidation, when the market will reveal the true side of strength.
📌 Main focus: observing how buyers maintain their advantage within this narrow structure and waiting for a signal confirming the exit from balance.
If you find my charting approach interesting, you are welcome to connect and discuss further. I’m open to communication and collaboration.
Would you like me to refine this version for maximum stylistic alignment with TradingView’s publication tone (slightly shorter, more analytical, and visually structured)?
Overview: BTCUSDT 7D overviewHere's a technical analysis of your BTC chart:
📊 **Chart Overview: BTCUSDT 7D (Weekly) Timeframe**
🎯 **Key Patterns Identified:**
**1. Cup & Handle Formation** ☕
- Large cup pattern formed from 2023-2024
- Handle currently forming in the consolidation zone
- Classic bullish continuation pattern
- Breakout target potentially above $150K based on cup depth
**2. Fibonacci Levels** 📐
- Price consolidated around 0.5 Fibonacci retracement (~$125K area)
- Strong resistance at 0.618 level
- Currently testing key support/resistance zone
**3. Trend Analysis** 📈
- **Orange ascending trendline**: Long-term bullish support from 2023
- Price respecting this major uptrend
- Multiple touches confirm validity
**4. TesseractPro Oscillator** 🌊
- Currently showing: 2,159.10 / 1,187.49
- Peaked and now declining
- Suggests momentum cooling off
- Potential bearish divergence forming
**5. Volume Analysis** 📊
- **Vol 3M**: Shows declining volume during recent consolidation
- Lower volume = weaker conviction
- Need volume spike for breakout confirmation
**6. Price Action Zones** 🎯
- **Current Price**: ~$132,965
- **Resistance**: $140K-$150K zone
- **Support**: $110K-$120K area (handle bottom)
- **Critical support**: Orange trendline (~$90K-$100K)
**7. Cycle Analysis** ⏰
- Chart shows projection into 2027
- Suggests multi-year bullish cycle continuation
- Current consolidation is healthy for next leg up
**Scenarios:**
📈 **Bullish Case:**
- Break above $140K with volume confirms cup & handle
- Target: $180K+ based on pattern projection
- Orange trendline holds as dynamic support
📉 **Bearish Case:**
- Break below handle support (~$110K)
- Oscillator weakness continues
- Could retest orange trendline (~$90K-$100K)
- Still bullish long-term if trendline holds
**Current Status:** ⚖️
Price is in consolidation/handle formation. Oscillator weakness suggests potential pullback before next major move up. Watch for volume expansion and trendline support.
**Key Levels to Watch:**
- 🟢 Breakout: $140K+
- 🔴 Breakdown: $110K
- 🚨 Critical: $90K (trendline)
The overall structure remains bullish long-term, but short-term consolidation or pullback is possible given oscillator divergence and low volume. 📊✨

ETH Elliott wave analysis 1/10 /2025In my point of view , The wave (IV) is end and we are going to finish the wave (5).The new wave ①, which has surpassed the top of wave (4) with a strong impulse, indicates that the beginning of wave (V) has likely started. Wave (IV) appears to have formed a b-failure flat, where wave C slightly exceeded 132.8%. Based on the Butterfly harmonic pattern from the higher time frame ETH analysis, the target price is projected to be in the range of $5,900–$6,400.
An alternative count is that the recent abc structure may represent waves 1, 2, and 3, with the current correction being only a minor retracement. This scenario requires further observation. However, the overall Elliott Wave structure still suggests that one more upward wave is needed to complete wave (5).
