GOLD eases as it tests $3,400, eyes US GDP dataOANDA:XAUUSD was broadly steady after a slight decline during the Asian session on Thursday (August 28), currently trading around $3,385/ounce. Investors will focus on the US GDP data, which is expected to cause significant market movements.
The revised second-quarter real gross domestic product (GDP) figure is expected to come in at today (Thursday), with an expected annualized quarterly growth rate of 3.1%, up from the previous reading of 3.0%. The US Bureau of Economic Analysis (BEA) will release its second-quarter GDP data. The BEA said in its preliminary estimate that the US economy grew at an annualized rate of 3%. A downward revision to the GDP data could hurt the dollar and help strengthen gold prices, while an upward revision could have the opposite effect.
Market attention will remain focused on US political tensions and trade war-related news. Following the release of US Q2 GDP data, the trading week will conclude with the release of the personal consumption expenditure (PCE) price index on Friday. The PCE index is the Federal Reserve’s preferred inflation measure and could influence market sentiment regarding a September rate cut.
Technical Outlook Analysis OANDA:XAUUSD
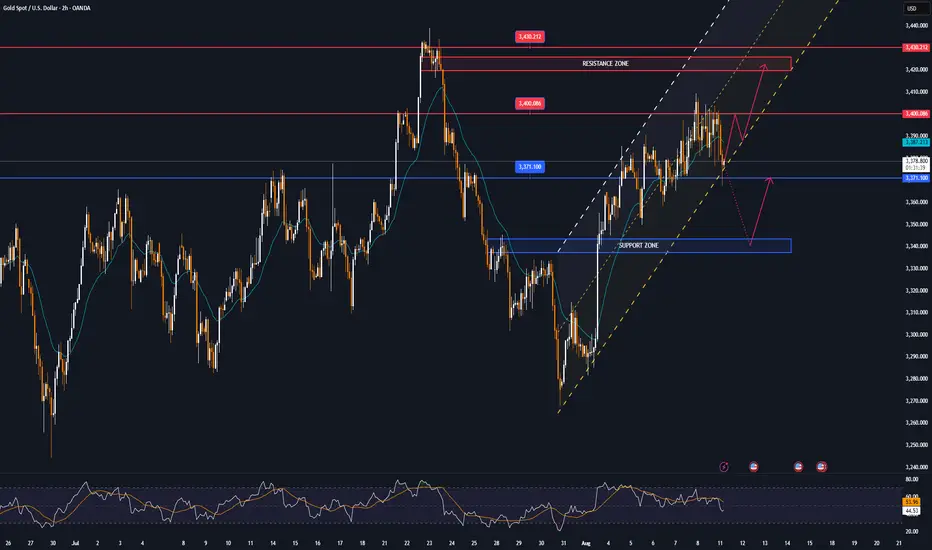
Gold has not been able to break above $3,400 after two sessions of testing, and it is currently retreating slightly from this level with a possible short-term target of $3,371, the 0.236% Fibonacci retracement point, as this is the closest support level currently.
Although gold may fall in the short term, it has also achieved the initial conditions for a possible increase, namely the price action maintained above the EMA21 followed by the RSI maintaining above the 50 mark but the slope is not significant, indicating that the upward momentum is not too strong.
As mentioned to readers, gold is in a sideways accumulation trend, while achieving some of the above short-term bullish conditions. Once gold breaks through the $3,400 mark, it will have the conditions to open a new bullish cycle, with the target then being around $3,430 to $3,450.
During the day, the technical outlook is more inclined towards short-term bullishness, and the notable points will be listed as follows.
Support: $3,371 – $3,350
Resistance: $3,400 – $3,430 – $3,450
SELL XAUUSD PRICE 3430 - 3428⚡️
↠↠ Stop Loss 3434
→Take Profit 1 3322
↨
→Take Profit 2 3316
BUY XAUUSD PRICE 3350 - 3352⚡️
↠↠ Stop Loss 3346
→Take Profit 1 3358
↨
→Take Profit 2 3364
Gc1!!

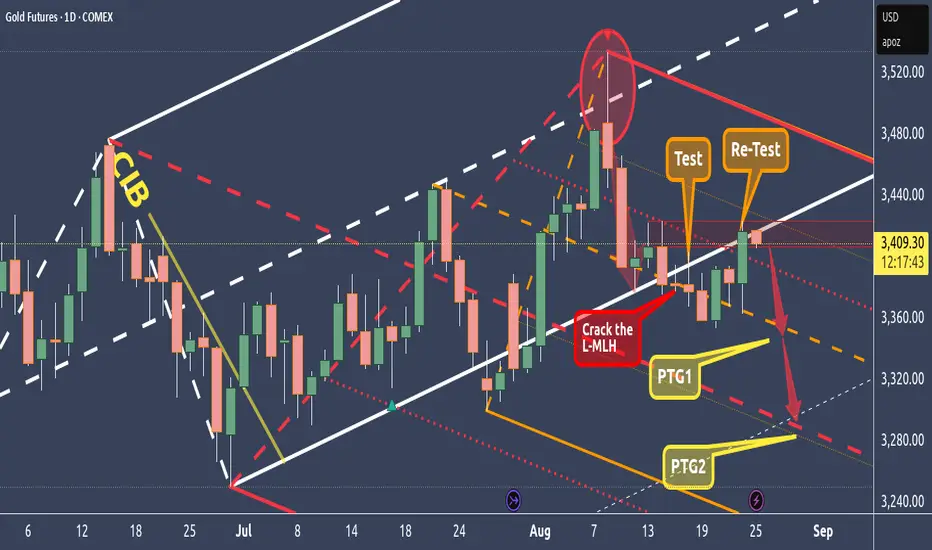
GC - Gold Re-Testing The L-MLH - Short AheadFirst we crack the L-MLH.
Then we got a test and now the re-test.
On a close outside the fork it's a present to short wit stops above somewhere the wicks high.
Profit at the orange Centerline (PTG1) and at the Red Centerline. All in all a wonderful trade with a decent risk/reward.
And if the train leaves without us, NO FOMO please §8-)
GOLD falls nearly $20, as Dollar recovers and market quietSummary: OANDA:XAUUSD fell sharply in Asian trading on Wednesday (August 27), after rising sharply in the previous session. Prices are currently trading around $3,374/oz, down nearly $20 on the day.
OANDA:XAUUSD is retreating from a two-week high near $3,400/oz after hitting that high on Wednesday morning. However, concerns about the Federal Reserve's autonomy and the latest U.S. tariff threats could ease the downward pressure on gold.
The US Dollar TVC:DXY rebounded on Wednesday, putting pressure on gold prices. However, the dollar's gains appeared to be limited by concerns about the Federal Reserve and tariffs.
OANDA:XAUUSD may be buying lower as investors look to buy on dips. Gold prices had earlier surged to a two-week high on Tuesday as US President Donald Trump announced the firing of Federal Reserve Governor Tim Cook, shaking investor confidence in the Fed's independence and boosting demand for safe havens.
Additionally, Bloomberg reported on Tuesday that U.S. President Trump has threatened to impose new tariffs and export restrictions on advanced technologies and semiconductors in retaliation for other countries imposing digital services taxes on U.S. tech companies. Trump’s recent trade brinkmanship has reignited tariff uncertainty among U.S. trading partners. Earlier this month, shortly after concluding negotiations with dozens of partners on tariffs targeting specific countries, Trump announced new tariffs on a range of imported products. Last week, he said he would impose new tariffs on imported furniture.
Technical Outlook Analysis OANDA:XAUUSD
Gold has yet to reach its upside target at the $3,400 base level, but has come under some pressure as it approaches this level and has declined in early trading today. Spot gold is currently trading at $3,376, close to the 0.236% Fibonacci retracement level. After breaking above the 0.236% Fibonacci retracement level, this Fibonacci level now acts as the closest technical support, below which gold could retest the 21-day EMA at around $3,350.
As mentioned to readers throughout the past publications, the overall trend of gold is still in a sideways accumulation phase. This is shown by the fact that RSI is hovering around 50, showing that the market sentiment is still hesitant in terms of momentum. When gold has enough conditions for a long-term trend, I will update readers quickly, but currently in the short term, gold has some technical factors supporting the possibility of price increases, with support at Fibonacci 0.236% and EMA21 and RSI above 50.
However, short-term open positions should still be prioritized during this period of sideways accumulation, along with the notable points that will be listed as follows.
Support: 3,371 – 3,350 USD
Resistance: 3,400 – 3,430 USD
SELL XAUUSD PRICE 3430 - 3428⚡️
↠↠ Stop Loss 3434
→Take Profit 1 3322
↨
→Take Profit 2 3316
BUY XAUUSD PRICE 3350 - 3352⚡️
↠↠ Stop Loss 3346
→Take Profit 1 3358
↨
→Take Profit 2 3364

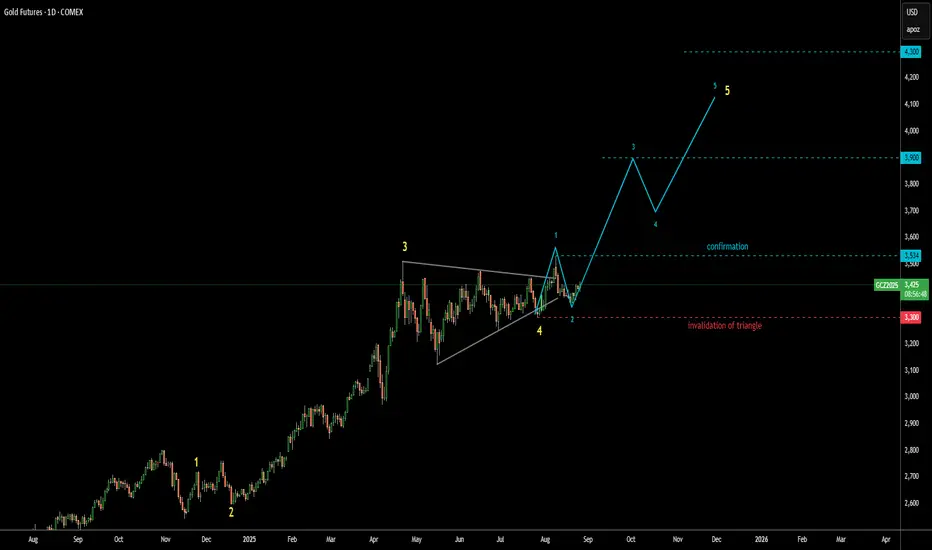
Gold Update 26AUG2025: Bullish Confirmation Above $3,534 The gold futures price has made a U-turn as it didn't trigger Triangle's invalidation at $3,300
This bounce back could be a harbinger of wave 3 within the larger degree wave 5
It will be confirmed once upmove breaks above the top of wave 1 beyond $3,534
I erased the complex correction scenario as the price might be taking off right now
I added the breakdown of the upcoming large wave 5 into smaller 5 waves inside
Target range remains intact between $3,900 and $4,300
GOLD spikes after Trump's move, with technical conditionsOANDA:XAUUSD surges after Trump's move, US President Donald Trump decided to fire Federal Reserve Governor Lisa Cook over allegations that she falsified mortgage records. The news affected the US Dollar index to fall sharply in early Asian trading on Tuesday (August 26), while spot gold prices rose nearly 35 dollars.
On Monday evening local time, US President Trump posted a letter to Federal Reserve Governor Cook on the social media platform Truth Social, stating that he would remove Federal Reserve Governor Cook from his position, effective immediately.
Trump stated in the document: "By virtue of the authority vested in me under Article II of the United States Constitution and the Federal Reserve Act of 1913, as amended, I hereby order to immediately remove Mr. Cook from his position on the Board of Governors of the Federal Reserve System.
Given Mr. Cook’s fraudulent financial conduct and potential criminal conduct, I have no confidence in his integrity.
At the very least, these actions expose his serious negligence in financial dealings and call into question his competence and credibility as a financial regulator.”
“The American people must have full confidence in the integrity of those who set policy and oversee the Federal Reserve,” Trump said. “Given his fraudulent and even criminal conduct in financial matters, they cannot have that confidence, and I have no confidence in his integrity.”
The move comes after the U.S. Justice Department said it plans to investigate Cook after Federal Housing Finance Agency Director Bill Pulte filed criminal charges alleging possible mortgage fraud.
Bloomberg News reported that the investigation is the latest in a series of moves by the Trump administration to increase regulatory scrutiny of Democratic figures and put pressure on the Federal Reserve.
TVC:DXY Falls Sharply, Gold Price Spikes Nearly $35 in Short Term
The US Dollar Weakens Against All Major Currencies After Trump Fires Federal Reserve Governor Cook. Bloomberg said Trump's move has undermined people's confidence in the US Dollar, the world's reserve currency.
Cook’s departure is bad for the Dollar as it opens the door for President Trump to appoint a new governor who may be more inclined to cut interest rates. This further challenges the independence of the Federal Open Market Committee (FOMC), the cornerstone of the Dollar’s safe-haven status, and this could lead to further sell-offs in the Dollar, and of course, gold, which is directly correlated to the Dollar, will receive support from this.
Technical Outlook Analysis OANDA:XAUUSD
Gold briefly surged above the 0.236% Fibonacci retracement level after the news but has now pared its intraday gains back below the said Fibonacci retracement level.
However, it is also achieving the initial technical conditions for a bullish outlook in the short term with price action above the EMA21 and the Relative Strength Index (RSI) moving above 50, an RSI above 50 with some significant slope would be a reliable signal for momentum support.
In terms of the overall technical picture, gold has not yet established a specific long-term trend with a sideways accumulation state that has lasted for the past few months, depicted by the green rectangle.
Therefore, short-term trades are preferred in the current technical context, and the key points for this trading day are listed below.
Support: 3,350 – 3,310 – 3,300 USD
Resistance: 3,371 – 3,400 – 3,430 USD
SELL XAUUSD PRICE 3407 - 3405⚡️
↠↠ Stop Loss 3411
→Take Profit 1 3399
↨
→Take Profit 2 3393
BUY XAUUSD PRICE 3350 - 3352⚡️
↠↠ Stop Loss 3346
→Take Profit 1 3358
↨
→Take Profit 2 3364
XAUUSD Strong 1D MA100 rebound. Buy.Gold (XAUUSD) has been trading within an Ascending Triangle since its April 22 All Time High (ATH). Shortly after it solidified a Higher Lows trend-line as its Support with a 1D Body Candle Resistance Zone, limiting any upside break-out.
Last Wednesday it hit and rebounded on its 1D MA100 (green trend-line) for the 2nd time in 1 month, showing strong resilience and the presence of a short-term Demand Zone. The last Lower High contact was made a little above the 0.9 Fibonacci retracement level. This gives us a 3420 short-term Target, which is marginally below the Resistance Zone.
-------------------------------------------------------------------------------
** Please LIKE 👍, FOLLOW ✅, SHARE 🙌 and COMMENT ✍ if you enjoy this idea! Also share your ideas and charts in the comments section below! This is best way to keep it relevant, support us, keep the content here free and allow the idea to reach as many people as possible. **
-------------------------------------------------------------------------------
Disclosure: I am part of Trade Nation's Influencer program and receive a monthly fee for using their TradingView charts in my analysis.
💸💸💸💸💸💸
👇 👇 👇 👇 👇 👇

Market revolves around FED and Trump, GOLD is limitedFederal Reserve Chairman Jerome Powell's speech at the Jackson Hole symposium on Friday was the focus of market attention this week.
Powell's unexpectedly dovish remarks reinforced market hopes for a September rate cut. As a result, the US Dollar Index fell sharply on Friday, reversing the upward trend of the first four trading days of the week. Moreover, Friday's strong gains also pushed gold prices to a nearly $36 surge for the week.
On Friday (August 22), the US Dollar fell sharply and gold prices soared due to dovish comments from Federal Reserve Chairman Powell
Federal Reserve Chairman Jerome Powell hinted at future rate cuts in his highly anticipated speech at the Jackson Hole central bank's annual symposium, saying a rate cut "may be necessary" if conditions warrant. While he did not promise a rate cut, Powell said changes in the risk landscape could require adjustments to the Fed's policy guidance.
“The stability of the unemployment rate and other labor market indicators allows us to be cautious as we consider changes to the stance of policy,” Powell said Friday. “However, changes in the baseline outlook and the balance of risks may make it appropriate to adjust the stance of policy while policy remains within its narrow range.”
The remarks attempted to strike a delicate balance, acknowledging rising risks to the job market while warning that inflation pressures remain. Powell also stressed on Friday that policymakers must guard against persistent inflation risks from President Donald Trump’s tariffs. He said the impact of tariffs on consumer prices was “now evident,” but there was reason to expect the effects would be relatively short-lived.
Following Powell’s speech, the US dollar fell sharply, gold prices jumped and the yield on the 2-year US Treasury note fell 10 basis points to 3.69%.
Powell’s comments also highlighted the importance of jobs and inflation data ahead of the Federal Reserve’s policy meeting on September 16-17.
The CME FedWatch tool shows that traders are now pricing in a 75% chance of a September rate cut.
Technical Outlook Analysis OANDA:XAUUSD
On the daily chart, gold has recovered from $3,310, which is the first support point in the $3,310 – $3,292 area noted by readers in last week’s weekly edition. However, the temporary recovery is still limited by the 0.236% Fibonacci retracement level, which if gold breaks above this level with price action above $3,371, it will be eligible for further upside with the next target around $3,400 in the short term, more so than $3,430 – $3,450.
Overall, gold is still in a sideways technical state as depicted inside the green rectangle. In case of a sell-off below the 0.382% Fibonacci retracement level, the downside momentum could also be limited by the $3,246 level followed by the $3,228 level at the 0.50% Fibonacci retracement price point. The relative strength index hovering around 50 also shows the market's indecision, it does not give any reliable signal whether the trend is bullish or bearish in terms of momentum.
Looking ahead, gold is primed for a short-term rally, with a break above $3,371 a necessary condition for a new short-term rally, with the following key points to watch.
Support: $3,350 – $3,310 – $3,300
Resistance: $3,371 – $3,400 – $3,430
SELL XAUUSD PRICE 3405 - 3403⚡️
↠↠ Stop Loss 3409
→Take Profit 1 3397
↨
→Take Profit 2 3391
BUY XAUUSD PRICE 3329 - 3331⚡️
↠↠ Stop Loss 3325
→Take Profit 1 3327
↨
→Take Profit 2 3333

Get ready for the week's highlights, track negotiations progressOANDA:XAUUSD prices remained generally stable, in the Asian trading session on Friday (August 22), OANDA:XAUUSD fell slightly to $3,328/oz, equivalent to a decrease of $10 on the day as of the time of writing, extending the sideways accumulation.
The focus of the week, Jackson Hole
Gold continues to consolidate, with selling pressure holding back gains around $3,350/oz. Market participants await fresh messages from policymakers at the Jackson Hole Symposium.
Today (Friday), Federal Reserve Chairman Powell will speak at the Jackson Hole Global Central Bank Annual Meeting.
If Powell says we will cut rates again in October, November or December, the dollar could weaken and gold could have a chance to rise.
Exclusive Reuters report, tracking the progress of the Russia-US-Ukraine negotiations
Reuters has published an exclusive report in which three sources close to senior Kremlin leaders told Reuters that Russian President Vladimir Putin demanded that Ukraine abandon the entire Donbas region in the east, abandon its ambitions to join NATO, remain neutral and prevent Western troops from entering Ukraine.
Last Friday, Putin met with President Trump in Alaska for the first summit between the United States and Russia in four years.
According to Reuters sources, the nearly three-hour closed-door talks between the two sides were almost entirely devoted to discussing a compromise solution to the Ukraine issue.
Standing next to Trump after the meeting, Putin said the meeting was expected to pave the way for peace in Ukraine, but neither Putin nor Trump revealed the specifics of the discussions. Reuters cited the most detailed Russian account yet of Putin’s proposal for the summit, outlining the outlines of a potential peace deal the Kremlin hopes to see.
According to Russian sources, Putin has made some concessions based on territorial demands he made in June 2024. At that time, he asked Kyiv to give up four regions that Moscow claims as part of Russia: Donetsk and Luhansk (located in eastern Ukraine, collectively known as the Donbas region), as well as Kherson and Zaporizhia in the south.
Reuters also reported that Putin maintained in his new proposal a demand for a full withdrawal of Ukrainian troops from the Donbass regions it still controls. However, they added that in return, Moscow would halt its frontline offensive in Zaporizhia and Kherson.
According to US estimates and open-source data, Russia controls about 88% of the Donbas region and 73% of the Zaporizhia and Kherson regions.
Sources said Putin also maintained his previous demands that Ukraine abandon its NATO membership bid and demanded that the US-led NATO make a legally binding commitment not to expand eastward, impose restrictions on the Ukrainian military and reach an agreement ensuring that no Western troops would be deployed as peacekeepers in Ukraine.
There remains a wide gap between the two sides’ positions. The Ukrainian Foreign Ministry has yet to respond to the proposal.
Technical analysis of OANDA:XAUUSD
Gold has been moving sideways for most of the time, so the technical structure has not changed much and the positions are also kept the same as in the previous publications sent to readers.
During the day, the technical outlook of gold price accumulation sideways will be noticed by the positions listed below.
Support: 3,310 – 3,300 – 3,292 USD
Resistance: 3,350 – 3,371 USD
SELL XAUUSD PRICE 3376 - 3374⚡️
↠↠ Stop Loss 3380
→Take Profit 1 3368
↨
→Take Profit 2 3362
BUY XAUUSD PRICE 3299 - 3301⚡️
↠↠ Stop Loss 3295
→Take Profit 1 3307
↨
→Take Profit 2 3313

GOLD eases after recovering from $3,310, data highlightsOANDA:XAUUSD edged down in Asian trade on Thursday (August 21), after a strong rally in the previous session. The current price is around $3,337/ounce, down 0.32% and around $10 on the day.
OANDA:XAUUSD edged up on Wednesday. Bloomberg News analyzed that US President Trump's call for the resignation of Federal Reserve Board member Tim Cook has raised fresh concerns about the independence of the Federal Reserve, boosting safe-haven demand and causing gold prices to rise.
On the other hand, Bloomberg also reported on Wednesday (August 20) that as gold prices have soared, the illegal gold trade has become one of the largest and fastest-growing illicit economies in the Western Hemisphere, and the U.S. government is facing pressure to step up its crackdown.
According to a report released by the Financial and Corporate Transparency Alliance (FACT) on Wednesday, the boom in illegal gold mining and trading in some South American countries has become a crisis that the United States cannot ignore.
In Colombia and Peru, two major cocaine-producing countries, illegal gold is estimated to generate more revenue for organized crime than the drug trade itself.
The Washington-based financial advocacy group has called on Congress to pass legislation to address the environmental and social impacts of illegal gold mining.
The rise of the illegal gold trade is due to a tripling of gold prices over the past decade and weak law enforcement as authorities remain focused on fighting drug trafficking.
In terms of the day’s data highlights
S&P Global will release preliminary figures for the US manufacturing and services Purchasing Managers’ Index (PMI) for August today (Thursday). This important report could have a significant impact on the direction of gold prices.
Economists expect the preliminary US S&P Global Manufacturing PMI for August to be 49.5, compared to a final reading of 49.8 in July.
In addition, the preliminary reading of the US S&P Global Services PMI for August is expected to be 54.2, compared to a final reading of 55.7 in July.
The July services PMI was 55.7, and if August data shows a sharp decline, the US Dollar could be negatively affected immediately.
On the other hand, if the manufacturing PMI recovers above 50 and the services PMI approaches July levels, the US Dollar could remain strong against other currencies, making it difficult for gold to regain its upward momentum.
Technical Outlook Analysis OANDA:XAUUSD
After receiving support from the $3,310 level, which is the support that readers have been paying attention to throughout the publications during this time, gold has recovered but the upside momentum has also been limited after testing the EMA21 line. Gold is under pressure from the EMA21, temporarily falling slightly but it may retest the $3,310 level in the short term as there is no more notable support than this level at present, followed by the full price point of $3,300.
Personally, I still maintain the view that gold will continue to move sideways and wait for a strong enough fundamental impact to change the overall technical structure.
The factors that show that gold is neutral are that it has not yet achieved the conditions for a long-term trend line, the sideways state is depicted by the green rectangle. Next is the price action clinging to the 21-day moving average, followed by the RSI moving around the 50 level, showing that the market sentiment is also hesitantly neutral without leaning to any particular side.
During the day, the technical outlook of gold price accumulation sideways will be noticed by the positions listed below.
Support: 3,310 – 3,300 – 3,292 USD
Resistance: 3,350 – 3,371 USD
SELL XAUUSD PRICE 3376 - 3374⚡️
↠↠ Stop Loss 3380
→Take Profit 1 3368
↨
→Take Profit 2 3362
BUY XAUUSD PRICE 3299 - 3301⚡️
↠↠ Stop Loss 3295
→Take Profit 1 3307
↨
→Take Profit 2 3313
Gold | Oil | Dollar | Silver | Natural Gas Price Forecast Support & Resistance Guide
Natural Gas NYMEX:NG1! stock Bulls AMEX:UNG
USO NYMEX:CL1! Oil Stock price Forecast
DXY US dollar Stock analysis
Gold COMEX:GC1! XAUUSD Stock price Forecast
Silver XAGUSD stock analysis

Gold Technical Outlook Heading Into Powell's Jackson Hole SpeechIt is without a doubt that Jerome Powell's speech at the Jackson Hole symposium is THE event of the week, and possibly the biggest of the month and quarter. That brings the potential for safe-haven flows into gold as we veer towards this key event. I take a look at gold futures market exposure and key levels for gold futures.
Matt Simpson, Market Analyst and City Index and Forex.com

GOLD hits lowest level since August 1OANDA:XAUUSD fell sharply, hitting its lowest intraday level since August 1. Gold prices fell as US President Donald Trump, Ukrainian President Volodymyr Zelensky and European leaders discussed potential talks with Russia. Safe-haven demand eased as speculation about security in Kiev stoked optimism that the war could end.
Last Friday’s meeting between US President Donald Trump and Russian President Vladimir Putin laid the groundwork for a possible solution.
Trump met with Ukrainian President Volodymyr Zelensky and other European leaders on Monday to prepare for a possible ceasefire and push for a three-way meeting to start talks between Kyiv and Moscow.
Trump said “Putin, Zelensky need to be flexible” and offer Ukraine some security guarantees to prevent another Russian attack. However, Trump has said he will not allow Ukraine to join NATO.
Geopolitical developments suggest that a positive outcome from Trump’s meetings with Putin, Zelensky and European leaders could end the ongoing war. Rumors of a possible de-escalation of the conflict between Ukraine and Russia have weighed on gold, which typically benefits from global uncertainty. Traders are looking to the minutes of the Federal Reserve’s meeting today (Wednesday) and a speech by Fed Chairman Jerome Powell on Friday for guidance on the policy path.
Gold itself does not generate interest, but is traditionally seen as a safe haven in times of uncertainty and tends to perform well in low-interest-rate environments.
According to CME Group’s FedWatch tool, traders are currently pricing in an 85% chance that the Fed will cut rates by 25 basis points in September.
Technical Outlook Analysis OANDA:XAUUSD
Gold is in a key technical position with support noted to readers in the previous issue at $3,310, followed by the psychological point of $3,300 and the 0.382% Fibonacci retracement.
If gold sells below $3,292 it will be in a position to expect a short-term decline, with the target likely to be $3,246 rather than the 0.50% Fibonacci retracement.
Motivationally, the RSI is pointing below 50 and is far from the oversold zone (0-20) suggesting that there is still plenty of room for downside ahead.
At the same time, gold is also under pressure from the EMA21 line, where if gold cannot move above this moving average, it will not have enough conditions to increase in the short term.
During the day, overall, gold is still moving sideways and has not yet had a sustainable trend, it is also in a very important technical area with important supports. And the notable points will be listed as follows.
Support: 3,310 - 3,300 - 3,292 USD
Resistance: 3,350 - 3,371 USD
SELL XAUUSD PRICE 3351 - 3349⚡️
↠↠ Stop Loss 3355
→Take Profit 1 3343
↨
→Take Profit 2 3337
BUY XAUUSD PRICE 3279 - 3281⚡️
↠↠ Stop Loss 3275
→Take Profit 1 3287
↨
→Take Profit 2 3293

GOLD range remains narrow, watch for progress in negotiationsOn Monday (August 18), according to Reuters, US President Donald Trump told Ukrainian President Volodymyr Zelenskiy that the United States would support Ukraine's security in any deal to end Russia's war in Ukraine. However, Reuters said the level of support was still unclear.
OANDA:XAUUSD reacted quite mildly as no real message of sufficient weight was released, and market sentiment remained very hesitant, currently spot gold is trading around $3,335/oz, equivalent to an increase of about $2 on the day.
Tracking the progress of the Ukraine ceasefire talks
Trump made the pledge at a special summit at the White House, where he hosted Zelenskiy and a group of European allies. The pledge came days after meeting with Russian President Vladimir Putin in Alaska.
The comments came months after Trump and Vice President J.D. Vance had a disastrous meeting in the Oval Office, in which he publicly criticized Ukrainian leader Volodymyr Zelensky.
However, Reuters notes that a peace deal appears far from certain. Just before the talks began, the Russian Foreign Ministry ruled out the possibility of deploying NATO troops to help broker a peace deal, further complicating Trump’s proposal.
Both Trump and Zelenskiy have said they hope Monday’s meeting will eventually lead to three-way talks with Putin.
The Kremlin has not publicly endorsed such talks, and it remains unclear whether Putin, whose forces are advancing into eastern Ukraine, is willing to sit down with Zelenskiy or make meaningful concessions.
Trump tweeted late Monday that he had called Putin and was beginning to arrange a meeting between Putin and Zelensky, followed by a three-way summit between the three presidents.
Meanwhile, European leaders have arrived in Washington to support Ukraine and urge Trump to get Putin to agree to a ceasefire before any talks can begin.
Trump had previously supported the proposal but reversed course after meeting with Putin on Friday, agreeing with Moscow’s stance that any peace deal must be comprehensive.
Speaking to reporters in the Oval Office on Monday, Trump said he liked the concept of a ceasefire, but the two sides could negotiate a peace deal while fighting continued.
Technical Outlook Analysis OANDA:XAUUSD
On the daily chart, gold weakened after failing to break above the EMA21 line, which was the near resistance that readers noticed in the previous issue. Gold has also shown signs of a possible short-term decline, but the trend is still not really clear and solid.
Specifically, the Relative Strength Index has fallen below 50, but the slope is insignificant, indicating that the bearish momentum is not strong. This is followed by price action below the EMA21 but not far from this moving average, while still remaining above the psychologically important $3,300 price mark.
If gold does not sell below $3,300, it is likely to have clear conditions for a short-term downtrend, which is generally sideways.
The content of the Trump multilateral meeting, with Ukraine and Europe, will impact market sentiment, and the catalyst is strong enough to break the current structure and hesitation to create a technical trend in the short to medium term.
During the day, with the current position, the gold price still has a technical outlook of sideways accumulation and notable positions will be listed as follows.
Support: 3,310 - 3,300 - 3,292 USD
Resistance: 3,350 - 3,371 - 3,400 USD
SELL XAUUSD PRICE 3376 - 3374⚡️
↠↠ Stop Loss 3380
→Take Profit 1 3368
↨
→Take Profit 2 3362
BUY XAUUSD PRICE 3299 - 3301⚡️
↠↠ Stop Loss 3295
→Take Profit 1 3307
↨
→Take Profit 2 3313
XAUUSD Buy signal on Triangle bottom.Gold (XAUUSD) has been trading within a Triangle pattern, having dropped below its 4H MA50 (blue trend-line) in recent sessions. It is approaching its 1D MA100 (red trend-line), which is the ultimate long-term Support (holding since December 31 2024), which provided the bounce on the previous July 30 Higher Low.
With the 4H MACD printing a bottom formation similar to all buy sequences of the Triangle, it is highly likely that we will see a rebound next. As with the previous Bullish Leg, we expect to test at least the 0.9 Fibonacci retracement level, which is at 3420.
-------------------------------------------------------------------------------
** Please LIKE 👍, FOLLOW ✅, SHARE 🙌 and COMMENT ✍ if you enjoy this idea! Also share your ideas and charts in the comments section below! This is best way to keep it relevant, support us, keep the content here free and allow the idea to reach as many people as possible. **
-------------------------------------------------------------------------------
Disclosure: I am part of Trade Nation's Influencer program and receive a monthly fee for using their TradingView charts in my analysis.
💸💸💸💸💸💸
👇 👇 👇 👇 👇 👇

Technical Analysis for XAUUSD (Gold) Closing Price: $3335.94 (16th Aug 2025, 2:05 AM UTC+4)
Analysis Methods: Japanese Candlesticks, Harmonic Patterns (ABCD, M/W), Elliott Wave, Wyckoff, Gann Theory (Time/Square of 9/Angles), Ichimoku, RSI, Bollinger Bands, VWAP, Moving Averages (MA/EMA/SMA/WMA).
1. Long-Term Trend (Weekly/Monthly)
Elliott Wave:
Gold is likely in Wave 5 of a broader bull cycle (Wave 3 peak at $3200, Wave 4 dip to $2950).
Target: $3450–$3500 if Wave 5 extends.
Gann Price Forecasting:
Square of 9:
√3335.94 ≈ 57.76 → Key resistance at 58² = $3364, support at 57² = $3249.
Break above $3364 opens path to $3400 (psychological level).
Ichimoku (Weekly):
Tenkan/Kijun: Bullish crossover (Tenkan > Kijun).
Cloud: Price above Senkou Span (bullish).
Moving Averages:
Weekly EMA(50): $3200 (strong support).
Swing Outlook: Bullish. Hold longs with trailing stops. Target $3450–$3500.
2. Medium-Term Swing (4H/Daily)
Harmonic Patterns:
ABCD Bearish pattern forming on 4H:
A: $3300 → B: $3350 → C: $3325 → D: $3360–$3370 (potential reversal zone).
Bullish Gartley (M Pattern) on daily chart near $3300 support.
Wyckoff Phase:
Distribution signs above $3330:
Upthrust (false breakout) at $3340 (16th Aug).
Volume fading near highs.
Gann Time Forecasting:
Aug 20–22 (geometric time window) for potential trend reversal.
RSI + Bollinger Bands (Daily):
RSI(14): 68 (approaching overbought).
Price hugging upper BB(20,2), suggesting consolidation.
Swing Trade Setup:
Short near $3360–$3370 (ABCD target) with stop-loss at $3385.
Long near $3300 (Gartley support) with stop-loss at $3280.
3. Intraday Outlook (5M–1H)
Key Levels:
Resistance: $3345 (Gann 1x1 angle), $3360 (Square of 9).
Support: $3320 (VWAP), $3300 (psychological).
Indicators:
Ichimoku (1H):
Tenkan: $3330, Kijun: $3320 → Price above both (short-term bullish).
Cloud: Thin and bullish (no major barriers until $3340).
RSI + Bollinger Bands (1H):
RSI(14): 62 (neutral).
Price testing mid-BB ($3330) → Break below signals pullback.
VWAP + MAs:
VWAP: $3325 (intraday support).
EMA(20): $3332 (dynamic support).
Candlestick Patterns:
16th Aug 4H Candle: Shooting star at $3340 → Bearish reversal signal.
1H Chart: Bearish engulfing below $3335.
Gann Squaring of Price-Time:
Time Cycle: 10:00–11:00 AM UTC+4 (volatility spike).
Price Harmony: $3335 = pivot → Close below $3330 targets $3315.
Intraday Trade Plan:
Sell below $3330 (target $3320 → $3310).
Buy above $3340 (target $3350) if RSI <70.
Stop-Loss: $15–$20 from entry.
Critical Events Ahead:
Gann Reversal Window: Aug 20–22 (watch for profit-taking).
Daily Close above $3350 invalidates bearish ABCD pattern.
Risk Note: Monitor USD strength and Fed policy hints. Use tight stops intraday.
For those interested in further developing their trading skills based on these types of analyses, consider exploring the mentoring program offered by Shunya dot Trade. (world wide web shunya dot trade)
I welcome your feedback on this analysis, as it will inform and enhance my future work.
Regards,
Shunya.Trade
world wide web shunya dot trade
⚠️ Disclaimer: This post is educational content and does not constitute investment advice, financial advice, or trading recommendations. The views expressed here are based on technical analysis and are shared solely for informational purposes. The stock market is subject to risks, including capital loss, and readers should exercise due diligence before investing. We do not take responsibility for decisions made based on this content. Consult a certified financial advisor for personalized guidance.


GOLD rebounds slightly, data supports rate cut expectations, PPIOANDA:XAUUSD rebounded slightly, currently trading around $3,351/oz, positive US inflation data for July reinforced market expectations for a rate cut by the Federal Reserve in September, while a weaker US dollar boosted the appeal of gold.
Mild inflation supports rate cut expectations
Data from the US Bureau of Labor Statistics showed that the Consumer Price Index (CPI) rose 2.7% year-on-year in July, below expectations of 2.8% and unchanged from June.
Core CPI rose 3.1% year-on-year and 0.3% month-on-month, the largest increase in six months.
While core inflation remains above the Federal Reserve’s target, the overall data was interpreted by the market as positive for a rate cut.
The US Dollar Index fell to 98.02, making non-dollar-denominated gold more attractive.
Market data showed traders are betting that the chances of a Fed rate cut in September and December remain high.
Next up, the US will release weekly PPI, retail sales and initial jobless claims data, all of which could influence the policy outlook.
Viewpoint: Rate cuts and political uncertainty pave the way for gold to hit new highs
Uncertainty over the independence of the Federal Reserve and continued central bank buying of gold are key factors supporting gold prices. Demand for gold ETFs grew at its fastest pace since early 2020 in the first half of this year.
If the independence of the Federal Reserve is increasingly questioned, the safe-haven value of gold will increase significantly. Gold is a counterweight to fiat currencies (US dollars), and once investors question the independence of central banks, demand will increase.
Forex Market Volatility and Safe Haven Demand
Recent trade policy uncertainty has added to volatility in global forex markets.
The Indian rupee is nearing a record low against the US dollar, with the Reserve Bank of India selling at least $5 billion to support the exchange rate.
The US dollar has weakened after a brief rally, while the Chinese yuan has remained stable.
The weakening US dollar has somewhat increased the relative appeal of gold, leading to a recovery in safe-haven demand.
Technical Outlook Analysis OANDA:XAUUSD
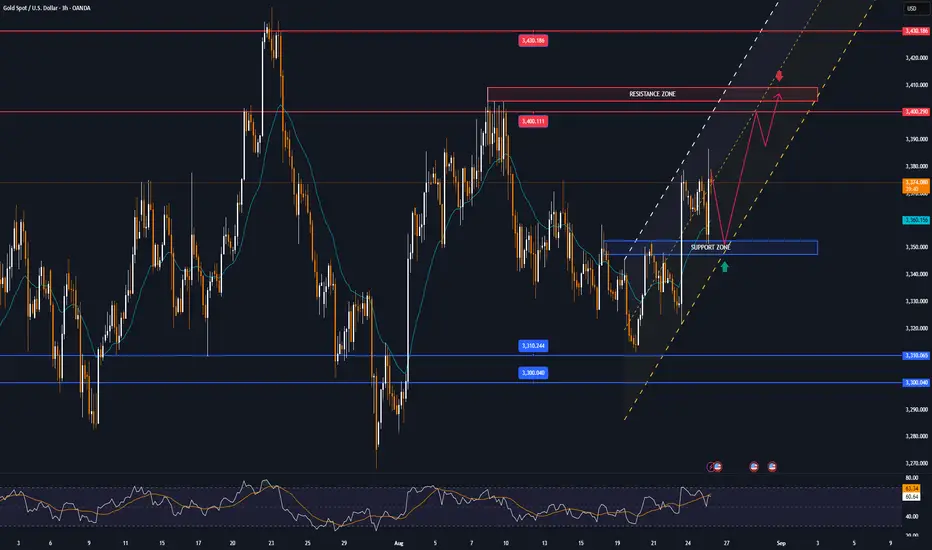
Gold rallied, but the recovery momentum is still limited by the EMA21 as the first resistance, followed by the 0.236% Fibonacci retracement level. If gold breaks above the 0.236% Fibonacci retracement level, it will be eligible to continue to increase in price towards the 3,400 USD price point, opening a new bullish cycle.
However, at the current position, gold price can still retest the $3,310 – $3,300 area due to the pressure from EMA21 and 0.236% Fibonacci retracement. This means that the $3,310 – $3,300 area is an important support area for the uptrend. As long as gold remains above $3,300, it can still increase in the short term, but in case of a sell-off below $3,300, confirmed by a price action below $3,292, it will open the conditions for a downtrend with the next target around $3,246 in the short term.
During the day, the trend of gold prices is generally sideways, with balanced conditions and indicators, described by the Relative Strength Index (RSI) hovering around the 50 level, also showing the market's hesitant sentiment. Personally, I am inclined to the upside, along with that, open long positions should be protected when the 3,300 USD mark is broken below.
Notable positions will also be listed as follows.
Support: 3,310 – 3,300 – 3,292 USD
Resistance: 3,350 – 3,371 – 3,400 USD
SELL XAUUSD PRICE 3391 - 3389⚡️
↠↠ Stop Loss 3395
→Take Profit 1 3383
↨
→Take Profit 2 3377
BUY XAUUSD PRICE 3299 - 3301⚡️
↠↠ Stop Loss 3295
→Take Profit 1 3307
↨
→Take Profit 2 3313
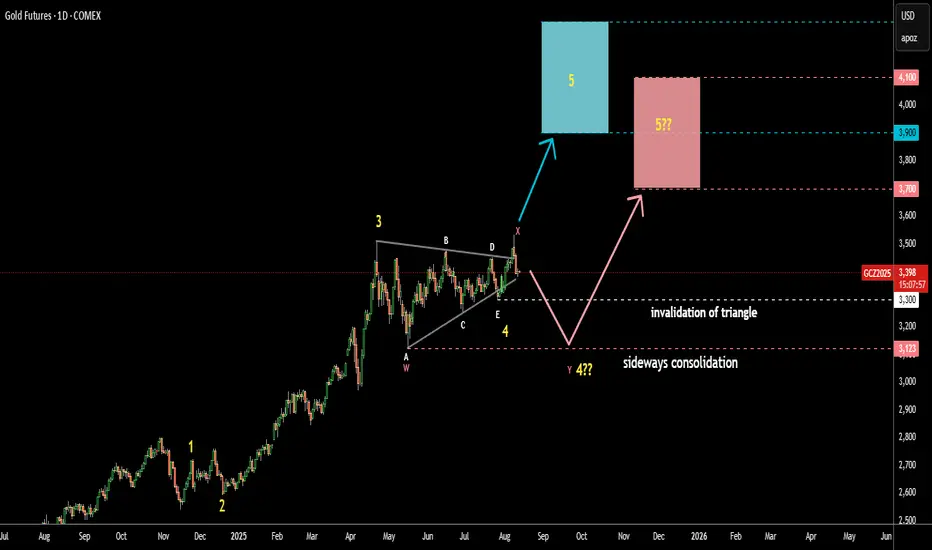
Gold Update 13AUG2025: Risk of Sideways Consolidation Last Friday, August 8, the price failed to progress above the April top as it closed underneath. Hence, there are two possible scenarios from here:
The price could have just completed the first wave up in a larger wave 5, and we may see a retracement. This setup remains valid as long as the price stays above the last wave E of the Triangle at $3,300.
The large sideways consolidation (WXY) might take shape, potentially retesting the bottom of wave A at $3,123. In this case, the target could drop lower, with potential support in the pink box area between $3,700 and $4,100.
Which one do you think plays out?
Who Has Bought the Most GoldSince the inflation hit a high at 9% in 2022, China, Turkey and Poland have been the top 3 buyers of Gold, including in the first two quarters of this year.
It’s not just these countries; many other central banks have been stockpiling gold since (iii) July 2022. Then gold prices were at around US$1,800.
Are central banks still buying as much gold today?
Micro Gold Futures and Options
Ticker: MGC
Minimum fluctuation:
0.10 per troy ounce = $1.00
Disclaimer:
• What presented here is not a recommendation, please consult your licensed broker.
• Our mission is to create lateral thinking skills for every investor and trader, knowing when to take a calculated risk with market uncertainty and a bolder risk when opportunity arises.
CME Real-time Market Data help identify trading set-ups in real-time and express my market views. If you have futures in your trading portfolio, you can check out on CME Group data plans available that suit your trading needs www.tradingview.com

XAUUSD on the verge of price explosion to $3800.Gold (XAUUSD) has been trading within nearly a 2-year Channel Up. Despite the red start to this week, we have had a strong bullish confirmation signal prior, as the price hit and rebounded on its 1D MA100 (red trend-line).
The 1W MA50 (blue trend-line) may be the Channel's natural Support throughout all this time but its the 1D MA100 that every time it's been touched, it initiated the pattern's technical Bullish Legs.
As you can see this always takes place after an Accumulation/ Consolidation period and the minimum rise it has produced was +18.53%.
If we repeat this bear minimum, we are looking at a $3800 Target before the end of the year.
-------------------------------------------------------------------------------
** Please LIKE 👍, FOLLOW ✅, SHARE 🙌 and COMMENT ✍ if you enjoy this idea! Also share your ideas and charts in the comments section below! This is best way to keep it relevant, support us, keep the content here free and allow the idea to reach as many people as possible. **
-------------------------------------------------------------------------------
Disclosure: I am part of Trade Nation's Influencer program and receive a monthly fee for using their TradingView charts in my analysis.
💸💸💸💸💸💸
👇 👇 👇 👇 👇 👇

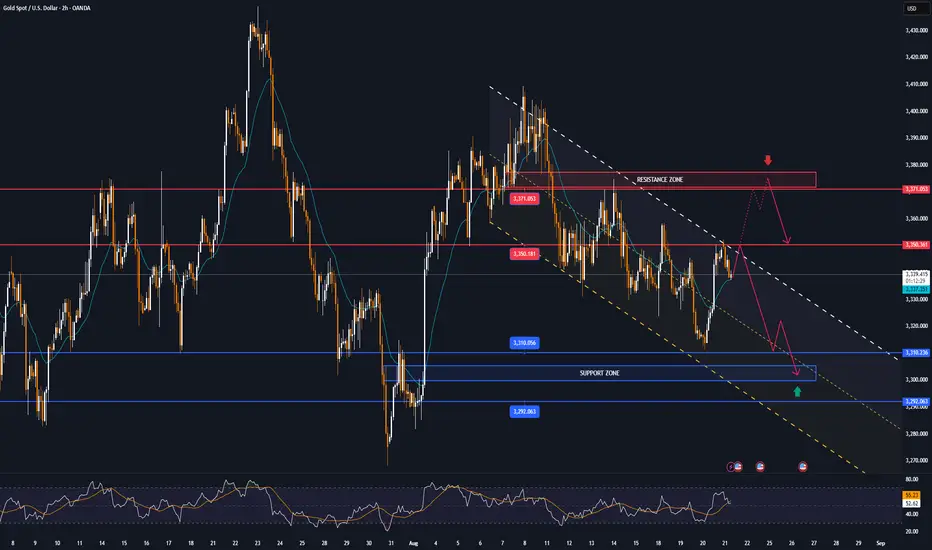
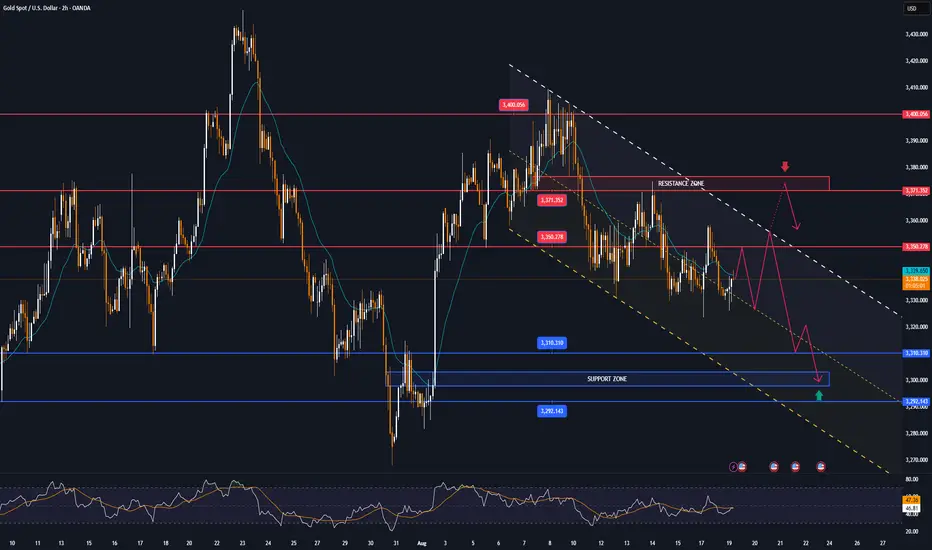
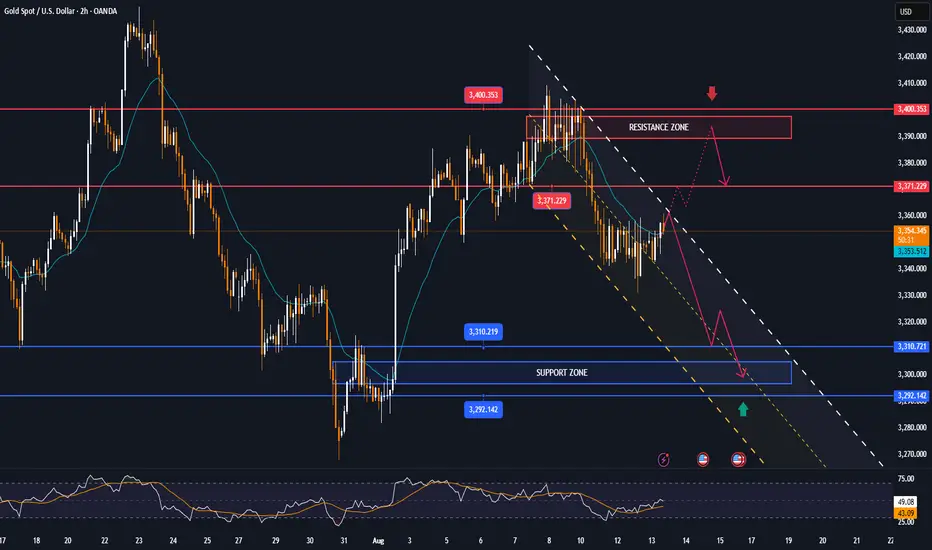
Gold Prices Slide as Geopolitical Calm Sparks Market DivergenceIn a surprising turn of events, gold prices experienced a sharp decline on Monday, reflecting shifting investor sentiment driven by easing geopolitical concerns and evolving market dynamics. The precious metal fell approximately 1.65% overnight, with the current trading price around $3,399 as of this writing. This downtrend marks a significant departure from recent stability, highlighting the complex interplay of global events and market positioning.
Geopolitical Factors and US Dollar Dynamics
The primary catalyst behind the recent slump has been the easing of geopolitical tensions, particularly surrounding the ongoing Ukraine conflict. Investors are increasingly optimistic about the prospects of diplomatic resolution, bolstered by the upcoming US-Russian summit scheduled for Friday. Many market participants believe that this high-level meeting could pave the way for de-escalation and possibly bring an end to the prolonged war, reducing the perceived need for safe-haven assets like gold.
Simultaneously, a surge in US Dollar buying has contributed to gold's decline. As the dollar strengthens, the relative attractiveness of gold diminishes since it is priced in dollars, making it more expensive for holders of other currencies. This dynamic has compounded the downward pressure on gold prices, further amplifying the current bearish momentum.
Market Positioning: Divergence Between Retail and Institutional Traders
A noteworthy aspect of the current market landscape is the divergence observed between different trader groups. Non-commercial traders, often institutional investors and hedge funds, have increased their long positions on gold. This suggests a continued belief in the metal’s potential as a safe haven or a strategic asset. Conversely, retail traders appear to be shifting towards short positions, possibly reacting to the recent price decline or attempting to capitalize on a short-term correction.
This divergence signals a potential imbalance in market sentiment and could hint at an upcoming volatility spike. Typically, such divergences between large institutional positions and retail sentiment can precede significant price movements, either a reversal or a deeper correction.
Technical Outlook and Upcoming Data Releases
Looking ahead, technical analysts are eyeing the possibility of a further spike down in gold prices before any potential rebound. The current trend suggests a bearish movement, but a volatile market environment could see a sharp correction or a "spike down" between today and the end of the week.
Adding to the market's uncertainty are upcoming macroeconomic data releases, notably the Core Consumer Price Index (CPI) month-over-month and the overall CPI figures. These indicators are critical as they influence expectations regarding Federal Reserve policies and can significantly impact dollar strength and precious metals’ prices. A surprise in these data points could either reinforce the bearish trend or trigger a reversal, especially if inflation figures diverge from consensus estimates.
Trading Strategy: Looking for a Long Setup
Despite the current bearish tone, there is a strategic opportunity for traders to position themselves for a potential rebound. Given the divergence and upcoming data releases, many are eyeing a long setup—buying opportunities that could capitalize on a short-term correction or a reversal once market fears subside.
Traders should monitor key support levels around current prices and watch for confirmation signals in price action and volume. A strong bounce or reversal pattern following the release of inflation data could present an ideal entry point for long positions, aligning with the broader view of a potential spike down followed by a recovery.
Conclusion
Gold remains a dynamic asset influenced by geopolitical developments, currency movements, and trader positioning. While the recent decline signals caution, the divergence in trader sentiment and upcoming economic data provide traders with a strategic landscape ripe for potential opportunities. As always, careful analysis and risk management are paramount in navigating these volatile markets.
✅ Please share your thoughts about GC1! in the comments section below and HIT LIKE if you appreciate my analysis. Don't forget to FOLLOW ME; you will help us a lot with this small contribution.

GOLD hesitates, inflation data day in focusOANDA:XAUUSD came under pressure on Monday (August 11) and recovered slightly this morning, Tuesday (August 12). US President Trump made it clear that he would not impose tariffs on gold imports, erasing earlier market concerns about disruptions to the global gold supply chain. Investors are now turning their attention to US inflation data, due to be released this week, to gauge the Federal Reserve's interest rate outlook.
Tariff doubts dissipated
Trump tweeted: "There will be no tariffs on gold!" without providing further details. The announcement brought relief to the global gold market.
As a global gold transit and refining hub, Switzerland was once considered the "biggest victim" but Trump's latest statement essentially eliminated that risk.
Investor focus shifts to inflation
As the tariff uncertainty fades, traders will turn their attention to other market factors, the most important of which is the Federal Reserve's interest rate outlook.
• If US inflation data comes in higher than expected, this could give the Federal Reserve reason to pause its rate cut in September, which would put pressure on gold prices;
• But if the data is mild or even weak, this is expected to support gold prices as market expectations of lower interest rates are further reinforced.
Market Outlook
In the short term, gold is entering a correction phase after tariff concerns are resolved, and price movements may be more influenced by US dollar and inflation data.
If inflation remains low and the US Federal Reserve (Fed) sends a dovish signal, gold prices are expected to maintain high support levels; however, if inflation exceeds expectations and the US dollar strengthens, gold prices may face the risk of a deeper correction.
In the medium to long term, gold remains valuable as a safe haven and an asset allocation channel amid global economic uncertainty and the possibility of low interest rates.
The market expects core CPI to rise to 3.0% year-on-year in July, up from 2.9% in June. The pass-through of tariff costs could spur a rebound in goods inflation.
• If the data beats expectations, the Federal Reserve could delay a rate cut.
• Conversely, a weaker reading would increase the odds of a rate cut in September, with futures currently implying an 87% chance.
Technical Outlook Analysis OANDA:XAUUSD
Gold recovered, operating around the EMA21, showing that the overall market sentiment is still hesitant to wait for a breakthrough impact from the fundamental side.
In the short term, gold is under technical pressure from the EMA21, and the 0.236% Fibonacci retracement level, and for gold to have all the conditions for a continued bullish expectation, it needs to break above the said Fibonacci retracement level, after which the short-term target is the raw price point of 3,400 USD.
If gold continues to break the raw price point of 3,400 USD and operates above this level, the possibility of a new bullish cycle will be opened with the next target at 3,430 USD - 3,450 USD.
On the other hand, gold is still above $3,300, which does not allow the conditions for a bearish cycle to appear. That means as long as gold remains above the original price point of $3,300 and the 0.382% Fibonacci retracement level, it can still increase in the short term.
In case gold sells below $3,300, it will be eligible for a bearish cycle, the target then will be $3,246 in the short term, more than the 0.50% Fibonacci retracement level.
On the momentum front, the RSI hovers around the 50 mark, indicating a hesitant market sentiment, but an upward bend from 50 would be a positive signal for upside potential.
For the day, the overall outlook remains bullish and the key points to watch are listed below.
Support: $3,340 – $3,310 – $3,300
Resistance: $3,371 – $3,400
SELL XAUUSD PRICE 3377 - 3375⚡️
↠↠ Stop Loss 3381
→Take Profit 1 3369
↨
→Take Profit 2 3363
BUY XAUUSD PRICE 3298 - 3300⚡️
↠↠ Stop Loss 3294
→Take Profit 1 3306
↨
→Take Profit 2 3312

Data week, GOLD has all the conditions to riseThis week, global financial markets will look forward to US inflation data for July (CPI, PPI), retail sales data and speeches from several Federal Reserve officials.
These important pieces of information will directly impact expectations for a September rate cut and influence the performance of the US Dollar, gold, crude oil and US stocks.
On the political front, US President Donald Trump's public pressure on the Federal Reserve and recent appointments have raised market concerns about the independence of monetary policy, while escalating tariffs continue to raise the risk of global trade conflicts.
Federal Reserve: Policy Disruption and Dovish Signals Coexist
This week, the Fed kept its target range for the federal funds rate unchanged at 4.25% to 4.50%, but the vote was split, with two officials—Vice Chair Michelle Bowman and Governor Christopher Waller—in favor of an immediate quarter-point rate cut.
TVC:DXY : Technical Pressure and Political Risk
The US Dollar Index (DXY) has fallen to around 98 this week, failing to hold above 100. Technically, a break of the July low of 96.37 could lead to a drop to 95.13 and 94.62. Despite the 10-year Treasury yield rising to 4.285%, the Dollar remains under pressure, reflecting market concerns about political risks in the United States.
If CPI is higher than expected this week, the market may feel like it is moving too fast, which could cause volatility.
Traders generally believe that Trump's tariff policies, public criticism of the Federal Reserve and uncertainty about the fiscal deficit are all weakening the medium- to long-term support for the US Dollar.
Markets will be watching closely to see if the impact of tariffs starts to show in inflation data, and if consumer spending data confirms the economic recovery. A positive reading would reinforce expectations for a rate cut, a positive signal for stocks and gold. An unexpected rise in inflation could slow the pace of Fed easing, weighing on risk assets and supporting the US Dollar TVC:DXY .
Technical Outlook Analysis OANDA:XAUUSD
Gold has been on a long bullish recovery since breaking out and holding above the $3,300 base point, and currently structurally it has not changed much with the uptrend still dominating the daily chart.
Specifically, in the short term, gold is supported by the EMA21 with the target at the $3,400 base point noted by readers in the weekly publication last week has been achieved.
Looking ahead, the horizontal support at the 0.236% Fibonacci retracement will be the nearest support to reinforce the expectation of a continued breakout of gold prices breaking through the $3,400 point towards the $3,430 – $3,450 level.
In terms of momentum, the Relative Strength Index (RSI) has moved above 50 but is still quite far from the overbought zone (80-100), indicating that there is still a lot of room for upside ahead.
Meanwhile, even if gold is sold below the EMA21, the declines are not considered a specific technical trend in the short term, as long as the support levels of 3,310 – 3,300 USD and Fibonacci 0.382% are not broken below.
Finally, in terms of position as well as technical conditions, the gold price on the daily chart currently has a technical outlook leaning more towards the upside and the notable points will be listed as follows.
Support: 3,371 – 3,350 – 3,340 USD
Resistance: 3,400 – 3,430 – 3,350 USD
SELL XAUUSD PRICE 3424 - 3422⚡️
↠↠ Stop Loss 3428
→Take Profit 1 3416
↨
→Take Profit 2 3410
BUY XAUUSD PRICE 3338 - 3340⚡️
↠↠ Stop Loss 3334
→Take Profit 1 3346
↨
→Take Profit 2 3352