GDX

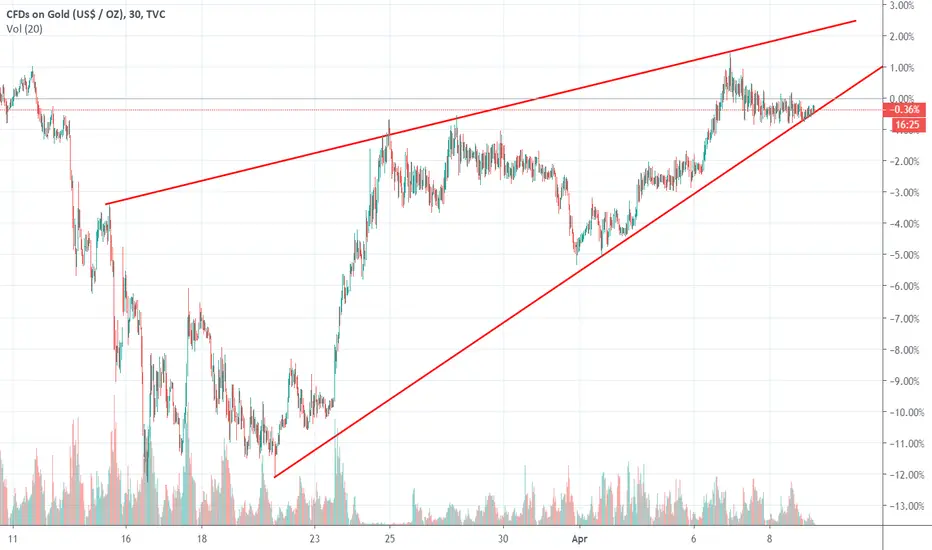
Gold is not giving up yet - breakdown is very possibleIt is dangerously trading right at the trendline, breakdown is very possible

Great setup for $GDX$GDX Nice break-out here.
Be aware that this is a highly manipulated asset, so set your your stops on a closing basis.

Gold (AUD) daily chart- Following orderly uptrend. Gold (AUD) daily chart- Following orderly uptrend.
Yellow line- 20 day simple MA.

Gold Quarterly Closes Above 61.8% Fib Retracement Gold saw a strong quarter with an opening price of $1,521 in January and a closing price today of $1,637 for a +7.6% gain in the first three months of 2020. This comes after price broke above the 38.2% Fibonacci retracement level in the second quarter of 2019 which was a level that acted as resistance during the 6-year bear market after price peaked at an all-time high of $1,923 in the summer of 2011. 2019 saw price break above the critical 50% retracement level which put gold back in a bullish trend, and this past quarter saw the trend confirmed with a push above the 61.8% golden retracement level as well.
The Relative Strength Index(RSI) is indicating bullish momentum behind price with the green RSI line rising above its purple signal line, as well as both lines being above the centerline at the 50 level. An RSI reading above 50 indicates a healthy RSI reading and bullish momentum.
The Price Percent Oscillator(PPO) is indicating bullish momentum as well with the green PPO line above its purple signal line, and both lines rising above the centerline at the 0 level. Neither the PPO line or signal line crossed below the centerline during the 6-year bear market which indicated that no bear trend in momentum ever took hold, and that a bullish pullback instead was taking place.
Current short-term and long-term views on gold remain bullish, especially with the amount of money being printed by central banks across the globe as they continue to fight the economic slowdown caused by the coronavirus. The more they print, the more they’ll devalue their respective currencies, the better gold will perform. It’s still my opinion that gold remains on track to test its all-time high sometime this year with the potential to create a new all-time high.

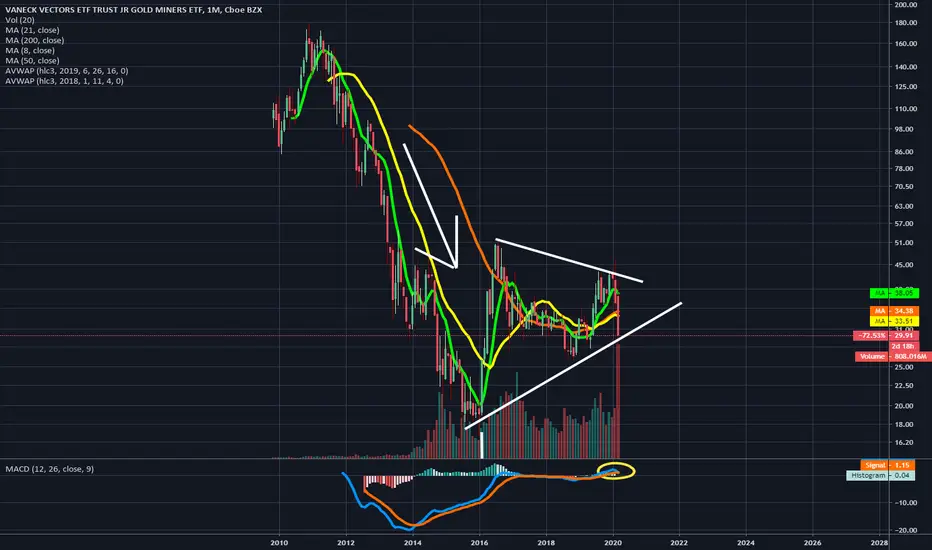
GDX and GDXJ to the toiletAMEX:GDX AMEX:GDXJ are headed down to the toilet. Symmetrical triangle is a continuation of the previous trend, which is downward. Target is down around $5 or less.
Gold is a lot different from the gold miners.
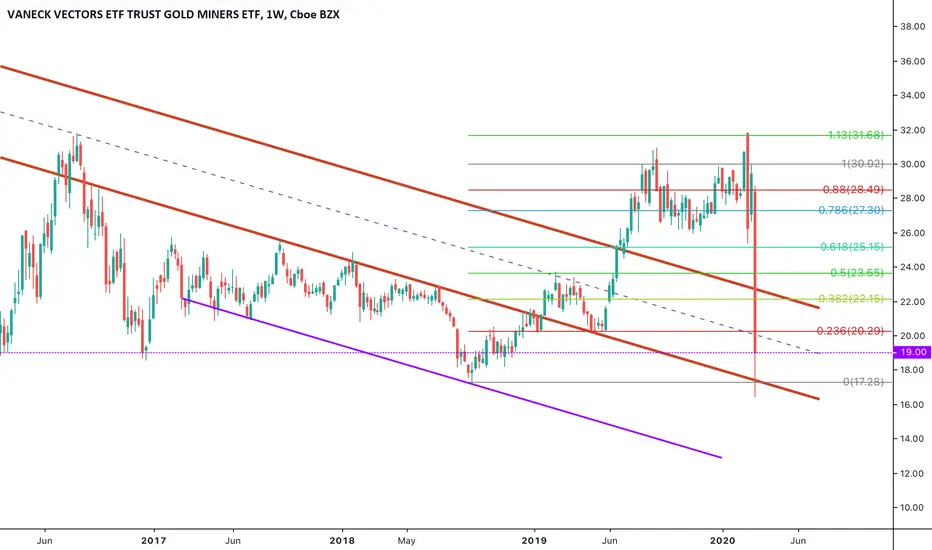
Gold Miners Likely Topped and should get Obliterated furtherGDXJ failed to close above a key resistance level of $30.70 on Friday and it is highly likely that for the month of April, the miners (and Gold and Silver) have topped. At this point if you follow my ideas, Gold will sell for liquidity in the near-term for the second wave of the downfall of equities.
Investors should remain totally on the side-lines for the miners for much of the month of April.
Come towards the end of April and into early May we can start to look for key bottom opportunities. However, in the near-term, the miners will be decimated.
Note: When we start to get quarterly re-balancing near the end of March (i.e. next week), we can expect more sharp sell-offs not only in the commodity of Gold and Silver, but the mining stocks themselves (and equities).
- zSplit

the great gold predictionI think people will bail to cash USD will rise OIL will fall Markets will fall this is the GREAT GOLD prediction from MISS CLEO call me nowW!!!

Daily Market Review | Gold to $1,886 | Money is Moving Into GoldThanks for watching. Please support my work by sharing this video with other investors and traders.
Don't forget to smash that like button here and drop a follow.
See you guys tomorrow.
Take it easy.
~Bo


Silver and the GDX during times of high volatility and G/S RatioTo be taken with a pinch of salt. The theory is relatively simple. When the VIX and Gold Silver ratios get so far out of the normal range, they tend to reverse but slowly over time. This usually leads to a bull run in the GDX and Silver prices if played out similiar to 2008. I would anticipate the Gold and Silver miners and Silver to be a buy in the coming months, if they can stop dropping from here.

Gold mining ETFs are not worth anythingWeekly target of $23, long term target ETF delisted.
Gold mining companies derive their value from the gold they produce. Their value will never increase in a greater percentage vs. actual gold because paper traded gold does not have the same built in overhead costs that companies have.
Owning gold mining stocks, ETFs, baskets, etc. have no relation to the reason for owning physical gold and I don't see how mining companies would be immune to the global sell-off.

Long $GDX BreakoutWith gold breaking out a bunch lately this will surely follow it , especialy with a clean breakout of this 30-31 doller level .. easy breakout trade imo.

GDX just got my attentionI believe the miners are undervalued and stand to do well moving forward. Gold and silver have shown their stability through history and remain solid in my opinion. I see a lot of potential in the miners.
(renko blocks are not playable so I'l have to post updates below)

Looks legit, anyone still in $DUST ? - $GLD $NUGT $GDX $GDXJ Gold miners are clearly worthless now that gold is down 10% from the high.
Does anyone know who planned this event?

Gold in AUD (daily chart)- Ascending broadening wedge. Gold in AUD (daily chart)- Ascending broadening wedge (yellow lines).
According to Bulkowski's chart pattern research- 81% probability of a bullish eventual breakout.
thepatternsite.com

Current global markets situation and everything you need to knowTo gain an edge, this is what you need to know now.
1) Yields on 10 and 30-year Treasury bonds stayed way above their lows as the stock market fell to new lows. This is a big positive.
2)Oil held way above its Sunday lows. This is a big positive.
3) The Fed is providing unprecedented liquidity of as much as $1.5 trillion. The stock market first rallied 6% on the news and then gave it all back. This indicates that the Fed is not going to be able to save this market. However, Fed's move will stop several potential dislocations in the financial markets and that is a positive.
4) This afternoon near the lows, smart money was lightly and selectively buying.
5) Big part of the selling was due to margin calls. This is a positive because margin calls eventually exhaust themselves.
Gold
Central bank selling in gold continues. Here are the key points.
- Central bank selling in gold, perhaps from Russia, appears to have continued.
- There are rumors that Italy is selling gold to pay for coronavirus expenses.
- When the stock market was halted, gold market was still trading. Over extended investors desperate to raise money sold gold to pay for margin calls in the stock market.
- Now that the momentum in gold has reversed, the momo crowd is aggressively selling gold.
- As gold miner stocks have pulled back on selling in gold, there is a bloodbath in ETFs GDX and NUGT on margin calls.
Smart money continues to buy gold and gold miner stocks on dips.
Complacency
My proprietary indicators are showing that there is still too much complacency among investors. Many investors continue to believe that the market always goes up after brief dips. Such investors are not selling.
"Buy the dip crowd is still alive and well."
Until these two groups of investors start selling, there is only a low probability of a lasting bottom unless there is a good news on coronavirus.

Gold About to Test Key Level#Gold is now retesting the rising trend line from the Aug '18 low. A break here would target the major horizontal breakout area ~$1530-$1540. That will be the last gasp to preserve a bullish regime. Below that level could send gold down towards a 1370 retest. #GLD #GDX $GDXJ


Money for nothin' and your chicks for freeLooks as though the Gold to Silver Ratio has peaked just over 100 and the popular pairs trade of Long Gold and Short Silver has run its course..
Back Up We Go... See Chart for Details and Target Price. Should Bernie Sanders upset Biden tonight, it would justify a more explosive move to the upside.
AMEX:JNUG AMEX:GDXJ AMEX:NUGT AMEX:GDX TVC:SILVER CURRENCYCOM:SILVER FX_IDC:XAGUSD AMEX:SLV NASDAQ:PAAS NYSE:AG

THE WEEK AHEAD: ADBE, ORCL EARNINGS; GDX/GDXJ, USO/XOP/XLE, EWZEARNINGS:
ADBE (89/65) and ORCL (77/60) both announce earnings on Thursday after market close and have the metrics I look for in earnings-related volatility contraction plays (>70% rank; >50% 30-day implied).
Pictured here: a short strangle paying 11.65 at the mid price camped out around the 16 delta. Its defined risk counterpart: the 265/275/395/405 ten-wide iron condor pays 2.46. Off hours markets are showing wide, so look to price setups out during the regular session.
The delta neutral ORCL April 17th 40/55 short strangle pays 1.45.
EXCHANGE-TRADED FUNDS WITH EXPIRY IN WHICH THE AT-THE-MONEY SHORT STRADDLE PAYS >10% OF THE STOCK PRICE:
GDX (99/51), April
USO (97/66), April
GDXJ (96/58), April
XLE (97/75), April
EWZ (92/52), April
XOP (92/51), April
TLT (91/41), May
EWW (91/48), April
XLU (90/43), June
SMH (84/56), April
FXI (65/33), June
BROAD MARKET WITH EXPIRY IN WHICH THE AT-THE-MONEY SHORT STRADDLE PAYS >10% OF THE STOCK PRICE:
EFA (87/37), June
QQQ (83/43), April
IWM (82/46), May
SPY (78/41), May
EEM (70/37), June
FUTURES:
/CL (97/65)
/GC (84/25)
/SI (70/30)
/NG (65/48)
/ZS (30/19)
/ZC (21/22)
/ZW (13/27)
VIX/VIX DERIVATIVES:
VIX finished the week at 41.94, so it has been a rough ride for shorters who were in plays before this volatility expansion (points to self). The basic watch word is "patience"; volatility will abate at some point in time ... .
