GDX

GDX - Bull Flag Breakout - Weekly Bullish Trend FlipOn Weekly chart shown, GDX formed a bull flag and is ready for breakout.
Price went outside wedge and retested 10WeekMA/outer wedge of triangle - looking good.
Buy signal on today's Daily candle. Weekly candle still on buy signal at end of long bearish trend.
Weekly rend shows next flip is Bullish. Next Daily trend flip is also Bullish.
RSI trend is also forming bullish wedge pattern. Same level as Bull Flag breakout beginning.
Gaps to fill (red boxes) line up with 1.618 Fib extension.
If SP500 sells off or VIX spikes, then I expect GDX to get bullish.
EXITS
$34 (top gap fills)
RSI over 70
Giant cup formation (pink curved line) can only be seen on 19D chart or greater.
Thank you for liking, commenting, throwing up a chart, following, or viewing.
I am not a financial advisor. My comments and reviews are based on what I do with my personal accounts.
Disclosure - I am long MARA, GBTC, BTCUSD, GDX, and VIXY.
Short SPY, AAPL

Gold at critical level here#Gold at really key level here. Price recovered uptrend channel on Monday, but rests on horizontal support & rising trend line from Oct '18. Breakdown here would set up retest of 1450 and possibly lower
Bulls need gold to move higher right here. A break above 1495 would signal a new leg up has begun. The miners continue to show strength, which is a good sign. $GLD $GDX $GDXJ


Gold Breaking Out from Horizontal Resistance#Gold just broke above horizontal resistance & now looking to break up from August downtrend channel. A move above 1495 would resume the uptrend from 4Q18 (channel support recently held)
RSI also breaking out from declining resistance
$GLD $GC $GDX $GDXJ $SLV

GDX Breaking OutThe weekly chart for GDX has created a bull flag pattern. The stock is finally breaking out with the market weakness. I am aiming for the $37.30 price level as a potential target but the prior $31.30 level could provide some resistance. Of course, if the market finds strength again then be ready to take your profits on this one quick.

Reversal of $DXY may have put a floor on #gold $GLD $UGLD $NUGTThe otherwise bearish gold chart may not touch down on $1400 to $1420 as many expected it to.
Trade wars and tariffs along with the debasement of all fiat currencies may trigger the return to higher gold prices. Gold bugs who have been frustrated again and again over the last 5+ years may now see another large scale move as short positions are covered heading into the end of the year. The long-awaited event may be at hand.
Goldman Sachs says gold is going to $1,600
www.kitco.com
Here is what that might look like. Otherwise, look for support around $1415.

GDX - Strong Buy - Crossing 10WeekMAGDX buy signal on Daily.
About to cross 10WeekMA for strong bullish continuation. Anytime 10Week is crossed we see bullish confirmation (weeks).
Trend turned bullish on Filter Dots.
Gaps to fill above in the $30's imply over 30% gains from current price. Not sure if we get this high, but bullish trend just starting today/tomorrow.
SPY looking to go down soon. VIXY looking to go up.
Only makes sense that GDX becomes risk on (as confirmed by the moving average proximity to current price).
Thank you for liking, commenting, throwing up a chart, following, or viewing.
I am not a financial advisor. My comments and reviews are based on what I do with my personal accounts.
Disclosure - I am long MARA, GBTC, BTCUSD, GDX, VIXY.
Short SPY and AAPL.


Anglogold Ashanti $AU Wave 4 at Channel Support?Anglogold Ashanti $AU This looks like a wave 4 at channel support setting up a break above the 38.2 Fib #gold $GC $GLD $SLV $GDX $GDXJ

$GDXJ Junior Miners looking to hold key supportJuniors looking to hold key support. Nice bullish engulfing weekly candle. $GDXJ $GDX #gold #silver $GLD $SLV. A break above that downtrend line would be a solid entry


Gold : short term decline then rally to 1587?Gold has reached the target I mentioned on my last idea AND without much retracement. At this point it's best to take profits on gold longs or tighten stops. a decline to 1430-1400 is probable at this point and then a rally to next target 1587
**If you're interested in joining a group of like-minded traders, send me a PM. This is NOT a subscription service, just bunch of average traders sharing insights in a FREE group

THE WEEK AHEAD: ANF, BBY EARNINGS; XOP, EWZ, GDX, SMHIt's a short market week here, but this is what we've got ... .
EARNINGS:
HPE (43/33): Announces Monday after market close.
ANF (85/80): Announces Tuesday before market open.
BBY (70/42): Announces Tuesday before market open.
HPQ (50/36): Announces Tuesday after market close
DE (34/29): Announces Wednesday before market open.
Of these, ANF and BBY appear most appealing from a volatility contract standpoint.
The setup pictured here is an ANF 16 short straddle in the December 20th month, paying 2.87 (.72 at 25% max) versus 15.93 spot (18.0%), with the defined risk 11/16/16/21 iron fly paying 2.60 with a buying power effect of 2.40 (.65 at 25% max).
The BBY December 20th 65/80 short strangle is paying 1.75 (.88 at 50% max), with the correspondent 60/65/80/85 iron condor in the same cycle paying 1.60 (.80 at 50% max).
EXCHANGE-TRADED FUNDS:
TLT (36/12)
SLV (29/20)
GLD (23/11)
USO (21/33)
XLE (19/20)
As with last week, short duration premium selling remains less than ideal here, so either hand sit, keeping powder dry, or look to deploy in longer duration setups. Here's what's on my list for longer duration setups in which at background implied volatility is higher:
XOP: January, where the at-the-money short straddle is paying 2.20 versus 21.05 spot (10.5%)
EWZ: March, where the at-the-money short straddle is paying 5.12 versus 43.16 spot (11.9%)
GDX: March, where the at-the-money short straddle is paying 3.14 versus 26.76 spot (11.7%)
SMH: May, where the at-the-money short straddle is paying 17.95 versus 130.92 spot (13.7%)
BROAD MARKET:
SPY 10/13
IWM (7/16)
QQQ (7/16)
As with the exchange-traded funds, you're looking at either hand sitting on shorter duration setups or going out farther in time to get paid, with the expiries in which the at-the-money short straddle is paying greater than 10% in September for SPY and June for both IWM and QQQ (ugh).
FUTURES:
/6B (67/12)
/NG (41/60)
/6C (30/5)
/SI (29/18)
/GC (23/11)
Cable I get, but what's with the Loonie?
VIX/VIX DERIVATIVES:
With the January, February, and March contracts trading at 16.68, 17.76, and 18.05 respectively as of Friday close, VIX term structure trades in those expiries remain viable. For all other short volatility trades, I'd wait for a VIX pop above 20 to consider starting to add short position, as well as consider taking off some risk if we see another drop back into the 2019 lows at 12. It finished Friday at 12.34 ... .

GDXJ Junior Gold Miners in Wave 4 correctionConsistent with my view on #gold, juniors look like a Wave 4 correction before a 5th wave higher. $GDXJ $GDX $GLD $SLV #silver #platinum #palladium

$GDX Gold Miners in bull flag, testing rising channel support. Price should move up from these levels as rising channel support holds and price breaks out of bull flag.


GDX - Watching for ReversalSmall position here for me.
Watching for pattern turn right around Christmas.
SPY / SPX pullback during the same period should indicate risk-on for GDX with bullish trend.
Options are cheap and so is stock. Small position size until we see bullish confirmation helps to reduce risk.
I suggest using stop losses. I do not personally because I feel they telegraph my orders to the algo's.
I play the chart, pattern, world events, price, and sentiment. I also use Price Alerts HEAVILY instead of stop losses.
Holla if anyone wants an update for GDX and I will do my best.
Thank you for liking, commenting, throwing up a chart, following, or viewing.
I am not a financial advisor. My comments and reviews are based on what I do with my personal accounts.
Disclosure - I am long MARA, GBTC, BTCUSD, GDX, VIXY

Gold - Reversal Bullish Pattern FormingOANDA:XAUUSD is forming a falling wedge awaiting breakout.
RSI is showing bullish divergence. Estimated targets is around 1492
Cheers!


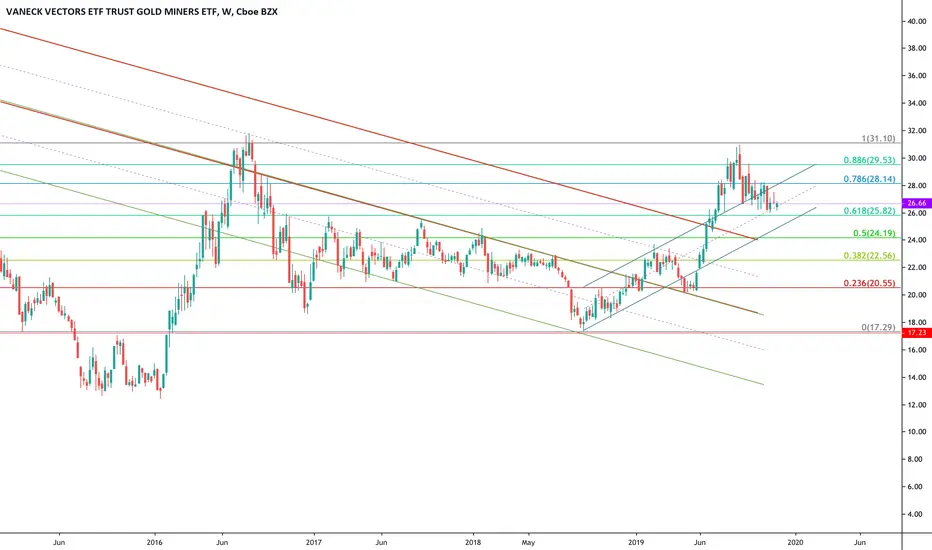
GDX - Bullish Wedge PatternGDX saw a rise in price from June breakout until its top in September. Since that September top, the stock has formed a bullish wedge pattern where it is currently bouncing off the support line. There is also a slight bullish divergence between the price & the RSI indicator.
Just waiting for the bullish breakout to occur to activate a potential price target. Any breakdown would negate the formation.
