Day 97 — Grinding Back Profit in Short Squeeze ModeEnded the day +$204.85 trading S&P Futures. Operating on just 3 hours of sleep, the morning started rough with some losses due to a false signal as the market entered short squeeze mode. It was a grind, but I managed to claw my way back to profitability by the close. The MES market feels incredibly difficult right now—signals are mixed, and the relentless squeezing makes me hesitant that a sudden unload is coming. My plan moving forward is to size down to reduce risk while leaving just enough room to catch the downside if the rug finally gets pulled.
Day 97— Trading Only S&P Futures
Daily P/L: +$204.85
Sleep: 3 hours
Well-Being: Good
🔔News Highlights: *S&P 500 ENDS AT A NEW RECORD HIGH AS TECH SHARES RALLY AHEAD OF MEGACAP EARNINGS, FED MEETING
📈Key Levels for Tomorrow:
Above 6955= Bullish Level
Below 6950 = Bearish Level
📊Reviewing signals for today (9:30am – 2pm EST):
9:40 AM VXAlgo NQ X1DP Sell Signal,
9:50 AM ES1! Phase Change: Neutral :check~2:
9:50 AM MES Market Structure flipped bullish on VX Algo X3! :check~2:
10:00 AM Market flipped bullish on VX Algo X3! :check~2:
10:30 AM VXAlgo ES X1 Overbought/toppy Signal
11:30 AM VXAlgo ES X1 Overbought/toppy Signal :check~2:
11:50 AM VXAlgo ES X1 Overbought/toppy Signal :check~2:
12:20 PM ES1! Phase Change: Bearish :check~2:
12:30 PM VXAlgo NQ X1DP Buy Signal :check~2:
12:54 PM MES Market Structure flipped bearish on VX Algo X3!
1:16 PM VXAlgo ES X1 Oversold signal
1:30 PM Market flipped bearish on VX Algo X3!
GLD

Gold - Pullback Soon?Gold TVC:GOLD has not been this extended (light purple band) from the historical mean / simple moving average (green bands) since 1979. What followed was an almost 17% drop thereafter in just a month. Then, 137% parabolic rise in just two months followed by a 45% crash 3 months later....
My point for those trying to hop on the train now: There is a very strong probability of a 10%-20% pullback as the price approaches $5,600+/-. But that's simply my worthless view.
This type of extension is what I suspect we'll see with the S&P 500, as described in this write-up

GLD: short- and mid-term projection As long as price continues to close above 397, I’m expecting further short-term upside toward the 430–440 resistance zone, with potential extension to 460 in the coming weeks.
Chart (daily):
Within the broader macro structure, I am viewing these levels as a likely mid-term topping zone, followed by a multi-month correction and consolidation before another leg higher into late 2026+.
Weekly view:

Gold vs Silver Ratio...Are We About To See Fireworks? The last time we saw a dramatic move of this nature in the gold silver ratio.... we witnessed some crazy volatile downside swings in the commodity price.
Specifically silver saw epic reversals and sell side pressure.
Ahead of the BOJ decision tonight price action is setting up mysteriously eerie.
Watch out for potential silver downside in the next few days...
Even if Silver has a sharp drop.... usually when a commodity sells from all time highs...there is a really great bounce opportunity....this asset is still a beast but anyone can admit its very very extended.
I've even recently sold physical silver since my cost basis is $19.00 (I never thought I would sell)

Gold Update 22JAN2026: Check The Power Of TrendlinePrice follows the path posted last week and even broke out of small uptrend
How far it can go further up?
I switched to a weekly chart and added the trendline built through the peaks of waves 1 and 3
in yellow - it offers strong resistance in $4,950-5,000 area as price usually respects such large trendlines
I also checked the size of wave 5 compared to wave 1-3 distance - it reached whopping 1.618x of it compared to normal 0.618-1x
Indeed, commodities tend to have extended fifth waves and this extended size is still good
RSI on weekly as well as on daily shows Bearish Divergence, this is not the action alert but the
indicator of the final stage
Let's watch how the price reacts to the trendline as this is the only resistance at the moment
The breakdown point now is set at the bottom of the tiny wave 4 at $4,284

Gold near $5,000 — this is where bull markets turn parabolic🚨 As we are closing in 5,000 USD in gold prices, the bull market is entering its parabolic stage. Let’s review the current bull market stats + historic bull markets in more detail. Let’s go.
________________________________________
✅ Executive Summary — Top 10 Key Takeaways
1.🟡 Gold just printed a new ATH: $4,887.82/oz (Jan 21, 2026) and is hovering around $4,885.
2.🧠 From the 2016 low (~$1,080) to today: ~+352% (≈ 4.5×).
3.🎯 $5,000 is the magnet level: Reuters notes traders are watching/holding for the $5,000 psychological threshold.
4.🏦 This cycle’s signature: central banks remain the anchor buyer — 1,045t added in 2024 (3rd straight 1,000t+ year).
5.💧 ETFs are back: physically backed gold ETFs saw record-setting demand bursts
6.🧨 The 2026 catalyst (right now): fresh safe-haven demand tied to elevated geopolitical/trade stress.
7.🧱 Structure matters: the multi-year base/breakout thesis (2024) has evolved into an “ATH staircase” into 2026.
8.🥈 Silver is also in a historic move: it hit an all-time high around $95.87
9.📊 Relative performance: S&P 500 finished 2025 up ~16.39%, while gold’s 2025 run was widely described as exceptional
10.🔥 Upside framing is now mainstream: some strategists explicitly model paths to $7,500/oz in 2026
________________________________________
🔥 What’s Different About This Bull Market 2026
•🏦 Central-bank dominance is the backbone
•💸 ETF flows returned in size, adding a powerful Western liquidity bid.
•📉 Rates/real-yield expectations still matter, but now gold also trades as a trust/sovereign-risk hedge during political and trade shocks.
________________________________________
🏆 Historic Gold Bull Markets — Timeline & Stats
1) 1968–1980 “Super Bull”
•Start/End: ~$35 → $850
•Gain: ~2,330%
•Drivers: End of Bretton Woods, oil shocks, double-digit inflation, geopolitics
•Drawdown: ~–45% before the final blow-off run
2) 1999–2011/12
•Start/Peak: ~$252 → ~$1,920
•Gain: ~650%
•Drivers: Commodities supercycle, EM demand, USD weakness, GFC safe-haven bid
3) 2016/2018–Present The “CB-Led” Cycle
•Cycle low (key anchor): ~$1,080 (2016)
•Latest / ATH: ~$4,885 spot; ATH $4,887.82 (Jan 21, 2026)
•Gain since 2016 low: ~+352%
•Primary drivers:
o🏦 Central banks: 1,045t added in 2024 (3rd straight 1,000t+ year)
o💧 ETF inflows: major re-acceleration, including record Q3 2025
o🌍 Geopolitics/trade shocks: renewed safe-haven urgency into Jan 2026
________________________________________
📊 At-A-Glance Comparison
Metric 1968–80 Super Bull 1999–2012 2016–2026 Current
🚀 Total Gain ~2,330% ~650% ~+352% (from ~$1,080)
⏲️ Duration 12 yrs 13 yrs ~10 yrs (ongoing)
💔 Max Drawdown ~–45% ~–30% ~–20%ish (not a deep secular washout so far)
🏦 Main Buyer Retail/Europe Funds/EM Central banks + ETFs/investors
🏛️ Pattern Secular parabolic Cyclical ramps Breakout → staircase ATHs → $5k magnet
________________________________________
📈 Top 10 Stats of the Current Bull Jan 2026 Edition
1.🟡 Price / ATH: $4,885 spot; ATH $4,887.82
2.🧮 Bull-cycle gain (2016 low): ~+352% from ~$1,080
3.🧲 Next magnet: $5,000 psychological level
4.🏦 Central banks: +1,045t in 2024 (3rd straight 1,000t+ year)
5.💧 ETF surge: Q3 2025 logged the strongest quarter on record (WGC)
6.🌍 2026 impulse: safe-haven bid tied to geopolitical/trade escalation
7.🥈 Silver confirmation: record ~$95.87 (Jan 20, 2026)
8.🧱 Demand pulse: WGC-linked commentary highlighted record-strong quarterly demand in 2025 (investment + CBs)
9.📊 Equity comparison anchor: S&P 500 2025: +16.39% (gold’s run continued to new records in Jan 2026)
10.🎯 Street framing: credible scenario work explicitly targets $5,000/oz as a 2026 outcome case
________________________________________
🎯 Strategy Ideas 2026+
Core simple + durable
•🧱 Hold/add on pullbacks via allocated physical, high-liquidity ETFs, and quality royalty/producer names.
•⚖️ Size it like insurance: you want enough to matter, not enough to force emotional selling.
Satellite torque, optional
•🥈 Silver (higher beta) + select miners only if you accept volatility (silver just proved it can go vertical).
Risk management
•🧯 Define your trim rules before the chart goes vertical:
otrim a slice into euphoric spikes, keep the core
oavoid leverage if you can’t stomach violent swings
________________________________________
🧪 Reality Check — What Could Cool This Bull?
•💵 Sustained USD strength + higher real yields
•🏦 Meaningful slowdown in official-sector buying
•📉 Big reversal in safe-haven demand if geopolitical/trade risk de-escalates fast
________________________________________
🔚 Updated Key Takeaways
•🏦 Central banks + ETFs are the twin pillars of this cycle.
•🟡 Gold is printing fresh records into Jan 2026 and $5,000 is the next psychological battleground.
•🧠 From $1,080 (2016) to ~$4,885, we’re up ~+352% — and the tape is behaving like a late-stage trend.

Gold Update 15JAN2026: Bearish DivergenceThe price follows the projected path very accurately
It reached the target zone and updated the all-time high at $4,651
At the same time, RSI has formed a bearish divergence, as anticipated earlier for Wave 5
Price is making a higher high while RSI prints a lower peak on the sub-chart
This signals weakening momentum and suggests a reversal may be close
Price may still produce one final spike toward the upper boundary of the bullish trend before fading
$4,250 remains the key support level to watch

BTC or Gold? UpdateI first published this chart back on March 4, 2025. I got precisely 14 likes (including mine) haha! Since the top, the BTC/Gold ratio has collapsed by -47% now trading for only 21oz. of gold.
Even if you did not take the pairs trade and switched from BTC to Gold, you would have made a 124% profit today. A very handsome ROI.
At the most basic fundamental level, it would have shown you that BTC was just too damn expensive to think about getting involved in. Gold or something else was a much better VALUE option to take.
I won't go into where the price can go from here and what else to look for. That's for another time and place.
I’ve been posting a lot about understanding the value of X and using simple charts to see what the market is actually willing to pay for it. I want the TradingView community to approach trading and investing in a more meaningful way, more authentic, more raw, less complicated. Simple can be powerful. Beautiful, even.
But I need your help to grow.
If you enjoy the work:
👉 Drop a solid comment
Let’s push it to 6,000 and keep building a community grounded in raw truth, not hype.

$NEM – Leading Gold Stock Nearing a Key Inflection BreakoutNewmont ( NYSE:NEM ) is one of the leaders in the gold sector, and it’s now pushing right into the 91.50–92 breakout zone — a level that has acted as major resistance for months. This is a high-stakes inflection point.
🔹 The Setup:
Price is tightening underneath 91.50–92, a clean horizontal resistance.
NYSE:NEM has been showing relative strength, tracking gold’s move nearly tick-for-tick.
Structure is clean: rising EMAs, bullish slope, and volume building underneath the trigger.
🔹 Why This Matters:
AMEX:GLD itself looks fantastic — tightening, trending, and primed for continuation.
When gold futures and GLD look this strong, leading miners like NYSE:NEM tend to run first.
This is exactly the kind of setup where institutional money steps in.
🔹 My Trade Plan:
1️⃣ Entry: Add through a clean breakout over 92 with volume confirmation.
2️⃣ Stop: Under the 9 EMA — tight and mechanical.
3️⃣ Target: Trend continuation, first into prior pivot highs, then toward measured move extensions.
Why I Like This Setup:
Leader stock + leader sector = high probability.
Technicals and macro backdrop (rates, inflation tailwinds, dollar softness) all point the same way.
NYSE:NEM is often the “tell” for the entire gold complex — if this breaks, the whole sector could run.

XAUUSD Local long planIn gold, we’re not seeing continuation to the downside. Instead, buyer interest is emerging to push price higher, confirmed by a formed FVG on the daily timeframe and a 4H OB. I’m expecting price delivery toward ATH. 1D FVG ➡️ 4H FP (LI) ➡️ 4H OB ➡️➡️➡️ 1D FP.

XAUUSD (GOLD) PlanPrice continues to move higher within a bullish 1D OF, without making deep pullbacks into weekly PD arrays. I expect further upside toward the next target at the 1W FP (ATH).

Gold Update 05JAN2026: One More Up to $4,584-$4,700Happy New Year and best wishes!
Indeed, it’s not an Ending Diagonal anymore
The Leading Diagonal in wave 1 confused me into thinking the entire wave 5 was an Ending Diagonal
As the dust settles and the chart moves further to the right, the structure becomes clearer
We now have waves 1–2–3–4 in place, and the bottom of wave 4 has held above the peak of wave 1 at $4,250, which is healthy
The final wave 5 of (5) of ((5)) could be underway, targeting the blue box area
This lies between $4,584 (the all-time high) and $4,700 (the 61.8% Fibonacci projection of waves 1–3)
Both targets align well with the yellow uptrend
Wave 5 should print lower on RSI while price makes a higher high, confirming bearish divergence

$XAG > $BTC? The 1980 "Curse" is Finally Broken.We just witnessed history. Stop scrolling and look at the chart.
For 45 years, the $50 level was the "Graveyard of Bulls."
1980: The Hunt Brothers cornered the market, peaked at $50, and crashed.
2011: The retail mania hit $49 and collapsed.
Today, that ceiling is gone. NASDAQ:XAG hasn't just "broken out"; it has shattered the most significant resistance level in modern financial history. We are trading at $58+, well into price discovery mode.
The "No-BS" Reality: While CRYPTOCAP:BTC is fighting for its life to hold support during this liquidity crunch, Silver has done what "Digital Gold" promised to do but couldn't.
CRYPTOCAP:BTC Status: Flushing leverage, correlating with tech stocks, and failing to act as a hedge.
NASDAQ:XAG Status: Breaking a 45-year suppression cycle to become the #1 performing asset.
The Setup (The Cup & Handle of the Century): This is a 45-year technical structure. The "Cup" started in 1980. The "Handle" ended this month.
The Breakout: $50 is now the floor, not the ceiling.
The Target: The measured move from the 1980 peak targets $85.89 - $89.15.
My Outlook: The "Gold 2.0" narrative is being tested in real-time.
Long NASDAQ:XAG : I am riding this breakout to the $89 target.
The "Re-test" Buy: If we dip back to $50 (the 1980 High), that is a generational buying opportunity. Old resistance must become new support.
Verdict: The "relic" just outperformed the "future." The 1980 curse is dead.
👇 Discussion: Is CRYPTOCAP:BTC failing its "Gold 2.0" audition, or is this just a temporary rotation before Crypto catches up to AMEX:SLV & AMEX:GLD Sectors ? Let me know your targets below.

Gold or Silver?Right now: SILVER!
I know, I know! Crazy schitt! Don't look at me!
The chart’s telling the story — Silver hasn’t even really started its move yet. Don’t blame me, I’m just reading the data.
Silver is up 87% year-over-year and outperforming gold by 11%, which is still on the low end historically.
That suggests Silver either has room to run from here, or it’s simply the safer relative play versus gold on a risk-adjusted basis.
If you’ve got space in your portfolio, it’s a reasonable addition.
If it hits nose-bleed levels, we reassess.
THANK YOU for getting me to 5,000 followers! 🙏🔥
Let’s keep climbing.
If you enjoy the work:
👉 Drop a solid comment
Let’s push it to 6,000 and keep building a community grounded in truth, not hype.

GOLD (XAU) Outlook - Prediction (12 NOV)GOLD (XAU) Outlook - Prediction
📊 Market Sentiment
Market sentiment for GOLD remains strongly bullish, primarily driven by central bank accumulation. Since 2023, global central banks led by China have been purchasing gold aggressively, creating a durable demand base. With the FED preparing to initiate QE while inflation remains elevated, I think risk assets like GOLD could outperform as the USD (DXY) weakens. This macro setup continues to support a long term bullish narrative.
📈 Technical Analysis
Price has been retracing since October 20, which I think was a healthy correction following a strong expansion. As mentioned in my previous GOLD outlook, price appeared to be retesting the Weekly Value Gap and accumulating within that zone. In my opinion, this accumulation phase seems to have ended, and the market looks ready to continue higher.
📌 Game Plan - Prediction
Price has broken out of the accumulation zone and started expanding upward. I plan to enter after a retest near the key zone around $4060. It may dip toward $4027, which I consider a discount zone. I intend to scale in between $4060 and $3950, with invalidation if the daily candle closes below $3900.
💬 Follow my Substack profile for detailed insights and extended analysis.
⚠️ Disclaimer: For educational purposes only. This is not financial advice.

Gold. Historic chart. Elliottwave structrueGold started trading freely at 40 dollars in august 1971. This is a textbook elliottwave structure. Now gold has hit 2,382 extension where there is a nice confluence with the internal structure. This is the region where wave 3 ends. I expect a longterm downside wave 4 to the region marked by the rectangle. This region is 0,236 - 0,382 retracement measured between wave 2 and wave 3.

Gold Don't let it CRACK!Nothing goes straight up forever, so don't let it CRACK! This is just basic charting stuff that everyone should be able to understand here.
A CRACK here does not mean it's done going up. How it cracks matters. We can reassess when more info comes in on the chart.
If you enjoy the work:
👉 Drop a solid comment
Let’s push it to 6,000 and keep building a community grounded in raw truth, not hype.

Gold Costs 175 Hours Of Work To BuyI like to price everything I buy in hours of work.
That’s the only price that actually matters.
Money can be replaced. Time can’t. When I look at a purchase in terms of how much of my life it costs, it becomes instantly clear whether it’s worth it.
My kids hate me for it because their view is that everyone else is paying the same tag price; therefore, it is fair. LOL!
Pay - After tax - Hours
$20 $14.00 324 hours → 8.1 weeks
$30 $21.00 216 hours → 5.4 weeks
$37 $25.90 175 hours → 4.4 weeks avg.
$50 $35.0 130 hours → 3.2 weeks
$60 $42.00 108 hours → 2.7 weeks
Markets don’t care about this at all. You should.
Pricing gold in hours of work gives you a far clearer sense of whether it’s actually cheap or expensive.
No one wanted to buy gold at $2,000—about 80 hours of work—when I posted the bullish setup in February 2024.
Now everyone wants it at $4,533—175 hours of their lives. I barely got 20 likes. LOL!
That’s how you know you’re in a euphoric market.
You can make a lot of money in Euphoria Land—fast.
You can lose it even faster.
Why?
Because most people don’t understand valuation, and they never have an exit strategy.
They want every last drop of greed.
The green number on the screen creates a false sense of safety—
as if unrealized gains are money you can afford to lose.
“F it. Keep it going.”
Hair on fire and all!
If you want to be a successful trader/investor, you MUST learn valuation and have an exit strategy. NO MATTER HOW HIGH THE PRICE GOES AFTER THE FACT! It is not your concern. You have ZERO RISK OF LOSING IT when the money is in your bank account. I lost my ARS! learning this lesson the hard way. I don't want you to do the same. I get people bashing me for GTFO and STFO because they know no better. They never made money in markets and kept it. They can be right for 1000 days and lose their ars in 5! In their premetive brains, they were "RIGHT" for 1000 days. It will come back. LOL! And it never does.
No One Should Be Buying Here!
Price is what you pay. VALUE is what you get.
If you enjoy the work:
👉 Drop a solid comment
Let’s push it to 6,000 and keep building a community grounded in truth, not hype.

Gold % Gain vs SPX Since 1971Debt wasn’t the problem in 1971 or 1980. It became the system after 2000.
In 1980, the U.S. owed ~30% of its GDP.
In 2000, ~55%. In 2025, ~125%.
This isn’t inflation theory. It’s arithmetic!
I have long been a critic of MMT (Modern Monetary Theory)
Or, as I like to call it more accurately, OCG (Old Currency Guess), because it deliberately confuses a Gov. currency payment system & units of account as wealth. The more we borrow, the more wealth Gov creates, according to OCG. "No sovereign currency issuer can default in its own currency," they cry out daily. So print and play give us more free stuff! We will become richer and solve all the problems of the world! Right!!
Note that Gov becomes the source of wealth, not the private sector, which actually creates wealth with our blood, sweat, tears, innovation, and risk-taking.
So-called ‘printing’ isn’t printing at all. It’s borrowing existing dollars, recycling them through spending, and stacking permanent debt claims on future output. When growth goes to servicing past promises, the economy eventually gets consumed by its own debt and collapses.
Currently, Japan is on the path to economic ruin. With a debt-to-GDP ratio of 250% double that of the US. The thing with debt is that it works great at masking the problem right up to the point it doesn't! It's that "DOESN'T" part that really matters. When creditors lose confidence and run away, that is more subjective than an objective point in economics, which makes it difficult to calculate accurately. People use that subjectivity against economics and conclude it's not science and schitt all over it.
My take is different. While I literally subscribe to no economic standalone theory, I do believe all economists should be financial experts and fully understand markets. No theory or model can deal with the real-world complexity. Definitely not MMT! They are the cancer of economics.
While people are focusing on Gold/Silver and soon start talking about Japan with 250% debt/GDP, I will urge you to look at the US instead. While US debt-to-GDP is half of that of Japan. The US has 4 times the amount of debt as Japan! Quantity is a quality of its own! It is much easier to find creditors for $9 trillion than $38 trillion. Believe that schitt!
With Trump waging a trade war against the world and taking over the FED wanting lower rates, that is F disaster in the Making! After a Nuclear war, Inflation is the absolute worst thing that could happen to humanity! A Global Currency crisis is on the horizon, and 99.9% of the people are unaware of it.
CAUTION! Is in Order!
If you enjoy the work:
👉 Drop a solid comment
Let’s push it to 6,000 and keep building a community grounded in truth, not hype.

Gold Update 25DEC2025: Ending Diagonal RechartedNot all our projections play out as we plan
This time Ending Diagonal grew larger but the structure is still valid
as it unfolds in 3-3-3-3-3 sequence
I recharted it for you on 4-hour chart
RSI will be our guide as always:
wave 5 on RSI should be lower than on the price chart
to show Bearish Divergence

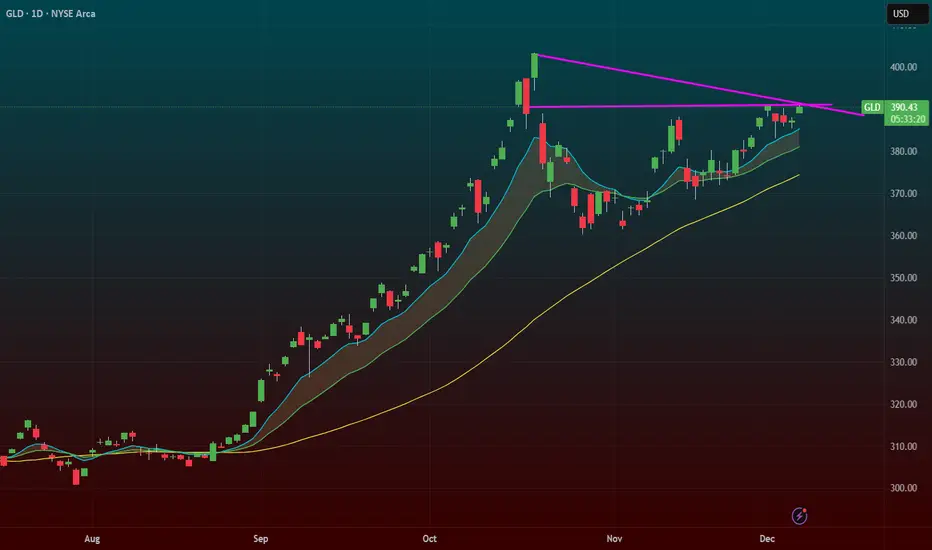
$GLD – Multiple Breakouts Converging: Flag + Trendline + Gap FilGold ( AMEX:GLD ) is triggering one of the cleanest breakout setups on the entire market right now. We're getting a flag breakout, a longer-term trendline break, and we’re pushing straight into a gap fill from October 20th — all at the same time.
This is the kind of confluence I dream about.
🔹 The Setup (Perfect Storm):
Flag breakout: Tight consolidation resolving to the upside.
Major trendline break: Longer-term resistance finally giving way.
Gap fill trigger: Entering the October 20th gap — once inside, price often accelerates.
Rising EMAs underneath = structural momentum.
This is big-time swing trade stuff.
🔹 Why This Chart Matters:
The entire precious metals complex is heating up.
Silver already broke out — gold often follows and trends harder.
Macro tailwinds (inflation whispers, deficits, dollar wobble) are fueling demand.
🔹 How I’m Trading It (Progressive Exposure):
1️⃣ Starter Position: Bought $400 GLD calls last week.
2️⃣ Futures Position: Long AMEX:MGC for premarket flexibility.
3️⃣ Pyramiding Plan: As the setup improves — more confirmation, more levels break — I add to the trade.
I don’t go full-size at entry.
I scale in as the trade proves itself.
This is the exact progressive exposure method I’ve used for 15+ years.
🔹 Risk:
Stop beneath the 9 EMA on the daily for my futures position.
GLD calls are defined-risk by nature.
This is the real deal — the type of breakout where gold can trend for weeks.
Silver Market Once in a Lifetime Breakout: 120/140 USD PT📌 Base case unchanged: I’m still targeting $125–$150 within 12–24 months. The next leg of the bull run should accelerate after the all-time-high (~$49–$50) breaks and sticks. Spot is circling the mid-$40s (recent highs ~$46–$47), so the setup is in place. 💎✨
🎯 Bottom line
Silver’s structural deficit + gold leadership + policy-driven cost inflation meet a fresh technical regime. The ATH break is the ignition; $65–$75 is the first destination, and the $125–$150 12–24M target stays live if real yields drift down and PV/electronics demand stays elevated despite thrifting. Manage the whipsaws; respect $38 as the cycle guardrail. BUY/HOLD bias remains warranted. 🚀💎🔥
________________________________________
📊 Technical Outlook (2-week candles)
• Structure: Multi-year Cup & Handle from 2011 → 2020 base → 2024/25 handle. The $40 neckline break is done; a weekly/monthly close > $49.50 flips the market into price discovery.
• Levels that matter:
— Resistance: $49–$50 (ATH), then $65–$75 (measured move / vacuum), interim supply near $57–$60.
— Support: $44.5–$45 (breakout retest), $41–$42 (former cap), deeper $38 and $34 (trend break if lost).
• Momentum breadth: Higher highs on price with constructive consolidation while gold prints records → classic GSR mean-reversion tailwind. 📈⚡
________________________________________
🧭 12–24 Month Path Outlook
Base (55%) – Break & run: Close above $50 triggers trend systems and discretionary chase → extension to $65–$75 by mid-’26, stair-step into $100–$125 by late ’26/early ’27; overshoot to $150 on macro squeeze. 🚀
Alt up (15%) – Blow-off: Parabolic sprint to $85–$100 immediately post-break, sharp retrace to high-$60s, then grind to $125–$150.
Pullback (25%) – Fakeout & reload: Failure at $49–$50, mean reversion to $41–$42 or even $38, rebuild positioning; timeline slips ~1–2 quarters.
Bear tail (5%) – Macro shock: USD spike + real-yield jump + PV air-pocket; lose $34 → cycle delay (target deferred, not canceled). ⚠️
________________________________________
🚦 Catalyst Scorecard — Visible & Hidden Drivers (0–10)
1. Fed path & real yields — 9.0/10 (Bullish)
The Fed cut 25 bps on Sept 17 (now 4.00–4.25%) and signaled scope for more easing this year; several officials reinforced that bias. Lower real yields are the single strongest tailwind for non-yielding metals. 🏦
2. U.S. Dollar trend — 6.0/10 (Net-Bullish for silver)
DXY has been firm the last two weeks, a minor headwind; but with the Fed easing bias, dollar upswings look tactical, not structural. Any USD rollover clears the runway. 💵
3. Gold leadership & GSR mean-reversion — 8.5/10 (Bullish)
Gold at/near record highs ~$3.75–$3.80k keeps silver in tow. GSR ~80–84 is elevated vs. bull-market medians → skew favors silver outperformance on a gold grind. 🪙⚖️
4. Structural deficit — 8.5/10 (Bullish)
Fourth straight sizable deficit; ~678 Moz cumulative drawdown since 2021. 2025 still projected to run a ~115–120 Moz deficit despite softer bar/coin demand. 📉📦
5. Industrial demand (PV/Electronics) — 7.5/10 (Bullish with nuance)
PV/electrical demand at record highs; PV up again in 2024 (+3% y/y) and installations broadened across 38 “>1GW” countries. Offsetting force: silver thrifting (0BB, copper plating) → another 10–12% loading cut likely in 2025. Net: total ounces still robust as capacity growth outpaces thrifting… for now. ☀️🔋
6. ETP/ETF flows — 7.5/10 (Bullish)
Global silver ETPs flipped to net inflows in 2024 (+62 Moz) and kept adding into 2025. SLV shows ~15,362 tonnes in trust as of Sept 26—a sizable base of “sticky” investment metal. 📊📈
7. LBMA & COMEX stocks / liquidity premia — 7.0/10 (Bullish)
LBMA silver in London: 24,646 t (Aug) — up m/m but well below pre-2020 peaks; COMEX registered ~196 Moz. Tight-ish float + delivery frictions can widen location premia during spikes. 🏭📦
8. Tariff & logistics regime — 7.0/10 (Bullish via inflation/frictions)
U.S. 50% copper tariff (Aug 1) lifts domestic copper premia and can indirectly affect by-product silver flows and refining economics. Recent gold bar tariff confusion also showed how policy can snarl bullion logistics; LBMA welcomed clarifications, and noted silver discussions continue—headline risk persists. 🚢⚙️
9. Base-metal supply shocks (by-product linkage) — 6.5/10 (Bullish)
Grasberg disruptions and Peru protest-related shutdowns point to emerging fragility in copper output; since much silver comes as a by-product, copper hiccups can tighten silver supply at the margin. ⛏️🌍
10. Mexico policy/permitting — 6.0/10 (Bullish later, volatile now)
World’s top silver producer remains mired in regulatory overhang; exploration still depressed post-2023 reforms. Any genuine permitting thaw would be years from ounces—near-term effect is restraint. 🇲🇽📜
11. India retail/investment demand — 6.5/10 (Bullish)
Silver hitting record rupee highs; local ETFs up ~50%+ YTD; retail investment +7% y/y in H1’25. Seasonal tailwinds into festivals. 🎉🇮🇳
12. China macro & manufacturing — 5.5/10 (Mixed)
Electronics appetite is steady, PV leadership intact; property stress caps jewelry, but investment demand remains opportunistic. Net: supportive on dips, headline-sensitive. 🏗️🇨🇳
13. Systematic/CTA & options positioning — 6.0/10 (Volatility amplifier)
Trend models chased the $40 break; dealer gamma turns negative above $45–$47 at times, inviting intraday whipsaws. 🎯📉📈
14. Geopolitics (Ukraine/Mideast/Taiwan) — 5.5/10 (Event-Bullish)
Safe-haven jolts remain episodic; they matter more after the ATH triggers chase behavior. 🌍🔥
________________________________________
🧨 Hidden (under-traded) catalysts
• GSR compression trade: Once $50 breaks, programmatic rebalancing from gold to silver can accelerate relative gains. (GSR in the 60s pulls silver deeper into triple digits fast.) ⚖️💥
• By-product elasticity: Copper policy & outages (tariffs, mine incidents) can reduce silver by-product feed even as PV demand hums—this is not fully priced. 🔧⛏️
• Vault/warehouse microstructure: LBMA/COMEX stock changes vs. delivery notices can suddenly widen time/location spreads → sparks short-term basis fireworks that lift spot. 📦⏳
________________________________________
🛠️ Positioning & Execution
• Core: BUY/HOLD core metal exposure; add on $44–$45 retests; reload heavier on $41–$42.
• Breakout tactics: On a weekly close > $50, ride call spreads (e.g., $60/$90 9–15M out on SI or SLV) or risk-reversals (sell $35 puts to fund $80–$100 calls).
• Risk controls: Invalidate momentum if weekly close < $38; cut leverage.
________________________________________
🧩 Fundamental NOTES
• Spot context: XAG/USD ~$46, 52-week range ~$28–$46.7. ATH ~$49–$50 (1980/2011).
• Deficit math: Metals Focus/Silver Institute show fourth straight deficit; 2025 deficit ~117 Moz amid record industrial demand and only modest supply growth.
• Supply: 2024 mined = 819.7 Moz; 2025e ≈ 835.0 Moz (+1.9% y/y). Primary mine share keeps slipping; AISC fell in 2024 (by-product credits).
• PV nuance: Silver loadings ↓ ~10–12% in 2025e, but global PV installations broadened; total silver ounces into PV remain lofty even as intensity falls.
• Vaults/ETFs: LBMA London holdings 24,646 t (Aug). SLV metal in trust 15,361.84 t (Sep 26). COMEX registered ~196 Moz.
• Macro winds: Fed cut and may cut more in 2025 → lower real yields + easier USD path.
• Policy kicker: U.S. copper tariffs live; gold bar tariffs clarified after August confusion; silver remains under policy watch—any mis-classification can jolt premia.
________________________________________

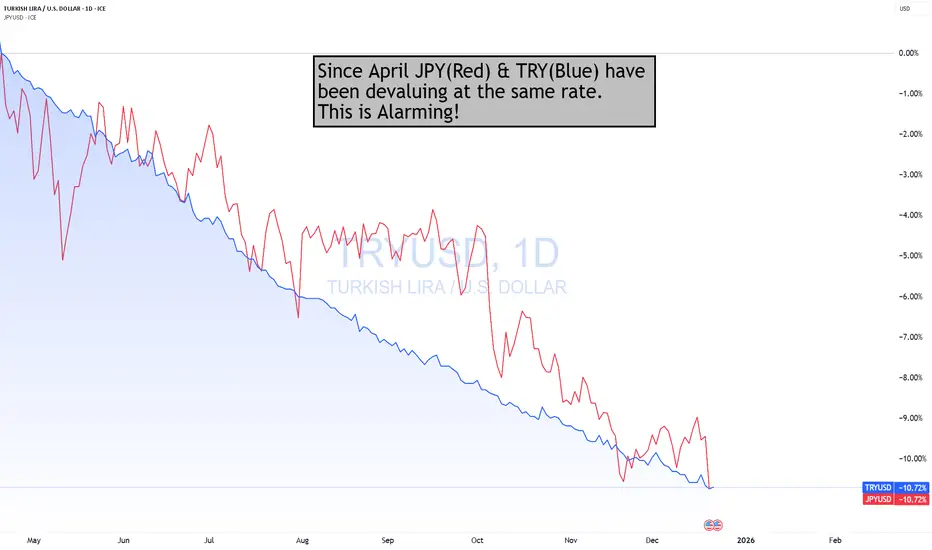
JPY Devaluing At The Same Rate As TRY Against $Since April, the JPY has been falling at the same rate as the TRY against the $. This is Alarming, should the trend continue.
This makes this even more interesting, is that the DXY since Trump took office, has dropped almost by the same amount!
What is important to also understand is that the JPY is 145 of the DXY. As such, if the JPY were to strengthen (all else being equal) the DXY would be down even more!
How would that help the "AFFORDABILITY HOAX" if the $ keeps devaluing, requiring more $s to buy the same amount of goods & services?
Now, does it make a bit more sense why Gold & Silver have soared this year?
I hate to keep harping on JPY, but it is important to all traders/investors in all asset classes, not just FX.
THANK YOU for getting me to 5,000 followers! 🙏🔥
Let’s keep climbing.
If you enjoy the work:
👉 Boost
👉 Follow
👉 Drop a solid comment
Let’s push it to 6,000 and keep building a community grounded in truth, not hype.