DeGRAM | GOLD held mirror support📊 Technical Analysis
● XAU/USD has established a clear up-trend after rebounding from the $4,046 support and breaking above the descending resistance line; the new rising channel from early November signals buyers are in control.
● The price is now approaching the $4,138 resistance zone. A pullback to the channel’s support near ~$4,080 could offer a low-risk entry before extension toward next resistance near $4,377.
💡 Fundamental Analysis
● Gold is benefiting from softening U.S. inflation expectations and subdued Treasury yields, which weaken the dollar and enhance the appeal of safe-haven assets.
✨ Summary
Support around $4,046, target $4,377. Uptrend intact, breakout confirmed, favourable fundamentals support continuation.
-------------------
Share your opinion in the comments and support the idea with a like. Thanks for your support!
Gold

XAUUSD Short: Rejection From Supply Targets $4,070 Demand LineHello traders! Gold (XAUUSD) is showing signs of a potential corrective move after a strong bullish rally from the $3,950–$3,970 Demand Zone, where multiple fake breakouts confirmed the presence of strong buyers. This area coincides with the ascending Demand Line, which has provided consistent support for price growth. Each touch on this line has led to notable bullish impulses, signaling accumulation and strengthening buyer momentum.
Currently, the price approached the $4,140–$4,160 Supply Zone, which aligns with both a Supply Line and the neckline of a previous Double Top pattern. This confluence area represents a critical resistance zone where sellers have historically regained control. The current rejection from this level suggests that a short-term pullback could be underway as the market seeks to retest lower support.
I expect the first key area to watch is the $4,070 pivot level, which aligns with the Demand Line. This zone is expected to act as dynamic support for a potential rebound. If price holds above this level, the bullish structure remains valid, with a possible retest of the $4,150–$4,160 Supply Zone. However, a confirmed break below $4,070 could trigger a deeper correction toward the $3,950 Demand Zone, where fresh buying opportunities may emerge. Manage your risk!

GOLD Will Move Lower! Sell!
Take a look at our analysis for GOLD.
Time Frame: 1h
Current Trend: Bearish
Sentiment: Overbought (based on 7-period RSI)
Forecast: Bearish
The price is testing a key resistance 4,235.87.
Taking into consideration the current market trend & overbought RSI, chances will be high to see a bearish movement to the downside at least to 4,172.53 level.
P.S
We determine oversold/overbought condition with RSI indicator.
When it drops below 30 - the market is considered to be oversold.
When it bounces above 70 - the market is considered to be overbought.
Like and subscribe and comment my ideas if you enjoy them!

ETH/USD (1H timeframe) ...ETH/USD (1H timeframe) on Coinbase, and it’s clearly showing a raisin trendline test with two downside “Target Points” already drawn. Let’s break it down:
---
🔍 Chart Analysis
Price is $3,441, sitting right on the ascending trendline.
Ichimoku Cloud is turning bearish (price below the cloud).
Trendline break looks likely — momentum is weak and candles are closing below the cloud.
Two target zones (downside) are marked on my chart.
---
📉 Bearish Breakdown Scenario
If ETH breaks and closes below the ascending trendline (~$3,440 area):
First Target (TP1): around $3,230 – $3,250
→ This aligns with previous horizontal support and midpoint of the last bounce.
Second Target (TP2): around $3,000 – $3,050
→ This is my deeper support zone — the next strong demand level on the chart.
---
⚠ Invalidation / Stop-Loss
If ETH closes back above $3,520 – $3,540, that would invalidate the bearish move (trendline reclaim + cloud flip).
---
🧭 Trade Summary
Entry (Breakdown): Below 3,440
TP1: 3,240
TP2: 3,020
SL: 3,540

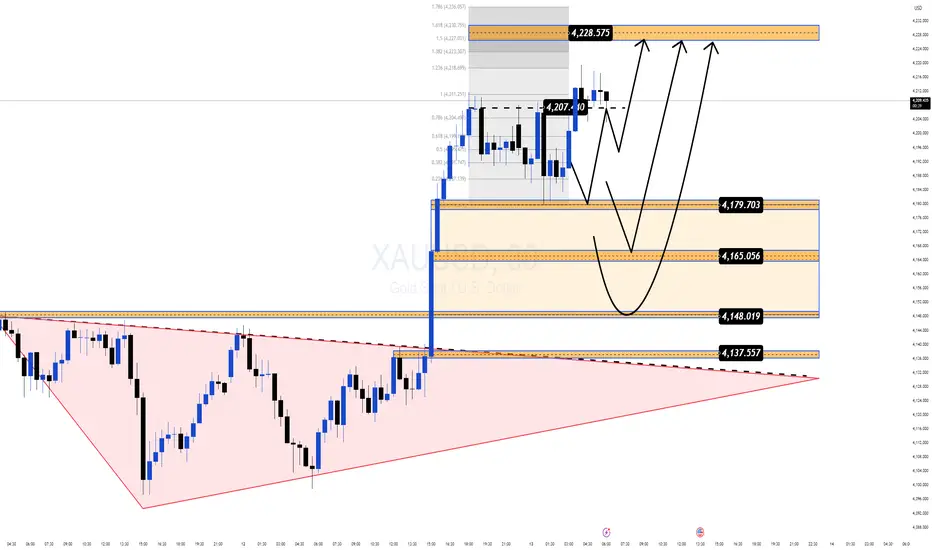
Gold Hits a 3 Week High but the Real Move Might Still Be LoadingGold just tapped $4,213 — the highest level in three weeks, powered by growing expectations of a dovish Fed and optimism around the potential reopening of the US government.
But the real story isn’t the headline spike — it’s the structure forming right beneath it.
📌 Why this zone matters right now
Price is pulling back into $4,179–$4,165, a clean Demand zone aligning with Fibo + breakout structure.
Buyers remain firmly in control despite a mild USD recovery.
The market swept liquidity around $4,207, hinting at accumulation before the next expansion.
The broader pattern resembles a falling-wedge breakout, often appearing before strong upside continuation phases.
🎯 Most Probable Scenario (Mind Insight)
Gold is in a “compression before expansion” phase.
Once this squeeze resolves, momentum is likely to continue in the direction that’s already dominant — and right now, that’s the bulls.
🔶 MMF BUY Zone
$4,179 → $4,165
Looking for a shallow pullback before the next leg.
🔼 Bullish Targets
• $4,207 (liquidity tap)
• $4,228 (Fibo 1.618)
• $4,236 (Fibo 1.786 — major reaction zone)
🧠 Key Takeaway
As long as Gold holds above $4,165, the bullish structure remains intact and the upside expansion toward the upper Fibo cluster stays in play.
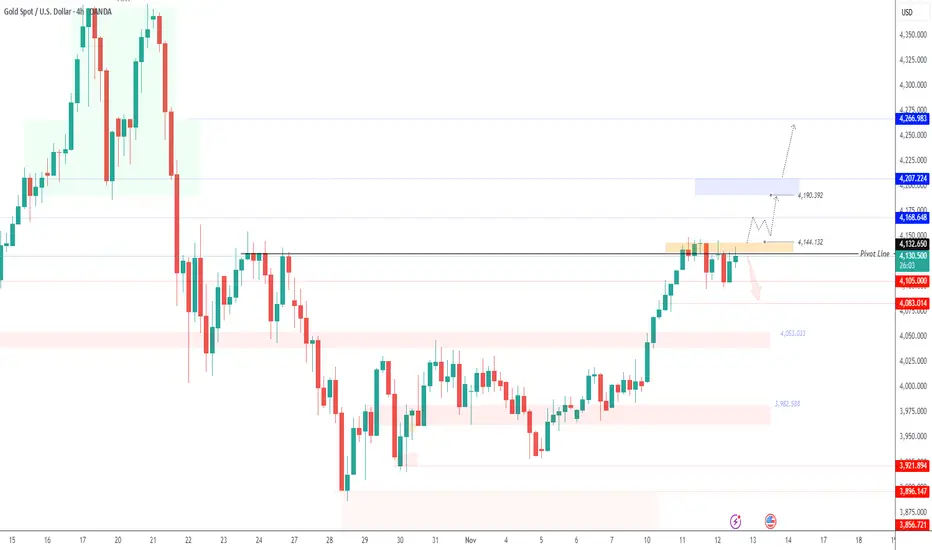
Shutdown Deal in Focus | Gold Prices Pause Before Key VoteGOLD | Overview
Gold steady ahead of U.S. House vote on government reopening.
Gold prices remained steady on Wednesday as investors awaited a U.S. House of Representatives vote on a deal to reopen the federal government, an outcome that could restore economic data visibility and shape expectations for future Federal Reserve rate cuts.
Technically:
Gold maintains a bearish bias while trading below the 4132–4144 pivot zone, with downside potential toward 4104, and a break below this level could extend losses to 4083 and 4053.
However, a 1H close above 4145 would shift sentiment to bullish, targeting 4168 and 4190, with further extension possible toward 4207.
Pivot Zone: 4132 – 4144
Resistance: 4168 · 4190 · 4207
Support: 4104 · 4083 · 4053
USD/CHF (2h timeframe)..USD/CHF (2h timeframe), here’s what I can interpret:
The chart shows a descending move after a peak around 0.9100, followed by a break below the Ichimoku cloud (bearish signal).
There’s a trendline drawn from previous swing lows that the price has recently broken.
The support zone around 0.8000 has been retested as resistance (classic breakdown–retest setup).
A blue arrow points downward toward a labeled Target Point, suggesting a projected bearish continuation.
From my markings, the target point appears to be around 0.78300 — this seems to be your projected take-profit zone based on the measured move.
✅ Summary:
Entry: Around 0.8000 (after retest)
Current Price: ≈ 0.7992
Target: 0.7830
Stop Loss (suggested): Above 0.8030–0.8050 (above the retest zone)
That gives about a 1:2 risk-reward ratio, assuming a ~20 pip stop and ~160 pip target.

XAU/USD – Rate Cut Hope vs Supply Trap?🌐 MARKET CONTEXT
Gold is trading near elevated levels as markets increasingly price in a rate cut by Federal Reserve in December. Spot gold climbed above US$4,130/oz driven by a weaker dollar and relief over the U.S. government shutdown ending.
Reuters
+2
Saxo Bank
+2
Despite this strength, analysts still view gold as being in a corrective range, awaiting key U.S. inflation data and monetary-policy signals.
The Economic Times
+1
Sentiment is tilted toward risk-on for gold (i.e., bullish) given dovish expectations, but the upside is capped by supply zones and the possibility of a rejection if data surprises to the upside for the dollar.
For the upcoming London → New York sessions, expect volatility and trading around structural zones rather than trending breakout.
Bias for today: Conditional bullish, but prepared for a bearish bias if supply triggers rejection.
📉 TECHNICAL ANALYSIS (SMC + Liquidity Structure)
Price is in a broad up-trend, but currently approaching high-probability supply zones where prior imbalances may repeat.
Key structures to monitor:
A potential BOS (Break of Structure) upward if demand zones hold.
A potential CHoCH (Change of Character) if supply rejects and price turns lower.
Demand zones: strong structural support and liquidity pools lie lower in the 3,900s region.
Supply zones: clusters of untested supply exist near 4,080 + where stop-runs and trap buys may occur.
Confirmation factors: liquidity sweeps (stop-loss hunts), fake breakout then reversal, mid-timeframe (M5/M15) rejection candles.
Example logic: If price enters 4,080-4,078 zone and shows a wick, then rally fails → likely a supply trap and short scenario. Conversely, if price falls into 3,990-3,988 and sweeps then reverses → possible CHoCH to bullish.
🔑 KEY PRICE ZONES
4,080 – 4,078 ▶️ Sell Zone – High-probability supply, reactive short.
4,161 – 4,163 ▶️ Buy Zone – Higher structural support / breakout-target area for long.
4,081 – 4,083 ▶️ Buy Zone – Mid-structural demand zone, smaller long setup.
3,990 – 3,988 ▶️ Buy Zone – Deep support, high reward if confirmed.
Stop-loss levels:
For sell zone: 4,086
For buy zone (4,161): 4,155
For buy zone (4,081): 4,075
For buy zone (3,990): 3,982
⚙️ TRADE SETUPS
✅ BUY SCENARIO 1 – STRUCTURAL HIGH BUY
Entry: 4,161 – 4,163
Stop-loss: 4,155
TP1: ~4,180 TP2: ~4,210 TP3: Open
Logic: A strong bounce in this zone indicates continuation of bullish structure, valid for London session.
✅ BUY SCENARIO 2 – MID-DEMAND REACTION
Entry: 4,081 – 4,083
Stop-loss: 4,075
TP1: ~4,100 TP2: ~4,135 TP3: Open
Logic: Reactive long in mid-structure; lower risk, good for intraday.
✅ BUY SCENARIO 3 – DEEP SUPPORT ACCUMULATION
Entry: 3,990 – 3,988
Stop-loss: 3,982
TP1: ~4,020 TP2: ~4,060 TP3: ~4,100+
Logic: High reward scenario if price sweeps down and reverses from strong support.
⚠️ SELL SCENARIO – NY SESSION SUPPLY REJECTION
Entry: 4,080 – 4,078
Stop-loss: 4,086
TP1: ~4,040 TP2: ~3,990 TP3: ~3,930
Logic: Supply zone with liquidity; if price enters and shows rejection → shift to short bias.
🧠 NOTES / SESSION PLAN
London session: focus on buy setups from zones at 4,081 and 3,990.
NY session: monitor sell scenario around 4,080–4,078 for reactive short.
Avoid entering right on news release; wait for structure confirmation (M5/M15).
Maintain risk ≤ 2% per trade; trail stops after TP1 hit.
Be aware of macro risk: U.S. inflation data and Fed commentary may cause sudden moves.
If price gets stuck or choppy in zone without confirmation → stay out rather than forcing a trade.
🏁 CONCLUSION
Today’s bias: conditional bullish, favouring longs from confirmed support zones 4,161–4,163, 4,081–4,083, and 3,990–3,988.
But remain ready to switch to a bearish scenario if price triggers the supply zone at 4,080–4,078 and displays rejection.
Trade with discipline, wait for confirmation, and manage risk strictly.

US100 – Consolidation Between FVGs, Watching for Bullish BreakouHello traders,
On the daily timeframe, NASDAQ (US100) is currently consolidating between a bullish and a bearish Fair Value Gap (FVG). Both sides present clear liquidity areas, and the market is preparing for its next directional move.
From my perspective, I’d like to see the price tap into the bullish FVG first, react from that zone, and then invalidate the bearish FVG on its way higher.
If this scenario plays out, the next targets would be the equal highs (EQH) and eventually a new all-time high (ATH).
However, if a daily candle closes below the bullish FVG, this idea becomes invalid and we could expect further downside movement.
For now, I remain bullish while the bullish FVG holds. 📈
💌It is my honor to share your comments with me💌
🔎 DYOR
💡Wait for the update!

Gold Bullish Strategy AnalysisGold has ended its three-week consolidation phase, and the technical trend remains upward. The daily chart shows a strong six-day winning streak, with the 10-day and 7-day moving averages (MA10/MA7) trending upwards to their current levels of 4053/4083. The 1-hour and 4-hour charts show the Bollinger Bands widening upwards, with the price trading in the upper half of the bands. The moving average system is also trending upwards, the MACD histogram is showing increasing momentum, and the RSI is hovering near 70. The trading strategy for gold remains unchanged: buy on dips!
Looking at the current 4-hour chart, short-term moving averages are turning upwards. The key is whether positive news can sustain the upward momentum. A further upward breakout is possible on Thursday and Friday, but we need to pay close attention to the strong resistance area above 4250. Short-term support is around 4150. If the price continues to trade above 4150, it indicates that the bullish trend remains intact.
Key Levels:
First Support: 4180, Second Support: 4153, Third Support: 4131
First Resistance: 4210, Second Resistance: 4248, Third Resistance: 4266
Gold Trading Strategy:
Buy: 4160-4165, SL: 4150, TP: 4180-4190;
Sell: 4250-4255, SL: 4265, TP: 4230-4220;
More Analysis →

Gold (XAUUSD): Possible buy setupGold (XAUUSD): Possible buy setup. Wait for a candle close to buy.
Cheers

XAU/USD | Watch Gold at $4100 – Pullback or Continuation Ahead?By analyzing the Gold chart on the 2-hour timeframe, we can see that after the last analysis, the price dropped from $3997 to $3984, then quickly found strong demand and started a powerful rally, breaking the $4040 resistance.
At the moment, Gold has reached the $4100 zone. A short-term pullback from this level is likely, but after a brief correction, I expect the uptrend to continue. The next bullish targets are $4140, $4156, and $4162.
Please support me with your likes and comments to motivate me to share more analysis with you and share your opinion about the possible trend of this chart with me !
Best Regards , Arman Shaban

Gold price analysis November 13
Gold continues to maintain its bullish momentum after successfully breaking above the 4150 resistance zone. This breakout confirms the strength of the uptrend, with the recently broken area now acting as a solid support base. The next target that buyers are likely aiming for is around 4250, before testing the all-time high zone.
From a trading perspective, the focus remains on BUY setups—either on breakout entries or pullbacks to support. As long as price holds above 4150, the bias stays bullish and traders can consider holding positions to extend profits along the trend.
BUY setup: Watch for price reaction around 4150 support
💬 Feel free to share your thoughts and analysis below. I’d love to hear different perspectives from the community!

USDCAD still going DOWN.USDCAD is in a pullback and showing signs of pulling back down with about 1:2 RR.

GOLD: Bearish Continuation & Short Signal
GOLD
- Classic bearish formation
- Our team expects pullback
SUGGESTED TRADE:
Swing Trade
Short GOLD
Entry - 4232.5
Sl - 4252.7
Tp - 4194.9
Our Risk - 1%
Start protection of your profits from lower levels
Disclosure: I am part of Trade Nation's Influencer program and receive a monthly fee for using their TradingView charts in my analysis.
❤️ Please, support our work with like & comment! ❤️

Moon Boys don't want you to see this Bitcoin/Gold chart !Hi Guys,
We have a massive head & shoulders on the Bitcoin / Gold chart that almost nobody talks about! With all the major players being openly bullish on Bitcoin and while everyone is waiting for the AI bubble to burst ..Bitcoin will be the first one to react considering how easy it can be sold and how volatile it usually is.
The charts don't lie and all markets are clearly at the top so protect you capital at all cost while you still can.
Let me know what do you guys think about this.

Gold Testing H4 Supply – Eyes on Retrace SetupAfter a clean bullish expansion last week, Gold is now testing a 4H bearish FVG around 4,200–4,240. Price is currently holding below the day’s open (4,203), suggesting potential short-term weakness.
If we stay below 4,203, I’ll look for a corrective move toward the 4H bullish FVG just below the previous day’s low (around 4,060–4,090).
Above 4,220, the bullish continuation remains valid.
Currently in observation mode — waiting for intraday confirmation before engaging any short bias.

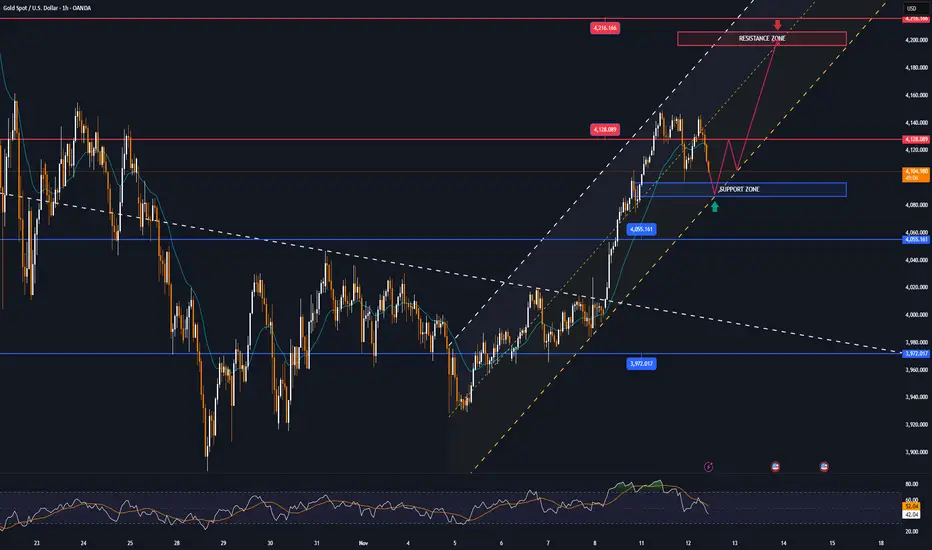
XAU/USD: Bullish Climb to 4225?FX:XAUUSD is positioning for a bullish climb on the 1-hour chart , with price respecting an upward trendline as dynamic support, bouncing from a key support zone that could fuel an upside extension toward multiple resistance levels if buyers sustain momentum. This setup offers a strategic entry amid recent volatility, with potential for breakout if volume picks up.
Entry between 4075-4105 (entry possible at current levels with strict risk management). Targets at 4180 (first) and 4225 (second), yielding a risk-reward ratio greater than 1:3 overall .Set a stop loss on a close below 4063 to limit downside exposure. 🌟 Monitor for confirmation via a strong bullish candle above entry with increasing volume, leveraging gold's safe-haven status.
Fundamentally , today's US economic data, including MBA Mortgage Applications at 13:00 UTC and Fed's Waller speech at 16:00 UTC, could sway USD strength and thus gold prices—hawkish Fed tones might cap upside, while softer data supports bulls. Recent analysis notes gold slipping below $4140 on a double top, signaling short-term pullbacks but with rebound potential testing pivotal resistance. 💡
📝 Trade Setup:
🎯 Entry Zone: 4075 – 4105 (entry possible at current levels with strict risk management)
💰 Targets:
1️⃣ 4180 – initial resistance zone
2️⃣ 4225 – secondary target / take-profit zone
❌ Stop Loss: Close below 4063
📈 Risk-to-Reward: Greater than 1:3 overall, depending on execution and scale-out strategy
What's your take on this gold move? Comment below!💡

XAUUSD: Market Analysis and Strategy for November 12Gold Technical Analysis:
Daily Resistance: 4192, Support: 4030
4-Hour Resistance: 4155, Support: 4080
1-Hour Resistance: 4150, Support: 4100
From a technical perspective, the monthly/weekly charts clearly indicate a short-term upward trend. The "rounded bottom" pattern on the daily candlestick chart is essentially confirmed. The previous pullback highs of 4155/4162 are key resistance levels in the short term, potentially leading to a downward technical correction. Short-term caution is advised regarding a test of the previous support/resistance level in the 4185-4180 area. Pay attention to the 4100/4080 support levels; if these levels hold, continue to buy on dips, while also monitoring the continuation of the upward trend after a breakout.
Looking at the 1-hour chart, the moving averages are converging, and the candlestick pattern forms a range-bound trading pattern between 4100 and 4150. The MACD/KDJ indicators provide upward momentum, but the short-term market continuity remains to be seen. During the European and American sessions, watch for potential resistance and a pullback around 4145/4150.
Trading Strategy:
BUY: 4105~4100
SELL: 4145~4150
More Analysis →

GBPCHFGBPCHF at a major SUPPORT zone. Getting some confirmation for reversal. Also looking for a Break of pattern.

GOLD: Look For Bullish Breakout From The +FVGIn this Weekly Market Forecast, we will analyze the Gold (XAUUSD) for the week of Nov. 10-14th.
Gold has been consolidating in a +FVG since last week... and it is still holding! Wait for price to break the high of the consolidation and then look for long setups.
Be mindful that price may sweep the sell side LQ before it moves higher.
Enjoy!
May profits be upon you.
Leave any questions or comments in the comment section.
I appreciate any feedback from my viewers!
Like and/or subscribe if you want more accurate analysis.
Thank you so much!
Disclaimer:
I do not provide personal investment advice and I am not a qualified licensed investment advisor.
All information found here, including any ideas, opinions, views, predictions, forecasts, commentaries, suggestions, expressed or implied herein, are for informational, entertainment or educational purposes only and should not be construed as personal investment advice. While the information provided is believed to be accurate, it may include errors or inaccuracies.
I will not and cannot be held liable for any actions you take as a result of anything you read here.
Conduct your own due diligence, or consult a licensed financial advisor or broker before making any and all investment decisions. Any investments, trades, speculations, or decisions made on the basis of any information found on this channel, expressed or implied herein, are committed at your own risk, financial or otherwise.

GOLD volatility, monetary policy and political riskThe global OANDA:XAUUSD went through a volatile trading session on Tuesday, as prices fell more than $50 in the North American session before recovering around $30, ending the day in the green. As of Wednesday morning, November 12, spot gold stood at around $4,128/ounce, up around $2 on the day.
The main drivers of this development came from two opposing factors: the prospect of the Federal Reserve (Fed) possibly cutting interest rates in December, and capital withdrawals from gold ETFs after a long rally.
Policy pressures and labor market signals
U.S. private payrolls data, according to preliminary estimates from ADP Research, showed a weekly average of 11,250 job cuts in the four weeks ended October 25. The weaker-than-expected figure sent the dollar to a low of 99.29, giving gold a chance to rebound.
The move comes just as Washington is about to end its longest government shutdown in history, which has stalled the release of economic data. Investors are hoping the reopening of the government will quickly bring a wave of pent-up data that will help better determine the true state of the U.S. economy.
“As the government reopens, we’re going to start seeing more cracks in the economy,” said Marc Chandler, chief strategist at Bannockburn Global Forex. This expectation reinforces the belief that the Fed will begin its easing cycle in December. According to the CME FedWatch tool, the probability of a rate cut has risen to 64%, while Fed Governor Milan hinted at the possibility of a 50 basis point cut due to a weak labor market and slowing inflation.
ETF Profit Taking, Gold Temporarily Adjusts
However, gold’s rally was capped by profit-taking in the ETF market. Bloomberg data shows gold ETFs have seen four straight weeks of outflows, after eight weeks of net buying. “Every 1% move in the gold price translates into about 10 tonnes of ETF outflows,” said Michael Haigh, head of FIC research at Société Générale.
The reversal reflects investors’ defensive sentiment after gold peaked at $4,380 an ounce in mid-October, a new record high amid political uncertainty and expectations of lower interest rates. Still, safe-haven demand was strong enough to help prices recover to $4,126.77 by the end of Tuesday’s session, up 0.3%.
US Politics: A lull ahead of data
The US Senate has passed a deal to reopen the government, while the Republican-controlled House is expected to approve it this week, before it goes to the White House for President Trump to sign into law. The reopening of the government not only ends the government shutdown but also sets the stage for a new cycle of data releases, including official jobs and inflation reports.
Medium-term outlook: Gold demand remains strong
Despite short-term volatility, fundamentals remain supportive of gold. The precious metal has risen more than 55% year-to-date, on track for its biggest gain since 1979. “The medium-term support from global easing to central bank demand remains intact,” said Christopher Wong, a strategist at OCBC.
Summary
The gold market is operating in a cycle of monetary policy expectations and geopolitical safe-haven sentiment. As the Fed moves closer to easing and delayed data looms, price volatility is likely to remain high.
However, with sustained central bank buying and global risks remaining intact, gold remains a strategic asset in a reshaping global financial landscape.
Technical analysis OANDA:XAUUSD
Gold prices are maintaining a short-term uptrend channel formed from the October bottom. After a deep correction around $3,970 – $3,850/ounce (corresponding to the Fibonacci levels of 0.382 and 0.5), the price has bounced back and is currently trading around $4,123, close to the technical resistance zone of Fib 0.236 at $4,128.
The moving average (MA21) is currently at $4,055, acting as a dynamic support zone in the short term. The recent candlestick structure shows that the bullish momentum is being consolidated with a series of higher lows, while the RSI has recovered towards 55, confirming that the bullish momentum is regaining the upper hand.
If gold holds above the $4,055 zone, the next upside targets are:
• Near resistance: $4,216 – $4,220 (psychological level and 0.236 Fibonacci resistance zone).
• Extended resistance: $4,308 – $4,380 (historic old peak zone).
On the contrary, if the price loses $4,055, the $3,972 – $3,846 zone will become the main support zone to watch, corresponding to the lower boundary of the current uptrend channel.
The overall trend remains bullish, provided the $4,055 support zone holds. The current phase is a recovery accumulation phase, which could open up a further rally towards $4,300 if US economic data continues to be weak and the Fed reinforces easing expectations.
SELL XAUUSD PRICE 4201 - 4199⚡️
↠↠ Stop Loss 4205
→Take Profit 1 4193
↨
→Take Profit 2 4187
BUY XAUUSD PRICE 4090 - 4092⚡️
↠↠ Stop Loss 4086
→Take Profit 1 4098
↨
→Take Profit 2 4105
XAUUSD Trade Setup: Gold at Resistance, Here's my Trade PlanXAUUSD Gold has seen a strong rally recently, pushing into a key resistance zone 🧱. With capital currently rotating out of safe-haven assets like gold and flowing into the stock markets, we could see a potential pullback from this level. 📉
At the moment, I’m avoiding buying at a premium price. Instead, I’ll be watching for a retracement back into equilibrium — around the 50% level of the recent swing range ⚖️.
If price pulls back, then breaks market structure to the upside, that could confirm renewed bullish momentum, and I’ll be looking for a long entry setup from that point. 🚀
⚠️ This analysis is for educational purposes only and not financial advice.
