Weekly chart XAUUSD special moment: 4 bulls!October 2023, was the last time a golden cross occurred on the gold price.
The picture shows the profit that followed.
It can be a while to take traction but when it does it will be weeks months of good times.
Goldencross

BlackBerry still encrypts, just not phones anymoreBB closed the week at 4.28. The weekly chart shows a symmetric triangle forming after a fully completed falling wedge. The key point is that price has already reacted from the 0.618 Fibonacci level near 4.00, which aligns with the highest volume area on the Volume Profile and a clear demand zone. A golden cross between MA50 and MA200 on the weekly timeframe adds strong confirmation to the medium term bullish structure. As long as price holds above 4.00, the setup remains constructive with upside potential toward 6.00 and 8.35.
On fundamentals as of December 14, 2025, BlackBerry continues its shift into cybersecurity and software solutions. Fiscal year revenue is around 1.05 billion dollars, with steady growth in IoT and QNX driven by automotive and industrial contracts. Cash reserves exceed 250 million dollars, debt remains limited, and management is focused on margin expansion and strategic partnerships.
BlackBerry is no longer chasing hype, it is quietly building infrastructure.Sometimes the quiet names move first.

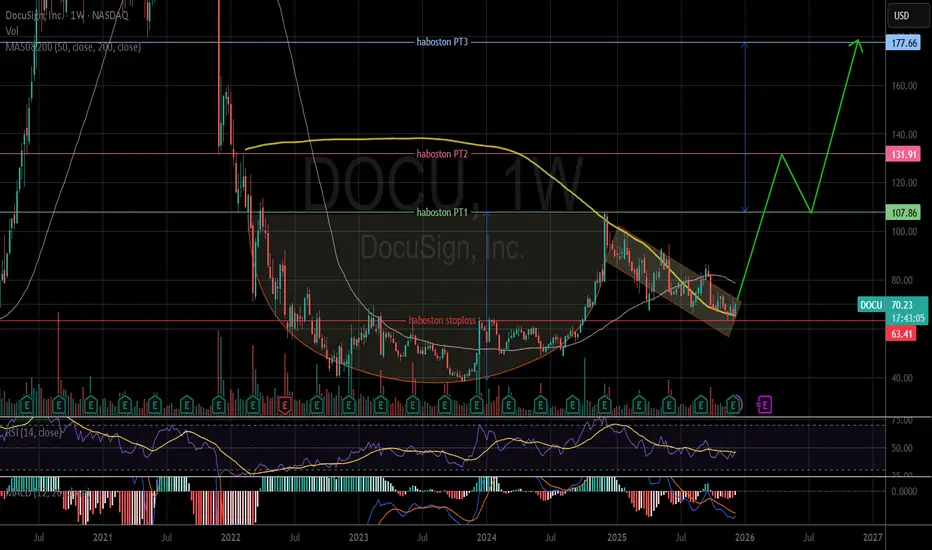
DOCU - Cup and Handle pattern on Weekly chartDOCU has completed a Cup and Handle pattern. Hopefully, a breakout will occur in the near future. This is a weekly chart, so it is suitable for long-term investment.
However, a stop-loss should still be considered because anything can happen.
The price closed today (12.11.2025) is $70.23.
Target $107.86/ $131.91/ $177.66.
Stop loss $63.41.
IMO, an amateur trader.
Good luck!
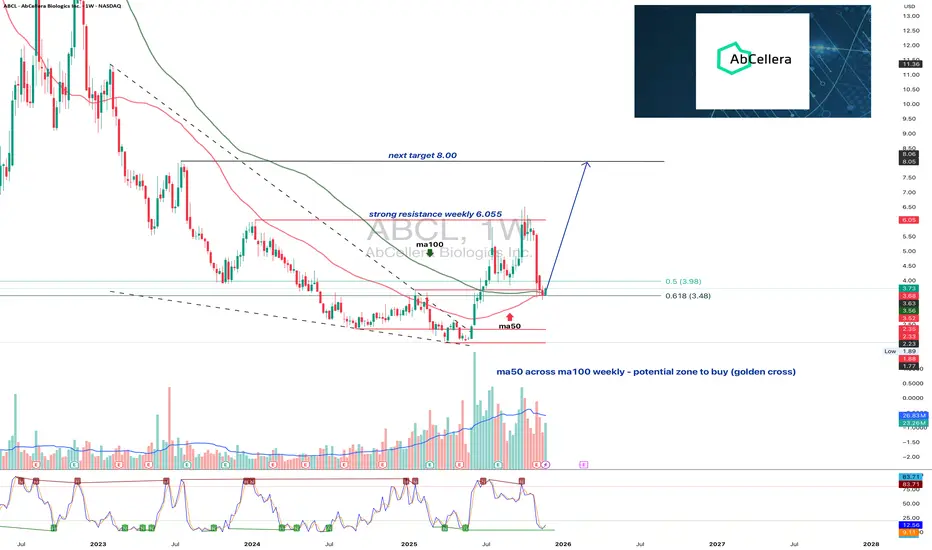
ABCL1W: turning around or just another biotech placeboABCL returns to key weekly support and prepares for the next move
ABCL has tested the strong weekly support zone between 3.48 and 3.98. This area combines Fibonacci retracement levels, a previous breakout retest and an important signal with ma50 crossing above ma100. Such a combination often forms a reliable accumulation zone. Buyers reacted immediately from this region which confirms active demand. The nearest key resistance is located near 6.05. A confident close above this level opens the path toward the next target at 8.00.
AbCellera operates in the biotechnology sector and develops advanced antibody discovery platforms for pharmaceutical partners. Revenue remains uneven due to milestone based payments. However the company maintains a strong balance sheet, significant cash reserves and a growing number of active programs. Improving sentiment in the biotech sector enhances the fundamental backdrop.
As long as price remains above the 3.48 to 3.98 area, the structure retains the signs of a forming medium term base. If this zone is lost, the market may shift into wide consolidation. The present reaction suggests that buyers are defending the level with confidence.
Support levels often speak louder than headlines. The chart usually warns long before the news arrives.
STLA - Golden crossSTLA had a Golden Cross on November 18, 2025. Now it will begin the recovery phase for this stock. The stock price is above all MA20, MA50, and MA200. Both RSI and MACD indicators support the uptrend. Hopefully, this prediction is accurate.
The price on 11.28.2025: $10.66 (Entry).
Price target: $11.43/ $13.12/ $17.81/ $25.38
Stop loss: $10.14.
IMO, amateur trader.
Good luck!

ANNX 1D - pennant before the next impulse?On the daily chart, Annexon Inc. is forming a bullish pennant after a strong upward move — a classic continuation pattern often signaling the next wave of momentum.
The price remains above the 50-day and 200-day moving averages, with a golden cross confirming that buyers are still in control.
The key support zone is $2.70–2.90, while Fibonacci targets sit at $4.29 and $5.69 if momentum continues.
From a fundamental view , Annexon stays on investors’ radar as it develops treatments for neurodegenerative disorders - a risky but high-potential biotech niche.
Tactical plan: wait for a confirmed breakout from the pennant. If buyers push through, the uptrend could accelerate fast.
Remember - a golden cross doesn’t always mean golden profits, but it might this time.

PATH - Go in the direction of the WINDOW!PATH - CURRENT PRICE : 17.14
The Japanese Candlestick theory refer to what we call in the West a gap as a window. Whereas the Western expression is "filling in the gap," the Japanese would say, "closing the window."
A rising window is a bullish signal. There is a price vacuum between the prior session's high (that is, the top of the upper shadow) and the current session's low. It is said by Japanese technicians to "go in the direction of the window." This is because windows are continuation signals. Consequently, with the emergence of a rising window, one should look to buy on dips.
PATH has formed three rising windows (gaps upward) in just two weeks that remain unfilled. This pattern suggests strong demand and sustained bullish momentum. Each window shows that buyers overcame sellers before the prior candle closed, reinforcing confidence in the trend.
Furthermore, a Golden Cross has formed for the first time in a long period (look at blue circle), where the 50-day EMA has crossed above the 200-day EMA — a classic long-term bullish confirmation. Notably, the last occurrence of this pattern was in November 2023, making this the first reappearance in over two years, further reinforcing its significance as a potential turning point in market sentiment.
For short-term target is 20.00 and 24.00. For position trader that holds for several months may target around 30.00. Investors holding for approximately one year, the target is 50.00.
ENTRY PRICE : 16.80 - 17.20
FIRST TARGET : 20.00
SECOND TARGET : 24.00
SUPPORT : 14.77 (the low of 08 Oct 2025 candle) - cutloss if price close below support level on closing basis.

LYFT 1W from losses to profit investors believe,but for how longLYFT broke out of its long accumulation range between $8 and $20 and is now consolidating above the breakout level. The “breakout + retest” structure remains intact, with $20–21 acting as key support. A golden cross on the weekly chart confirms a shift toward bullish momentum. As long as price holds above $20, targets stay at $33.33 and $48.48.
Fundamentally , Lyft is in its strongest position in years. In Q3 2025, the company reported its first net profit of about $46 million after years of losses. Revenue grew 11% YoY to $1.68 billion, gross bookings rose 16%, and adjusted EBITDA reached roughly $139 million (+29% YoY). Active riders climbed past 28 million, average revenue per user increased, and corporate and premium rides strengthened overall performance. Cash flow improved, debt levels declined, and operating margins continued to expand.
The main challenge lies in competition and pricing pressure from Uber, as well as in sustaining profitability beyond a single quarter. While optimism is reflected in the stock price, consistent financial performance is now critical for further upside.
Technically, holding above $20 keeps the bullish setup valid. Any pullback toward $21–20 may offer a buy-the-dip opportunity with targets at $33 and $48.
Lyft finally turned profitable - now the real test is proving that growth isn’t just a quarterly anomaly.

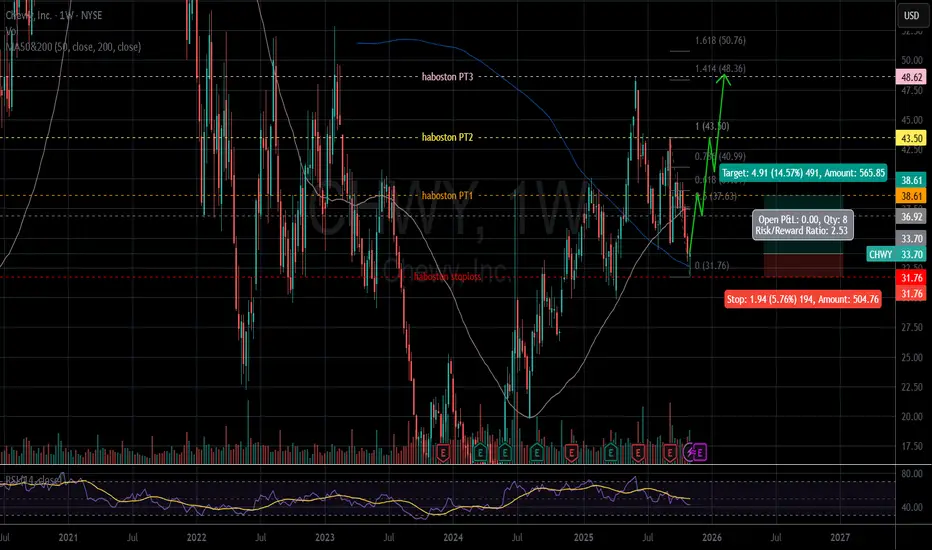
CHWY - Uptrend long term with Golden Cross in Weekly chartIn Daily chart: CHWY is recovering after oversold.
In Weekly chart: The chart has a Golden Cross in July 2025. Price has retested MA200 twice. It is expected that now is the time for CHWY to bounce strongly.
The price closed on 11.07.2025: $33.70 (Entry).
Price target: $38.61/ $43.50/ $48.62.
Stop loss: $31.76 (-5.76%).
IMO, amateur trader.
Good luck!
#ARPAUSDT #1D (ByBit) Chuvashov's fork breakoutARPA did a V-shaped recovery with great increase in volume and about to regain 200MA support.
Golden cross seems around the corner, looks very likely to rally mid-term.
⚡️⚡️ #ARPA/USDT ⚡️⚡️
Exchanges: ByBit USDT
Signal Type: Regular (Long)
Leverage: Isolated (2.0X)
Amount: 4.6%
Entry Targets:
1) 0.02233
Take-Profit Targets:
1) 0.03456
Stop Targets:
1) 0.01743
Published By: @Zblaba
$ARPA BYBIT:ARPAUSDT.P #1D #DeFi arpanetwork.io
Risk/Reward= 1:2.5
Expected Profit= +109.5%
Possible Loss= -43.9%
Estimated Gaintime= 1-2 months

FLNC 1D – The power comeback!On the daily chart, Fluence Energy (FLNC) shows a clean cup and handle formation followed by a golden cross (MA50 crossing above MA200) - a textbook bullish reversal setup.
Price broke out of the structure and is now pulling back into the buy zone ($14.57–$16.80) - a confluence of Fibonacci support and previous resistance.
✅ Golden cross confirms trend reversal
✅ Rising volume supports the move
✅ MAs below price - bulls are in control
The first target sits near $27.43, while the second projection extends to $40.28 if momentum continues.
Fundamentally, Fluence remains a leader in energy storage and grid technology - a hot spot for global investment as the renewable sector accelerates.
Let’s just say - this chart looks fully charged ⚡️

INTC Target Hit, Now Showing Another Bullish Setup!INTC - CURRENT PRICE : 41.53
My earlier INTC buy call has reached its projected targets. The previous analysis is shared below for reference.
Technical Highlights
1) New 52-week High – Price has broken into a fresh yearly high, confirming strong bullish momentum.
2) Pennant Breakout – The breakout from a bullish pennant pattern suggests continuation of the prior uptrend, with a potential target of $49 based on the pattern projection.
3) Golden Cross Intact – The 50-day EMA remains above the 200-day EMA, maintaining the long-term bullish bias.
4) RSI in Bullish Territory – RSI remains above 70, indicating strong momentum and persistent buying strength.
ENTRY PRICE : 40.00 - 42.00
FIRST TARGET : 45.00
SECOND TARGET : 49.00
SUPPORT : 36.43 (the low of 23 OCTOBER 2025 candle)

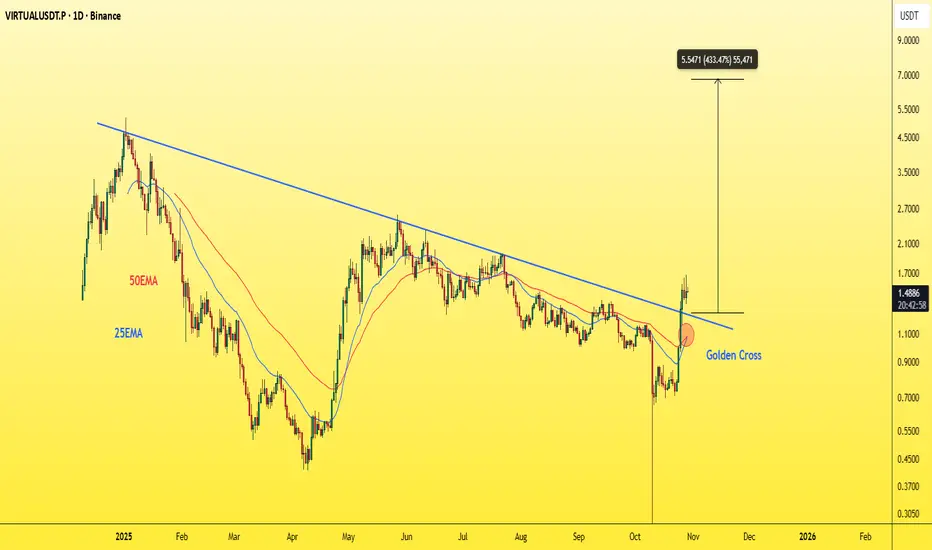
VIRTUAL - Extremely bullishKeep your eyes on it over the next period — it’s about to skyrocket.
It just broke a trendline it’s been trying to break for around 300 days,
and it’s also formed a golden cross on the daily chart.
Best Regards:
Ceciliones🎯
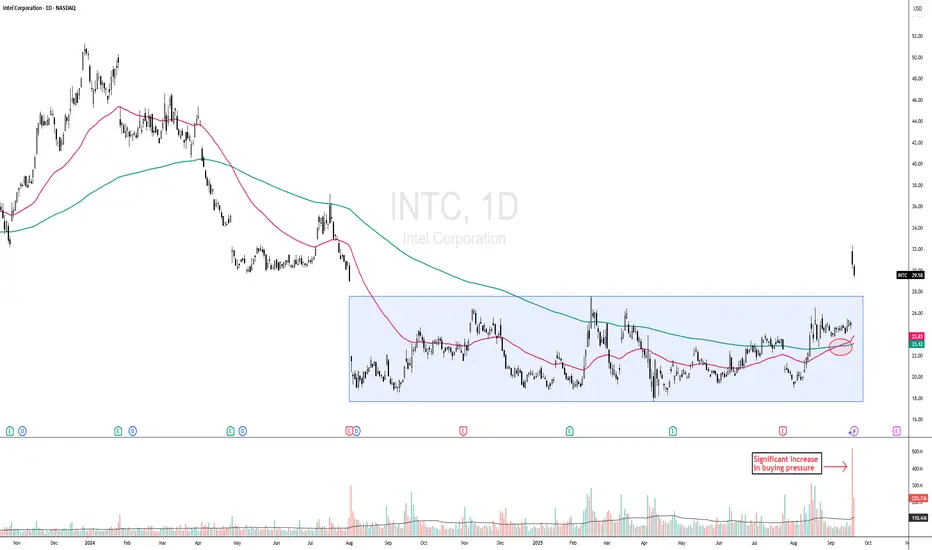
DOW THEORY PLAY - INTC CONFIRMS BREAKOUT FROM ACCUMULATION PHASEINTC - CURRENT PRICE : 29.58
Key Technical Highlights:
1. Breakout from Accumulation Phase with Strong Volume
Intel has successfully broken out of a prolonged sideways accumulation zone. The breakout is accompanied by significantly higher-than-average volume , indicating strong buying interest and institutional participation.
2. New 52-Week High Achieved
Price has breached the previous 52-week high, signaling bullish momentum and the potential start of a new price discovery phase. Historically, such breakouts often attract trend-following traders.
3. Golden Cross Formation (look at the red circle)
A Golden Cross has formed for the first time in a long period, where the 50-day EMA has crossed above the 200-day EMA — a classic long-term bullish confirmation. Notably, the last occurrence of this pattern was in July 2023 , making this the first reappearance in over two years, further reinforcing its significance as a potential turning point in market sentiment.
4. Dow Theory Alignment – Public Participation Phase
According to Dow Theory, this marks the second phase of a major uptrend — the Public Participation Phase — where broader market participants begin to enter following early accumulation by smart money. This phase typically sees strong price advances.
ENTRY PRICE : 28.00 - 30.00
FIRST TARGET : 35.00
SECOND TARGET : 42.00
SUPPORT : 25.00 (CUTLOSS below 25.00 on closing basis)
Note : This is related to point no 1. Markets have a tendency to "fall of their own weight." At bottoms, however, markets require a significant increase in buying pressure, reflected in greater volume, to launch a new bull market. A more technical way of looking at this difference is that a market can fall just from inertia. Lack of demand or buying interest on the part of traders is often enough to push a market lower; but a market does not go up on inertia. Prices only rise when demand exceeds supply and buyers are more aggressive than sellers.
LC 1W: When the Market Spreads Its WingsOn the weekly chart of LendingClub (LC) , a “golden cross” has formed - the MA50 crossing above the MA200 from below, confirming a medium-term trend shift in favor of buyers. The current price of 15.30 is trading within the 0.705–0.79 Fibonacci zone (14.54–15.32), which now acts as a key support after the breakout. Structurally, the asset is moving within a broadening ascending channel, suggesting potential for increased volatility and range expansion.
Technically, the market shows strength: the upward impulse was accompanied by an abnormal spike in volume, both MA50 and MA200 are positioned below the price, and the nearest resistance is at 17.26 (1.0 Fibonacci level). A breakout above this area opens the way to the 1.618 extension at 22.95–23.02. The scenario is invalidated if the price closes below 12.65, which would pull it back into the previous descending structure.
Fundamentally, LendingClub benefits from easing tensions in the US debt market and moderate growth in consumer lending. Positive earnings momentum and the resilience of its business model add further confidence to the bulls.
Tactical plan: as long as the price holds above 14.54–15.32, the medium-term growth scenario remains valid, targeting 17.26 and 23.02. The optimal entry would come after confirming the support hold and spotting a local reversal candlestick pattern on the daily timeframe.
As they say, a golden cross isn’t just an indicator - it’s a first-class ticket to the trend league. Just make sure you don’t miss the flight.

$SOL Bullish Engulfing Weekly CloseSolana is looking good here 👍🏽
Reclaimed the 50WMA and closed above the 50% Gann Level.
Note the Bullish Engulfing candle for the Weekly Close.
However CRYPTOCAP:SOL Still trading within the DANGER ZONE ⚠️
Need these next couple weeks to close outside of this POI.
You can see the Liberation Day lower trendline still remains intact for support and we had the Bullish Cross a few weeks ago on the 20 / 50 WMA 🤓

Oliver Kell's price cycle. longterm 50dmaOliver Kell is a legend swing trader and I thought his price cycle concept makes a lot of sense. I would intuitively use 50dma cycle for price swings. His concept give depth to an idea.
Longterm for less variance outcomes.
#GoldenCross #DeathCross.

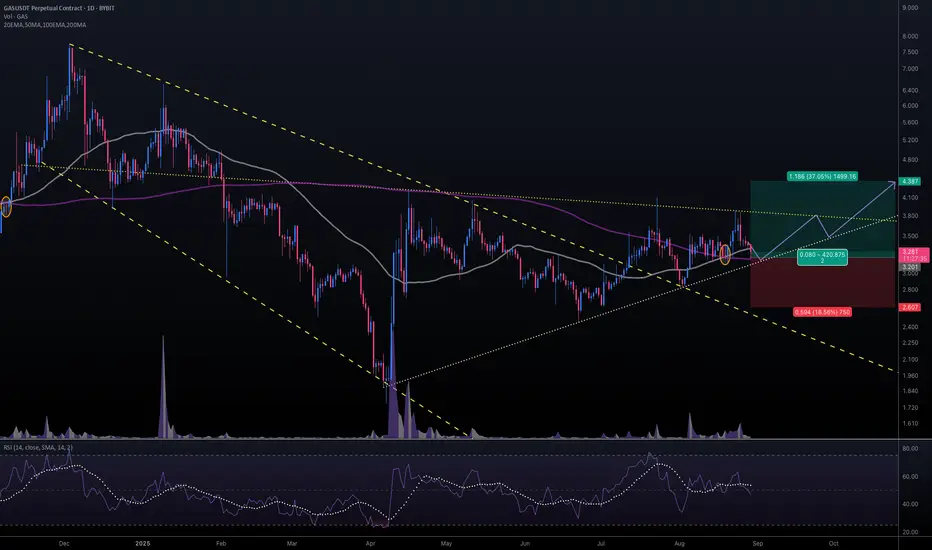
#GASUSDT #1D (ByBit) Falling broadening wedge breakout & retestNeoGas printed a golden cross on daily and a morning star at the same time, just like last year.
Also formed a triangle, seems likely to bounce on 200MA support then break bullish in the coming weeks.
⚡️⚡️ #GAS/USDT ⚡️⚡️
Exchanges: ByBit USDT
Signal Type: Regular (Long)
Leverage: Isolated (2.0X)
Amount: 5.4%
Current Price:
3.281
Entry Targets:
1) 3.201
Take-Profit Targets:
1) 4.387
Stop Targets:
1) 2.607
Published By: @Zblaba
HOSE:GAS BYBIT:GASUSDT.P #1D #NeoGas #dBFT neo.org
Risk/Reward= 1:2.0
Expected Profit= +74.1%
Possible Loss= -37.1%
Estimated Gaintime= 1-2 months
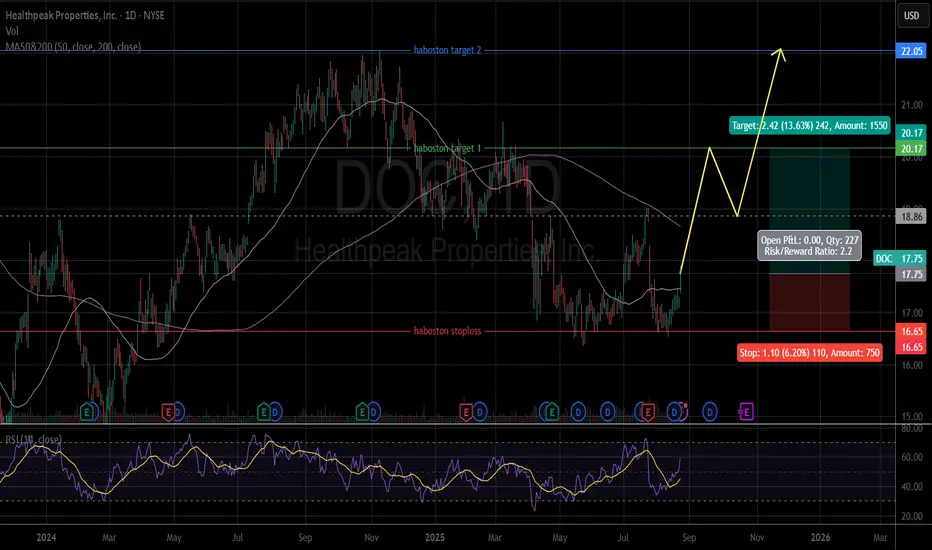
DOC - Uptrend. DOC's price above MA50 and under MA200.
. We have strong support at $16.65.
. Volume was above average last week.
. RSI show uptrend continues.
The price now (Closed on 08.22.2025): $17.75.
Price target: $20.17/ $22.05.
Stop loss: $16.65.
Risk/ Reward ratio: 2.2.
IMO, amateur trader.
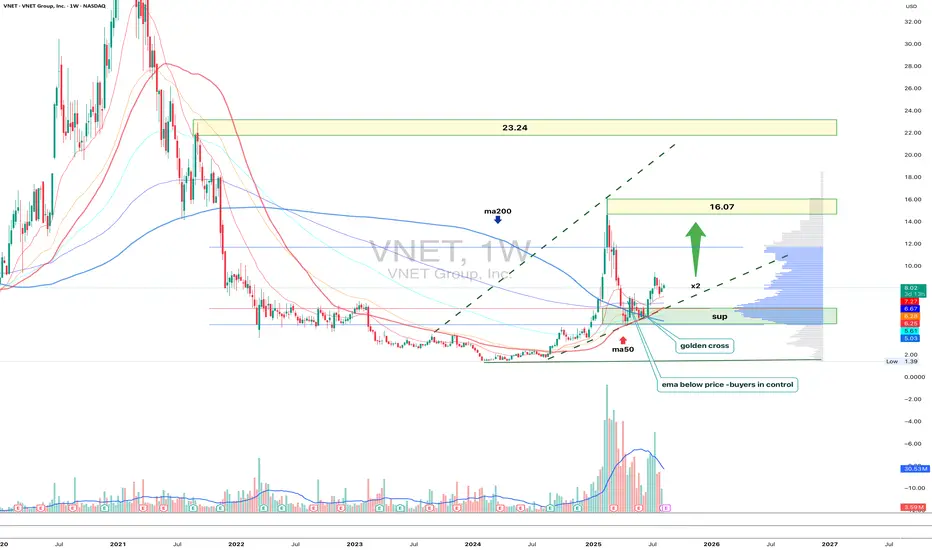
VNET 1W - second wave or second life?On the weekly VNET chart, the price has held above the 6.25–6.05 support zone, which previously triggered an impulsive rally. The current structure remains bullish: the MA50 is positioned above the MA200(golden cross) and ema below price(buyers control situation), and recent volume spikes indicate active buying interest. The next major resistance lies at 16.07 - where a key supply zone aligns with the previous local top. A breakout and consolidation above it would open the path toward the strategic target at 23.24, matching a Fibo extension and a historical distribution zone.
Fundamentally, VNET benefits from renewed investor interest in the Chinese tech sector and improved corporate earnings. Tactical plan: as long as 6.25–6.05 holds, long positions could target 16.07 first, with potential continuation toward 23.24.
A break below support cancels the bullish scenario. Sometimes the market offers a second chance and VNET may be one of those moments worth catching.
ARKK: when a breakout isn’t just a breakout-it’s a runway to $91On the weekly chart, ARKK has broken out of a long-standing ascending channel, ending a year-long consolidation phase. The breakout above $71.40, with a confident close and rising volume, signals a transition from accumulation to expansion. The move came right after a golden cross (MA50 crossing MA200), further confirming institutional interest. Price has already cleared the 0.5 and 0.618 Fibonacci retracements — and the 1.618 extension points to $91.40 as the next technical target.
Momentum indicators like MACD and stochastic remain bullish with room to run. Volume profile shows low supply above $75, which could fuel an acceleration toward the target zone.
Fundamentally, ARKK remains a high-beta, high-risk vehicle — but one with focus. The ETF is positioned around next-gen tech: AI, robotics, biotech, and automation. Assets under management now exceed $9.3B with +$1.1B net inflow in 2025. YTD return stands at 37%, and its top holdings (TSLA, NVDA, COIN) are back in favor. This isn’t just a bet on innovation — it’s diversified exposure to a full-blown tech rally.
Tactical setup:
— Entry: market $69.50 or on retest
— Target: $80.21 (1.272), $91.40 (1.618 Fibo)
Sometimes a breakout is just technical. But when there’s volume, a golden cross, and billions backing it — it’s a signal to buckle up.

SOLUSDT 1D - Bulls back in control with Golden Cross and channelOn the daily chart, SOLUSDT is forming a bullish continuation structure. After the Golden Cross (MA50 crossing MA200), the price is now pulling back toward the midline of the ascending channel and the 0.5 Fibonacci level at 166.38. This confluence with the broken trendline and 200 EMA makes this zone a prime technical area of interest.
Support: 166.38 (0.5 Fibo), EMA200 (161.77), broken trendline
Resistance: 182.84–189.67 (Fibo 0.705–0.79), 206.54, target - 255.93 (Fibo 1.618)
This retracement looks healthy, supported by higher volume during the prior bullish leg. As long as the 166.38–161.77 zone holds, continuation toward 206.54 and potentially 255.93 is on the table.
Fundamentally, Solana remains a key L1 narrative with strong traction in DePIN and AI-linked dApps. The rising TVL and investor sentiment support the trend.
Watch price action around 166 for confirmation - this is the battleground.

GDS 1D - golden cross and key buying zoneOn the daily chart of GDS, price is moving within a steady ascending channel and is now correcting toward the key support zone at 31.08–33.14. This zone is reinforced by the 0.618 Fibo level (33.10), the lower channel boundary, and the cluster of SMA50/100/200 averages, which remain under buyers’ control. On the weekly timeframe, a golden cross has formed, signaling a long-term bullish momentum.
The current structure suggests a pullback into 31.08–33.14, followed by a potential bounce. If demand confirms in this area, the technical target lies at 39.74, with an extended bullish scenario aiming for the 1.618 Fibo at 50.49. A break below 31.00 would invalidate the bullish outlook.
Fundamentally , GDS continues to benefit from rising demand for data centers in China and active infrastructure expansion. The long-term trend is supported by strong capital inflows into the tech sector, though short-term corrections within the channel remain part of the normal cycle.
Tactical plan: watch for reaction in the 31.08–33.14 zone; a confirmed buy signal could trigger entries targeting 39.74 and 50.49. Strong setup, but requires disciplined execution.
