Bitcoin Buyer Zone Reaction Signals Potential Move to $90,500Hello traders! Here’s my technical outlook on BTCUSD (3H) based on the current chart structure. Bitcoin previously traded within a broader bullish context, supported by a rising trendline and a well-defined Buyer Zone around the 88,300–88,600 area. After a strong impulsive move higher, price entered a consolidation range and later formed a corrective descending channel, signaling a temporary pause in bullish momentum rather than an immediate trend reversal. During this correction, multiple fake breakouts occurred near the channel boundaries, highlighting indecision and liquidity grabs on both sides of the market. Recently, BTC broke below the descending channel support and briefly dipped into the Buyer Zone, where buyers reacted and defended the level. This area aligns with a key Support Level and prior structure, making it a critical demand zone to watch. The current price action suggests a corrective pullback within the larger structure, as the move down lacks strong impulsive continuation. Above price, the market is capped by the Seller Zone and Resistance Level around 90,500, which coincides with a previous breakout area and the underside of the former range. My scenario: as long as BTC holds above the 88,300 Buyer Zone and maintains higher lows from this support, the broader bullish structure remains valid. A sustained reaction from demand could lead to a recovery move toward the 90,500 Resistance Level (TP1). Acceptance and a clean breakout above this level would signal renewed bullish strength and open the path for continuation higher. However, a decisive breakdown and acceptance below the Buyer Zone would invalidate this scenario and increase the probability of a deeper corrective move toward lower support levels. For now, price is at a key decision point, with buyers and sellers actively battling for control. Please share this idea with your friends and click Boost 🚀
Market insights

Bitcoin - Starting the final -30% drop!🛟Bitcoin ( CRYPTO:BTCUSD ) is dropping another -30%:
🔎Analysis summary:
The underlying trend on Bitcoin remains clearly bullish. But following the unusual curve channel, Bitcoin perfectly rejected the upper resistance curve. Quite likely therefore that Bitcoin will now create another bullish break and retest and first drop -30%.
📝Levels to watch:
$55,000
SwingTraderPhil
SwingTrading.Simplified. | Investing.Simplified. | #LONGTERMVISION

BITCOIN / GOLD ratio's mind-blowing revelation.Bitcoin (BTCUSD) remains under heavy pressure since its October 2025 All Time High (ATH) but the BTC/GOLD ratio reveals that the real selling pressure in terms of the precious yellow metal has been boiling up for some time before that date.
In fact the ratio's last High was in August 2025, which technically was a Lower High as the true Top for BTC/GOLD's Cycle was in December 2024. Mind-blowing revelation indeed and that undoubtedly draws similarities with the previous Cycle, which also had a Double Top in 2021.
The key indicator here is the 1M RSI of the ratio. It has a Lower Lows trend-line, which has priced all Cycle bottoms since 2015. More recently (since January 2019) there is a diverging Lower Lows trend-line (dashed) also. The tight zone within those two trend-lines may be holding the key for this Cycle's bottom.
This shows that the bottom may be closer than we may expect but the last Bear Cycle showed a slowing down behavior once it approached the RSI Lower Lows and turned sideways before it finally made contact with it 6 months later. For the real BTC/GOLD price action though, the downtrend didn't slow down as much, first breaking violently below the 1M MA50 (blue trend-line) and finding bottom 6 months later as mentioned just above the 1M MA100 (green trend-line).
If we have a decreasing rate on the MA bottoms, we can expect the current Cycle to bottom below the 1M MA100 this time, closer to the 1M MA150 (red trend-line).
So closer than it looks or not in terms of bottom, the Bear Cycle is entering its 2nd and final Phase.
So what do you think about the BTC/GOLD approach? Feel free to let us know in the comments section below!
---
** Please LIKE 👍, FOLLOW ✅, SHARE 🙌 and COMMENT ✍ if you enjoy this idea! Also share your ideas and charts in the comments section below! This is best way to keep it relevant, support us, keep the content here free and allow the idea to reach as many people as possible. **
---
💸💸💸💸💸💸
👇 👇 👇 👇 👇 👇

BTC: Price Update and Likely Next MoveBitcoin managed to break above the 94K resistance level.
That breakout attracted a lot of new long positions, as traders expected a quick move toward higher prices.
Instead of continuing up, price dropped back below 94K.
This move back inside the range likely triggered many stop losses on those fresh longs, turning the breakout into a fake move above resistance.
What This Tells Us About the Market
This behavior suggests the market is not in a clean, one‑directional trend.
Instead, it is hunting liquidity at the edges of the range:
- First above 94K, where breakout traders got trapped.
- Next, potentially below support, where late buyers may be forced out.
In simple terms: the market is shaking out impatient traders at both ends before choosing the real direction.
The Next Likely Move: Under 84K
After the failed breakout above 94K, I now expect a similar pattern on the downside.
The idea is:
- Price may break below 84K and push into a lower zone.
- This would hit stop losses for longs placed just under support.
- It creates panic and forces weak hands out of the market.
Once that liquidity is taken, Bitcoin can quickly reclaim 84K and move back inside the range with more strength.
How This Fits the Bullish Scenario
If this move under 84K plays out, it actually builds up for the next major leg up.
From there, the path toward 100K opens as price pushes away from the range.

BTCUSD | 30M – Range Rotation & Upside ReactionBITSTAMP:BTCUSD
After the impulsive sell-off, BTC entered consolidation and started rotating between range extremes. Recent price action shows support being defended near the lower boundary, suggesting a potential upside rotation toward the range high. This move should be treated as a range reaction, not a trend reversal.
Key Scenarios
✅ Bullish Rotation 🔄 → Reaction from range support targeting the upper range.
🎯 Target 1: 91,100
🎯 Target 2: 92,800
❌ Bearish Continuation 📉 → A decisive break and close below range support would invalidate the bullish rotation and open continuation toward lower liquidity.
Current Levels to Watch
Resistance 🔴: 91,100 – 92,800
Support 🟢: 88,600 – 88,200
⚠️ Disclaimer: This analysis is for educational purposes only. It is not financial advice. Please conduct your own research before trading.

Why 99% of Altcoins Are “Aerotyne”… With a Fan ClubIf you’ve seen The Wolf of Wall Street, you remember that legendary early scene where Jordan Belfort is being told what the stock market really is.
And he gets the most accurate financial definition ever created:
“Fugazi… fugezi… it’s a wazi, it’s a woozy… who gives a f.”*
Now translate that into crypto language and you get:
- Doesn’t matter what the token is called.
- Doesn’t matter what the whitepaper says.
- Doesn’t matter how many buzzwords they stack on top of it like a cursed lasagna.
Because the truth is simple:
It’s not real. It’s smoke. It’s vibes. It’s marketing dressed as math.
And that, my friend, is exactly how 99% of altcoins work.
They’re not investments.
They’re emotions with candlesticks.
The funniest part is that the whole thing has already happened in the movie.
Remember that “Aerotyne” moment?
That random company name no one can pronounce properly?
Aerotyne… Arotine… Aerotine…
It didn’t matter what it was called because he wasn’t selling the stock.
- He was selling the story.
- He was selling the feeling.
- That little dopamine fantasy that whispers: “You’ll pay your morgage.”
That’s basically the entire altcoin market in one sentence.
Now, let me be clear: this isn’t one of those posts where I tell you to “read the whitepaper”, “DYOR”, “be careful guys”, and other sterile advice that sounds smart but doesn’t stop anyone from clicking Buy.
And no, this isn’t coming from bitterness either.
Yes, I’ve lost some money on altcoins last year.
But at least I knew what game I was playing.
- I didn’t marry them.
- I didn’t become their lawyer on Twitter.
- I didn’t start defending my coin like it was my childhood dog.
I took the loss like a man and moved on with one thought:
Alright… enough with small coins.
Because at some point you stop asking “what if it moons?” …and you start asking the adult question: What if it just dies quietly?
And in the altcoin world, that’s not FUD.
That’s not negativity.
That’s just… normal.
Here’s what most people don’t want to admit:
You didn’t buy a coin.
You bought a conversation topic for beer night.
A reason to sit with your friends and pretend you’re not gambling — you’re “investing”.
You bought hours of:
“Bro, have you seen the tokenomics?”
“No, no, you don’t understand… this is Layer 0.”
“Wait, they’re building a new ecosystem!”
“This will change the planet!”
“They’re solving a real-world problem!”
And suddenly you’re not gamblers anymore.
You’re analysts.
Economists.
Visionaries.
You and your friends start comparing coins the way others compare football teams.
Your friend picks one altcoin. You pick another.
And now it’s war.
You defend your token like it’s your club.
He says his coin is better, and you take it personally like he insulted your family name.
“No bro, mine is stronger.”
“Mine has better community.”
“Mine has bigger partnerships.”
“Yours is VC-backed.”
“Mine is organic.”
“Mine is still early.”
Two grown men. Arguing like football fans. Over who chose the better Aerotyne with a modern logo.
That’s what you bought.
Not a coin.
Not an investment.
You bought a social identity.
- A team.
- A badge.
- A belief.
- A conversational piece.
But you also bought something else — something deeper: you bought hope, hope in a dark world.
So when a coin shows up with a clean website, a shiny roadmap, and a promise that sounds like:
“We’re building the future…”
…it doesn’t just hit your wallet.
It hits your psychology.
It hits the part of you that still wants to believe there’s a shortcut to freedom, out the stress, out the routine.
That maybe this is the one thing that finally makes life feel fair.
And there’s nothing wrong with that.
There’s nothing wrong with wanting to believe.
There’s nothing wrong with dreaming.
The problem starts when that hope gets monetized.
Because in crypto, hope isn’t just an emotion.
Hope is a business model.
And yes, some developers are real builders.
But most of them?
- They’re not selling tech.
- They’re selling meaning.
- They’re selling purpose.
- They’re selling belonging.
And trust me — they don’t do it randomly.
They have marketing teams trained in mass psychology.
They understand human behavior better than most traders understand their own charts.
They know:
- people copy influencers,
- people chase excitement,
- people fear missing out,
- people want a tribe,
- people defend what they paid for,
- people confuse “community” with “safety”.
That’s why even dead projects always sound alive.
“Big announcement coming.”
“Major update soon.”
“Partnership incoming.”
“New exchange listing.”
“Something huge is cooking.”
Because the goal isn’t to create value. The goal is to keep hope alive…
And once you see that, you can’t unsee it.
You realize that many altcoins don’t behave like businesses.
They behave like campaigns.
Hype campaigns.
They don’t need revenue.
They don’t need customers.
They don’t even need product-market fit.
They need narrative.
They need a pump.
They need attention.
They need your hope.
And that’s why the new altcoin cycle always looks the same:
The teaser.
The hype.
The “community”.
The influencer wave.
The green candles.
... And then silence.
A slow bleed that turns every proud investor into a long-term philosopher: “I’m holding because I believe in the project.”
No bro.
You’re holding because selling would force you to admit you bought Aerotyne.
So if I had to give one useful piece of advice, it wouldn’t be “DYOR”.
It would be boring.
It would be simple.
It would be this: Trade only big coins .
BTC.
ETH.
SOL.
Use technical analysis.
And most importantly…
Drop the “moon” fantasy.
Because moon trading is not strategy.
Moon trading is religion.
And since I started with a quote, I’ll end with one too.
From the immortals SNAP:
“Don’t believe the hype, it’s a sequel.”
And that’s exactly what most altcoins are.
- Not innovation.
- Not a revolution.
- Not “the next big thing”.
Just a sequel.
An Aerotyne sequel.
An Aerotyne with a community.
An Aerotyne with an X account posting daily optimism.
An Aerotyne with a Telegram group full of people chanting “LFG” while the chart bleeds.
An Aerotyne with a swarm of paid influencers…
…who get copied by thousands of smaller influencers…
…because human psychology never changes:
If you see enough people cheering, you start cheering too.
Even if you don’t know what you’re cheering for.
Even if the coin name sounds like a typo.
Even if deep down you already know…
It’s Fugazi!

Elise | BTCUSD | 30M – Bearish Continuation Below StructureBITSTAMP:BTCUSD
After a sharp sell-off, BTC attempted a corrective pullback but failed to regain acceptance above resistance. The bounce appears corrective rather than impulsive, suggesting sellers are still in control. As long as price remains capped below resistance, downside liquidity remains the higher-probability target.
Key Scenarios
❌ Bearish Case 📉 (Primary) → Rejection from resistance opens continuation toward demand.
🎯 Target 1: 86,200 – 86,000
🎯 Target 2: 84,500 – 84,200
✅ Bullish Invalidation 🚀 → Only a strong break and hold above resistance would negate the bearish outlook.
Current Levels to Watch
Resistance 🔴: 88,200 – 88,400
Support 🟢: 86,100 – 85,900 / 84,500
⚠️ Disclaimer: This analysis is for educational purposes only. It is not financial advice. Please conduct your own research before trading.

Altcoin Investing in 2026: Hype, Risk and Smarter ChoicesBitcoin surges often pull altcoins back into view. New traders arrive chasing memories of huge gains instead of focusing on risk, cycles, and how these markets truly behave.
How BTC and altcoin cycles really work
When Bitcoin runs, the money usually follows a rough sequence:
- Bitcoin comes first. It pulls in traders early because it moves aggressively but still feels like the “safest” crypto asset.
- Then rotation begins. After BTC pumps and starts to consolidate at higher levels, some capital slowly rotates into other coins. Large caps like ETH or SOL usually see interest grow first, then mid‑caps, and finally the smallest and riskiest names.
- The lower you go, the later you are. By the time memecoins and tiny microcaps explode, the cycle is often in its late stages, when 80–90% drawdowns stop being rare and start becoming routine.
Altseason is a short phase within a Bitcoin cycle, not a permanent state. It shows up briefly, burns hot, and then fades.
Why most people lose money on altcoins
Psychology matters more than any pattern you can draw on a small-cap chart.
- Late FOMO entries. Fear of missing out appears when prices move too fast. Buyers jump in late, hoping the rally never ends. It often ends right after they do. Chasing candles rarely ends well.
- Emotional attachment to entry price. Many holders get stuck on “my buy level.” They refuse to cut losers, waiting endlessly to get back to break-even while odds of recovery shrink. Hopes stay high as numbers grind lower, driven more by memory than logic.
- Hype over substance. Only a minority of new projects actually ship something useful. Most survive on bold promises and clever tokenomics. Treating them as serious long‑term investments is usually just short‑term gambling in disguise.
When altcoins can make sense
A healthier approach is to flip the structure of your portfolio:
- Base layer: Bitcoin and Ethereum as the foundation.
- Speculative layer: Altcoins treated as experimental bets stacked on top of that base, not underneath it. Your core stays stable; the risky part is clearly separated.
A few practical guidelines:
- Allocate only a slice of your crypto stack – for example, 10–30% – to altcoins, instead of risking everything at once. This keeps risk in its place and prevents one bad narrative from sinking your whole portfolio.
- Focus on coins with:
- Clear, visible teams.
- Real use cases or products.
- Liquidity good enough to enter and exit without massive slippage.
- A track record across at least one full market swing, not just a few weeks of hype.
- Think in scenarios, not fantasies: “How much am I willing to lose if the trend flips quickly?” is more important than “How much could I make if this does a 10x?”.
Most altcoins work better as swing or position trades held for weeks or months with planned exits, not as indefinite “HODL forever” bags. A written plan almost always beats blind patience.
Simple rules to avoid getting burned
- Plan before you buy. Note:
- Why you are entering.
- Where the idea is invalidated (the price level that proves you wrong).
- First profit targets where you will take something off the table.
- Question every narrative. A popular account talking up a coin does not make it valuable. Ask:
- What real problem does this token solve?
- Who actually uses it day to day?
- Would it matter if the token disappeared tomorrow?
- Compare everything to Bitcoin. If an altcoin underperforms BTC for weeks or months, you are accepting more risk for less reward. In that case, holding it “just because” is hard to justify.
The quiet lesson
Altcoins can boost profits during strong upswings, but they amplify mistakes just as quickly. Emotions swell; discipline fades. The most resilient portfolios usually:
- Build a solid foundation in Bitcoin (and often Ethereum).
- Add smaller experiments only when the base is secure and position sizing is controlled.
Miracle chasing tends to erode patience and capital. Durable results usually come where curiosity meets restraint, not frenzy.

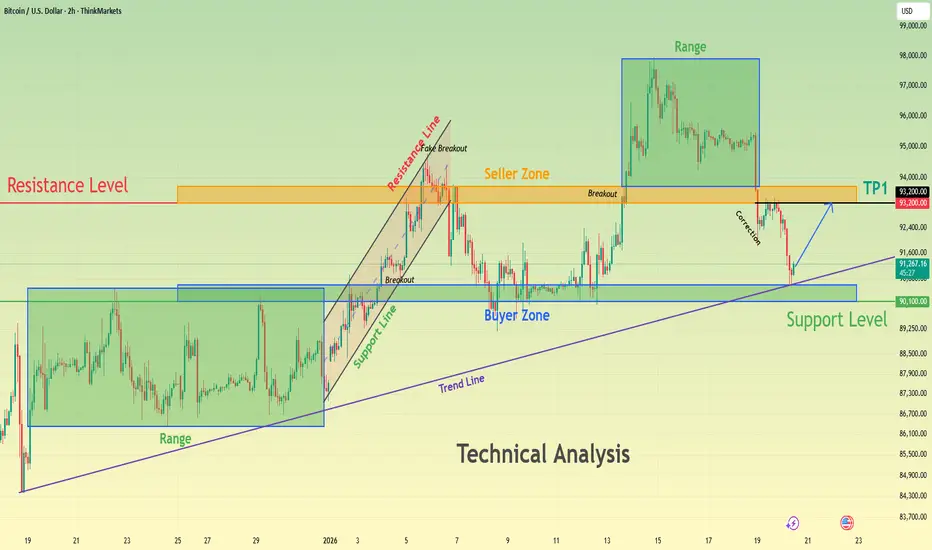
BTCUSD Holds Above Demand - Next Move Toward 93,200 ResistanceHello traders! Here’s my technical outlook on BTCUSD (2H) based on the current chart structure. Bitcoin is trading within a clear bullish environment after transitioning from a prolonged consolidation phase into an impulsive upward move. Earlier on the chart, price was moving inside a well-defined range, indicating balance between buyers and sellers and a period of accumulation. This range was eventually resolved to the upside, confirming a shift in market control in favor of buyers. Following the breakout, BTCUSD accelerated higher and successfully established acceptance above the former range highs. Currently, price is trading above the Support Level around the 90,100 area, which aligns with a clearly defined Buyer Zone and a previous structural level. This area is now acting as a key demand zone after the breakout and is reinforced by the rising trend line, strengthening its importance. The recent pullback into this support appears corrective rather than impulsive, suggesting healthy profit-taking instead of aggressive selling pressure. Buyers are actively defending this zone, keeping the bullish structure intact as long as price remains above support. If buyers continue to defend the 90,100 Buyer Zone, BTCUSD could resume its upward move toward the 93,200 Resistance Level, which serves as the next key objective. A clean continuation and acceptance above this resistance would confirm further upside momentum and open the door for continuation toward higher targets (TP1 and beyond). However, a decisive breakdown and acceptance below the support zone and rising trend line would signal a deeper correction and weaken the bullish setup. For now, the overall structure favors buyers while price respects support. Please share this idea with your friends and click Boost 🚀
Why Does Bitcoin Often Top When Everyone Is Bullish?In the Bitcoin market, there is a familiar paradox:
The more people believe price will keep going up, the closer the market often is to a top.
This isn’t superstition or coincidence.
It’s the result of capital flow, crowd psychology, and how markets truly work.
1. When Everyone Is Bullish, New Buyers Are Running Out
Price can only continue to rise if there are new buyers willing to pay higher prices.
But when:
- Positive news is everywhere
- Social media is full of higher price targets
- “Buy the dip” becomes automatic
→ Most of the available capital is already in the market.
At this stage:
- Those who wanted to buy → already bought
- Those who haven’t → either lack capital or are unwilling to chase price
Demand weakens, while supply quietly starts to appear.
2. Smart Money Doesn’t Buy When Optimism Is Extreme
Large institutions don’t accumulate Bitcoin when:
- News is overwhelmingly positive
- Retail traders are FOMOing
- Price is far from its accumulation zone
Instead, they tend to:
- Buy during doubt
- Dustribute during certainty
When the crowd turns aggressively bullish, it often signals:
Smart money is reducing exposure, not adding to it.
3. Extreme Bullishness Creates Psychological Imbalance
Near market tops, you often see:
- No bearish scenarios considered
- Anyone questioning the trend labeled as “FUD”
- Stop losses ignored in the name of “conviction”
This is a psychological imbalance:
- Expectations are stretched
- Risk is underestimated
At this point, the market doesn’t need bad news.
A lack of new buyers is enough to trigger a correction.
4. Tops Form Quietly, Not in Panic
Many believe a top must come with a violent crash.
In reality:
- Tops often form through choppy price action and slowing momentum
- Volume fades
- Breakouts repeatedly fail
This is when:
Confidence remains high, but underlying strength is already weakening.
5. The Key Lesson for Traders
- Tops don’t form when the market is fearful
- They form when risk is ignored and confidence becomes one-sided
Understanding this helps you:
- Avoid FOMO when everyone is bullish
- Stay cautious when “everyone is right”
- Realize that market psychology matters as much as technical analysis
Final Thoughts
Bitcoin doesn’t top because too many people are bullish.
It tops because when everyone is bullish, the market runs out of fuel.
In trading:
The crowd is usually right in the middle of a trend — and wrong at turning points.
Keeping a calm, rational mindset while others are euphoric
is the true edge of a mature trader.

Bitcoin: Analyzing the Complex Correction Towards a Final FlushBitcoin appears to be entering a complex corrective phase where the internal structure suggests significant remaining downside potential. Here is my detailed market reading:
🔍 Technical Context: A "5-3-5" Corrective Structure My analysis is based on the following breakdown:
Phase A (Bearish Impulse): An initial 5-wave sequence (decomposed here into a complex WXYXZ cycle), marking the end of euphoria and a shift in structure.
Phase B (Corrective Bounce): A 3-wave relief move (WXY), testing key resistances without invalidating the underlying bearish trend.
Phase C (Final Wave): We are potentially starting a new 5-wave bearish sequence (aiming for another WXYXZ structure). This phase aims to purge the market and hunt for liquidity in much lower zones.
🎯 Targets and Zones of Interest Target levels are mapped using Fibonacci extensions and historical support zones. The market must confirm a break of the recent local lows to validate this final capitulation scenario. Note: As long as identified resistance zones are not reclaimed on a weekly close, the bias remains strictly Bearish.
💡 Trading Philosophy
Patience is your best ally: Do not force entries.
Discipline is your shield: Respect your stop-losses and your initial plan. The market gives nothing for free; it rewards those who wait for the perfect signal.

BTC Ready To CRACK!This chart is pretty much self-explanatory as per BKC rules.
Wave 1 thrusts down
Wave 2 counter trend rising wedge with 3 waves and hook
Wave 3 down is about to begin.
Clear price action is way below the Death Cross.
I’ll say it again: the JPY carry trade is breaking, and it’s hitting crypto.
By crypto-bro expert logic, a weaker dollar should mean crypto goes up. That’s not what’s happening, is it?
Why? Because they don’t understand how the monetary system actually works.
They looked smart while the trend did the work for them. Now the trend is gone—and reality is doing the explaining.
Men are now taking the boys' money like candy without even a mask on in the light of day!
BTC is now at stage 4 where the experts try to motivate fools.
4️⃣ Deep Decline (-30%) — Moral Pressure Phase
“Buy when there’s blood in the streets”
“This is how generational wealth is made”
“The smart money is buying”
“Be greedy when others are fearful”
“This is once-in-a-decade”
📌 Translation: We need new buyers to absorb forced selling.
#FAFO
If you enjoy the work:
👉 Drop a solid comment
Let’s push it to 6,000 and keep building a community grounded in raw truth, not hype.

Elise | BTCUSD – 30M | Bearish ContinuationBITSTAMP:BTCUSD
After a strong impulsive sell-off, BTC attempted a corrective move into prior supply but lacked acceptance above resistance. The rejection from this zone suggests continuation toward sell-side liquidity, with downside targets aligned with previous demand and unfilled liquidity pools.
Key Scenarios
❌ Bearish Case 📉 → Continuation below 87.8K
🎯 Target 1: 86,100
🎯 Target 2: 84,200
✅ Bullish Invalidation 🚫 → Strong acceptance and close above 89,000 would invalidate this bearish view.
Current Levels to Watch
Resistance 🔴: 88,700 – 89,000
Support 🟢: 86,100 → 84,200
⚠️ Disclaimer: This analysis is for educational and informational purposes only. It is not financial advice. Please conduct your own research before trading.

BTCUSD BUY ZONE ACTIVATED | Cloud Support Holding Upside TargetBitcoin is showing signs of a short-term recovery after a strong sell-off. Price is currently holding near a key demand zone around 89K, while trading below the Ichimoku cloud — indicating the broader trend is still bearish, but a technical bounce is possible.Market Structure: Overall structure remains bearish with clear lower highs and lower lows. The recent sharp drop shows strong selling momentum.
Current Price Zone: Price is reacting from a demand/support area around 88.8K–89.2K, where buyers stepped in after the sell-off.
Ichimoku Cloud: Price is still below the cloud, and the cloud is acting as dynamic resistance. This means trend bias is bearish, but pullbacks are possible.
Support Levels:
Immediate support: 88.8K – 89.0K
If this breaks, next support near 87.5K
Resistance / Targets:
First resistance: 91,000
Major resistance: 93,000 (previous structure + cloud area)
Price Expectation: A relief bounce toward 91K–93K is possible if support holds. Rejection from these levels may lead to another bearish continuation.
Confirmation Needed: Bullish momentum and strong candles are required to sustain upside. Without confirmation, this move remains a counter-trend bounce.

The Bitcoin (BTCUSD) Melt DownI project that BTCUSD will attempt to hit the LOWs of Thursday and Friday as the first target. And depending on whether that support is broken, it'll then move to chase Wednesday's lows as the second target. But we can only wait and see whether price action will prove us right or wrong.
|| -- TMMH -- ||

BTCUSD From Consolidation to DistributionThis BTCUSD 1H chart shows a clear bearish market structure following a prolonged consolidation phase. Price initially ranged sideways within a well-defined consolidation area, which later broke to the upside into a supply zone. That move marked distribution after which Bitcoin reversed and began trading inside a descending channel.
Within the channel, price respected lower highs and lower lows, confirming bearish momentum. A sharp breakdown occurred near the channel midline, accelerating price toward key downside levels. Two downside targets are highlighted:
1st Target (87,356) a short-term liquidity and structure target
2nd Target (84,499) aligned with a strong demand zone, where buyers may step in
Overall, the chart illustrates a classic consolidation distribution trend continuation setup, favoring further downside until demand is reached.

Why The Asian Session MattersThe Asian session is often dismissed as slow or irrelevant, but it plays a critical role in shaping the trading day. It does not usually deliver large directional moves, yet it lays the groundwork for what follows. Traders who ignore it miss important information about liquidity, positioning, and intent.
During the Asian session, liquidity is thinner and participation is more selective. This environment favors balance rather than expansion. Price often rotates within a defined range, building inventory and establishing short-term equilibrium. These ranges are not meaningless. They become reference points for later sessions, especially when London and New York enter with increased volume.
One of the key functions of the Asian session is liquidity placement. Equal highs, equal lows, and compressed ranges formed overnight attract attention during the active sessions. These levels act as magnets. When London opens, price often targets Asian highs or lows to access resting orders before choosing direction. Traders who understand this stop treating these moves as randomness and start seeing them as preparation.
The Asian session also reveals early bias. A market that holds above key levels overnight shows different intent than one that grinds lower into them. While this does not confirm direction, it provides context. Strong acceptance or repeated rejection during low participation hints at where larger players may later apply pressure.
Volatility behavior matters as well. Because ranges are typically tighter, breakouts during Asia often lack follow-through. Traders who chase them provide liquidity. Traders who wait use the session to define boundaries and plan execution for higher-volume hours. This improves timing and reduces unnecessary drawdown.
Another overlooked aspect is risk calibration. The Asian session shows how price behaves when participation is limited. If structure already weakens or levels fail during Asia, continuation during active sessions becomes less likely. If structure remains intact, probability improves once volume returns.
The Asian session is not about trading aggressively. It is about observation and preparation. It defines levels, reveals early behavior, and sets traps for impatience. Traders who respect its role enter the main sessions with clearer context, better location, and fewer emotional decisions.

BITCOIN isn't diverging from 2022 at all!Bitcoin (BTCUSD) continues to replicate the 2022 Bear Cycle almost in the exact same fashion. This is of course a concept we introduced back in October for the first time and so far it has fulfilled all conditions set in its way.
The most recent is the 1D MA100 (green trend-line) rejection, which in 2022 happened on March 02 and after another Support test, BTC rebounded for the final rejection on the 1D MA200 (orange trend-line). As mentioned before, that could be around $100k.
Assuming the 2026 Bear Cycle continues to repeat the 2022 price action, the next Support level should be around $70k, then $51-52k and finally around $45000.
So do you think it will unfold like 2022? Feel free to let us know in the comments section below!
---
** Please LIKE 👍, FOLLOW ✅, SHARE 🙌 and COMMENT ✍ if you enjoy this idea! Also share your ideas and charts in the comments section below! This is best way to keep it relevant, support us, keep the content here free and allow the idea to reach as many people as possible. **
---
💸💸💸💸💸💸
👇 👇 👇 👇 👇 👇

Bitcoin — Bearish Bigger Picture, But a Short-Term Reversal?When it comes to the overall outlook for BTC, I remain far from optimistic and continue to hold a bearish bias on the medium to longer term.
That said, markets move in waves — and based on last week’s price action, I’m now expecting a short-term upside reversal.
🔎 What Changed on the Chart
After breaking below the flag formation that had defined price action since late November, BTC dropped into the 86k zone, where it formed a local low.
What’s important is what happened next:
- price reversed quickly
- and moved back up to retest the broken flag structure
Under normal circumstances, a clean break from a continuation pattern like this should lead to acceleration to the downside.
The fact that this acceleration did not happen is, in itself, information.
👉 This behavior strongly suggests the possibility of a false break.
⚖️ Two Time Horizons, Two Different Biases
To be very clear:
Medium-term:
My bearish view remains unchanged, with 75k still my primary downside objective.
Short-term:
The current structure opens the door for a counter-trend long, especially if price continues to hold above the recent low.
📌 Trading Idea (Short-Term Only)
On the short-term horizon, I will look to:
👉 buy dips
The logic is simple and tactical:
- downside risk is relatively well-defined
- upside potential could extend toward the 95k zone
That gives a potential risk-to-reward of up to 1:5, which is more than acceptable for a counter-trend setup.
✅ Conclusion
BTC remains a bearish market on the bigger picture — but short-term price behavior matters.
Right now, the lack of downside follow-through after the flag break increases the probability that we are seeing a temporary upside reversal.
Trade the timeframe you’re in — and manage risk accordingly. 🚀

BTCUSD BUY IDEAPrice just retested to a neckline of a double button reversal pattern. From the technical standpoint, I anticipate bullish price action to develop away from the current market price. My target profit is at 107233. Take advantage of this opportunity!

BTC/USD Bearish Flag Breakdown – Downside Targets 82,100 &76,400The BTC/USD daily chart displays a clear bearish trend, highlighted by the formation of a bearish flag pattern after a sharp downward move. Following the strong sell-off, price consolidated within an upward-sloping channel, which acted as a corrective phase before continuation. The recent breakdown below the flag support confirms bearish continuation and signals renewed selling pressure. Price remains below key resistance and moving average levels, indicating weak bullish momentum. The rejection from the resistance zone near 96,000 further strengthens the downside bias. Based on this technical structure, the first downside target is set near 82,100, where temporary support may appear. If bearish momentum persists, the second target is projected around 76,400, aligning with previous demand zones and key historical support levels. Overall, market conditions favor sellers in the short term.
If you found this XAUUSD analysis helpful, don’t forget to LIKE 👍 and COMMENT 💬!

THE MARKET CYCLE IS NOT A PRICE CHART, IT IS AN EMOTION CHARTRemember the famous quote by legendary investor John Templeton summarizing market cycles:
"Bull markets are born on pessimism, grow on skepticism, mature on optimism and die on euphoria."
Look at this chart. It's the same story in every cycle, only the players change:
Depression (Bottom): The moment everyone says "Bitcoin is dead" and the black-hooded "Doomer" takes the stage. (2015, 2019, 2022).
Skepticism (Growth): Price rises, but no one believes it. They say, "It's a trap."
Optimism (Maturity): The moment people start saying, "Maybe it is turning."
Euphoria (Top): The moment the wide-mouthed Wojaks appear, and everyone thinks they are a genius.
Where are we now? According to the chart, the market is currently preparing to transition from the "Skepticism" phase to the "Optimism" phase. People are still afraid; they are still expecting a crash. This is the healthiest fuel for a bull run. Because Euphoria has not arrived yet.
bitcoin / BTC / CYCLE

THE FOUR HORSEMEN OF FINANCE -BTC/SP500/GOLD/COPPERTHE FOUR HORSEMEN OF FINANCE
BTC/SP500/GOLD/COPPER
"THE GREAT SHOWDOWN IN THE FINANCIAL ARENA: WHO WINS?" ⚔️
There are 4 assets on the table: GOLD | COPPER | SPX | BITCOIN
Our technical data screams that history's largest "Great Rotation" has begun. Leave your emotions aside. Let the data speak.
ROUND 1 & 2: THE "BUBBLE" vs THE "OPPORTUNITY"
Traditional markets are saturated. Bitcoin is historically cheap against them.
BTC vs S&P 500: RSI is at 26 (Technical Bankruptcy). Similar to 2015/2019 bottoms.
BTC vs GOLD: RSI is at an ALL TIME LOW (29).
2w chart BTC vs S&P 500
1w chart BTC vs S&P 500
1w BTC vs GOLD
1M BTC vs GOLD
Verdict: Wall Street and Gold are exhausted. Smart money is rotating into the only oversold asset: Bitcoin.
ROUND 3: THE ECONOMIC REALITY
Is Bitcoin expensive against the economy? NO.
BTC/COPPER: Technically oversold against industrial demand.
COPPER/GOLD RATIO: Deep in the danger zone (RSI 22). When this ratio rises from the dead, Bitcoin goes parabolic.
Meaning: We are at the exact pivot point where risk appetite wakes up.
THE VERDICT & THE TRAP
Those in stocks feel "Safe." Those in Bitcoin feel "Tired." This is the trap. The market transfers wealth from the impatient to the patient.
The Scoreboard:
S&P 500: Overvalued ❌
Gold: Saturated ⚠️
Bitcoin: OVERSOLD AGAINST EVERYTHING. ✅
Strategy: Follow the value, not the price. The "Great Rotation" flows to the scarcest asset—because this is exactly what happened in every previous cycle bottom. History is repeating itself.
PSYCHOLOGICAL TRAP
Those currently in stocks or gold feel "Safe." Those holding Bitcoin feel "Tired and Jaded." This is exactly what the market is: A transfer of wealth from the impatient to the patient.
The "Oversold" zones on the charts are "Pain" zones. But the biggest profits are always born from this pain.
STRATEGY
I am not a soothsayer; I am an analyst. The data tells me this: Global liquidity will exit swollen traditional markets (SPX, Gold) and flow into the asset with the highest "Value/Price" mismatch.
That asset, having bottomed out in all ratios, is Bitcoin. This is not investment advice; it is an "Asset Survival" guide.
"The crowd follows price; Professionals follow value." Value is currently at the bottom, while Price has not yet left the station.
Are you ready?
