XAUUSDHello Traders! 👋
What are your thoughts on GOLD?
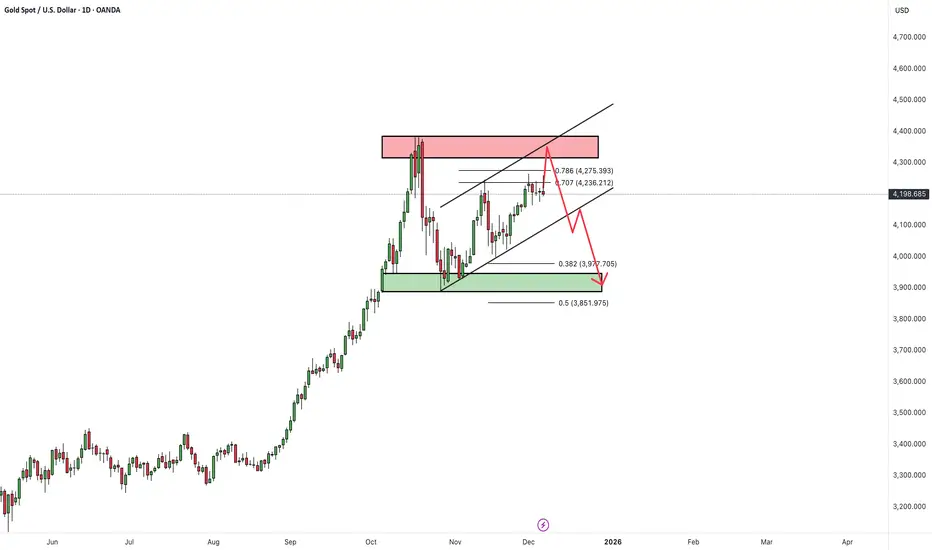
Gold continues to trade within a short-term ascending channel and is now approaching the upper boundary, which aligns with a major resistance zone formed by the previous swing high. This creates a strong confluence area where sellers may become active.
As price enters this resistance cluster, we expect selling pressure and a potential rejection. Based on the current momentum, a clean breakout above this zone does not seem likely in the short term.
Most Probable Scenarios
1-A final upward push toward the upper boundary of the channel
2-A rejection from the resistance zone
3- A move back toward the lower boundary of the ascending channel
4- If the channel breaks to the downside, an extended decline toward the next key support level becomes likely
This week includes several high-impact events—most importantly:
The U.S. Federal Reserve interest rate decision,
which may significantly increase volatility in gold.
For now, it is recommended to stay patient and wait for price to reach clearer, low-risk zones before entering any trades.
Don’t forget to like and share your thoughts in the comments! ❤️
Harmonic Patterns
Gold next week Key S/R Levels and Outlook for Traders🔥 GOLD WEEKLY SNAPSHOT — BY PROJECTSYNDICATE
🏆 Swing High / Swing Low
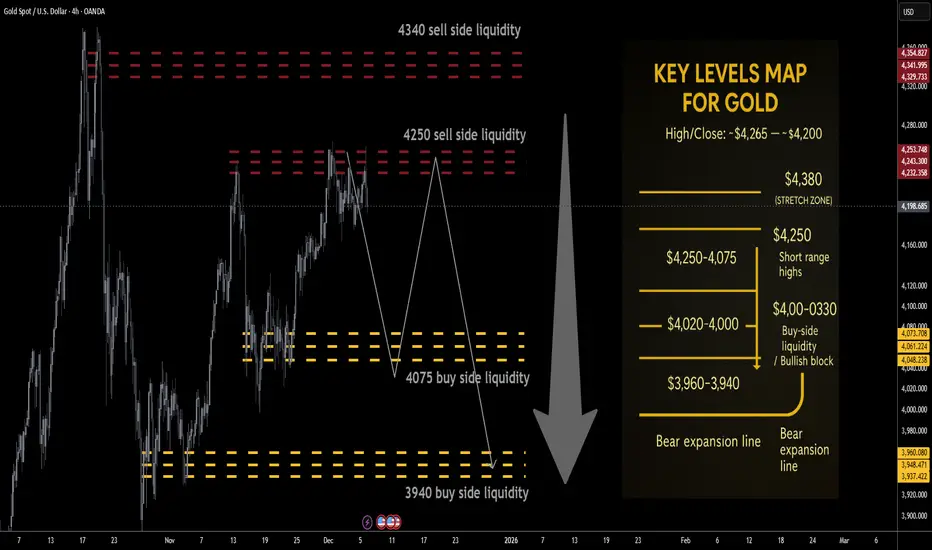
$4,265 → ~$4,164 — clean rejection from the 4,26x breakout zone with a long upper wick, but weekly close still near $4,200, keeping price pinned in the upper part of the broader $4k range.
📈 Trend
Higher-timeframe: Structural bull trend intact while price holds above the $3,940–$4,000 block.
Tactical: Last week’s failed extension above $4,250 and the close back near $4,200 tilt the tape into distributive mode:
Rallies into $4,250 / $4,340 = sell-side liquidity magnets.
Downside liquidity sits lower at $4,075 / $3,940, making upside risk/reward look asymmetric to the downside from current levels.
🛡 Supports – Buy-Side Liquidity / Downside Objectives
$4,130–$4,100:
Short-term intraday pivot where buyers repeatedly stepped in last week; first micro-reaction zone on any flush.
$4,090–$4,075 🟢 Buy-side liquidity #1
First true BSL pocket below the close; ideal TP1 for shorts from above and a spot where responsive dip-buyers are likely to probe.
$4,020–$4,000:
Psychological shelf; loss of 4k would confirm that local distribution is winning and open the deeper BSL run.
$3,960–$3,940 🟢 Buy-side liquidity #2 / structural block
Higher-timeframe demand and key liquidity magnet for a fuller corrective leg. A sustained break/acceptance below $3,940 would signal that the 2025 blow-off is transitioning into broader mean-reversion rather than shallow consolidation.
🚧 Resistances – Sell-Side Liquidity / Short-Side Focus
$4,220–$4,250 🔴 Sell-side liquidity #1
First overhead supply from the prior week’s failed breakout structure and just under recent highs. Clean area for “sell the rip” probes and for late longs to de-risk.
$4,300–$4,340 🔴 Sell-side liquidity #2
Extension / SLI pocket aligned with the upper part of last week’s range and just below the prior $4,38x–$4,40x all-time high band. Ideal for scaling adds if a news-driven squeeze runs stops above 4,250.
Stretch: $4,380–$4,400:
Prior record spike / stop-run area; only expected on a full-on squeeze into the Fed, but a tag here would likely be exhaustion rather than a new sustainable trend leg higher.
🧭 Bias Next Week
Base tactical bias: fade strength / short rallies, not chase upside.
the tape favors a liquidity grab higher → rotation lower scenario:
Look for wicks into $4,220–$4,340 to be sold.
Downside path of least resistance: $4,090–$4,075 → $4,020–$4,000 → $3,960–$3,940.
⚖️ Base Case Scenario
Open/early week:
Price opens near $4,200 and either trades flat or spikes briefly into $4,220–$4,250 on weekend gap/early flow.
Liquidity sweep into resistance:
Rejection from SLI:
Failure to accept above $4,250/4,300 leaves upper wicks on 4H/daily, signaling distribution.
Rotation into BSL:
First objective: $4,090–$4,075 (TP1)
Secondary objective: $4,020–$4,000 (TP2)
Stretch / full flush: $3,960–$3,940 (TP3) into the structural demand block and buy-side liquidity pocket.
🚀 Breakout / Invalidation Trigger
Bearish framework invalidation:
A strong daily/weekly acceptance above $4,380 would imply shorts caught offside and re-open the path toward $4,450+ in line with the higher Street targets for 2026.
In that case, shift from short-the-rip → neutral / buy shallow pullbacks until a new top structure forms.
🔓 Bull / Bear Trigger Lines
Structural bull line:
Above $3,940–$4,000: long-term bull structure remains intact. Even if you’re tactically short, treat deep moves into this area with respect – this is where higher-timeframe players are likely to re-accumulate.
Bear expansion line:
Below $3,940: opens scope for a faster liquidation wave toward $3,880–$3,850 and potentially a broader 2025–26 consolidation phase instead of immediate continuation higher.
🧭 Recommended Strategy – Short at Market Open
⚠️ Illustrative trade plan, not financial advice. Size and risk-manage according to your own rules.
1️⃣ Primary Short – Open + Fade the Rips
Short at/near market open around the $4,195–$4,210 zone if price opens below $4,220 and orderflow confirms rejection of higher bids.
Add / build zones:
Add 1: into $4,220–$4,250 (first SLI band / prior breakout zone).
Add 2 (only if spike): $4,300–$4,340 (second SLI; look for clear blow-off / stop-run behavior before loading the last clip).
Stops / invalidation:
Tactical stop: hard stop above $4,380.
More conservative: soft line at $4,340, hard stop $4,390–$4,400 to allow for intraday wicks.
Targets (aligned with buy-side liquidity):
TP1: $4,090–$4,075 → take partials and reduce risk.
TP2: $4,020–$4,000 → core target for the week if distribution plays out.
TP3: $3,960–$3,940 → full BSL sweep into structural demand; expect responsive buying attempts here.
AKT/USDT — Path Toward $7 with 500M +Market Cap Potential AKTis is currently showing early structural strength after a long accumulation phase.
Based on current supply metrics and market behavior, a 500M market cap could push the price
TO NEW ATH with time.
Current base forming near $0.44
Next psychological and technical targets at $0.68 → $1
If momentum continues building, AKT could be entering a stage where new capital inflows drive a high-multiple move, similar to its previous historical run.
💡 Observation: The chart shows similar accumulation and volume buildup patterns seen before large runs — a breakout could mark the start of a new growth cycle.
📈 Outlook: Bullish scenario 7 usd+
🎯 Market Cap Target: 500M+
For this coin Pippin: USDT, we did made the same study, and it did increase in a short time more than 10x

Euro Leads the Wave – Buyers Take the Advantage!If I had to choose a pair that is currently sailing with the wind , EURUSD would be the standout name. The expectation that the Fed will cut interest rates soon is weakening the USD, while improving eurozone data helps the Euro attract capital. The macro backdrop is clearly favoring the buyers more than the sellers.
Looking at the H4 chart, EURUSD is moving smoothly inside the rising channel . Price stays near the lower boundary of the channel, above the Ichimoku cloud and the 1.1640 support zone. This shows the uptrend is still intact and current pullbacks are mostly technical corrections .
My preferred scenario: wait for price to pull back around 1.1640–1.1650 , where price meets the channel + cloud, then look for bullish confirmation to buy with the trend. The near-term target is 1.1700, the resistance zone above. As long as EURUSD holds above 1.1640, every dip is still a chance to join the uptrend rather than trying to sell against it.

EUR/USD Trading Strategy for Next Week1. Guidance from U.S.-EU Bond Market Spread
The spread between the 10-year U.S. Treasury bond and German Treasury bond has been continuously narrowing to 120 basis points, a notable drop from 150 basis points recorded in October. Since the Federal Reserve halted its balance sheet reduction on December 1st, liquidity in the U.S. Treasury bond market has improved, and the yield on the 10-year U.S. Treasury bond has pulled back to around 3.8%. In contrast, the yield on the 10-year euro zone Treasury bond has stabilized at 2.6%.
The narrowing spread has weakened the appeal of U.S. dollar-denominated assets, spurring capital outflows from U.S. Treasury bonds into euro zone bonds and indirectly boosting the euro. If the yield on the 10-year U.S. Treasury bond falls below 3.7% in the future, it will further open up room for the euro to appreciate against the U.S. dollar.
2. Resonance Between Stock and Foreign Exchange Markets
The Euro Stoxx 50 Index has recently hit a yearly high. Share prices of leading enterprises in the service and manufacturing sectors have strengthened, attracting foreign capital to flow into euro-denominated assets. On the other hand, the U.S. Nasdaq and Dow Jones indices have shown volatile divergence. The pattern where AI-related technology stocks outperform while traditional consumer stocks remain sluggish makes it difficult to form a sustained capital siphoning effect.
This disparity in the strength of the stock markets between the two regions is transmitted to the foreign exchange market through capital account flows, providing solid support for the euro.
EUR/USD Trading Strategy for Next Week
buy:1.16200-1.16300
tp:1.16700-1.17000
sl:1.15800


Bearish momentum to extend?Bitcoin (BTC/USD) is rising towards the pivot which acts as a pullback resistance and could reverse to the 1st support.
Pivot: 94,255.27
1st Support: 80,712.26
1st Resistance: 106,846.29
Disclaimer:
The opinions given above constitute general market commentary and do not constitute the opinion or advice of IC Markets or any form of personal or investment advice.
Any opinions, news, research, analyses, prices, other information, or links to third-party sites contained on this website are provided on an "as-is" basis, are intended to be informative only, and are not advice, a recommendation, research, a record of our trading prices, an offer of, or solicitation for, a transaction in any financial instrument and thus should not be treated as such. The information provided does not involve any specific investment objectives, financial situation, or needs of any specific person who may receive it. Please be aware that past performance is not a reliable indicator of future performance and/or results. Past performance or forward-looking scenarios based upon the reasonable beliefs of the third-party provider are not a guarantee of future performance. Actual results may differ materially from those anticipated in forward-looking or past performance statements. IC Markets makes no representation or warranty and assumes no liability as to the accuracy or completeness of the information provided, nor any loss arising from any investment based on a recommendation, forecast, or any information supplied by any third party.

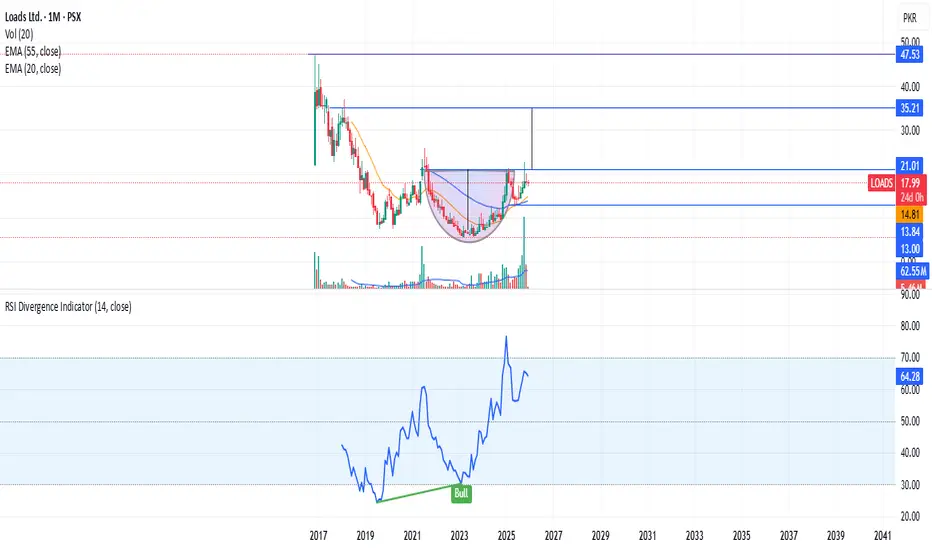
LOADS (PSX) – Monthly Breakout Setup + Auto Sector Seasonality LOADS is completing a multi-year rounded bottom and preparing for a major structural breakout above 21.00 on the monthly chart. Volume is the highest since 2019, price is above both 20 & 55 EMAs, and RSI has entered a bullish regime above 60 — all confirming a long-term trend shift.
🚗 Pakistan Auto Sector Seasonality (Important for LOADS)
Historically, Pakistan’s auto industry shows recurring strength in:
🔵 March, April, May, June → strongest sales/production months (corporate fleet purchases, year-end financing, pre-budget buying)
🟡 Sept–Oct → moderate strength
🔴 Weak months: July–Aug, Dec–Jan, Ramadan period (demand dips)
Since LOADS is an auto-parts supplier, price action often strengthens ahead of these high-demand months, which aligns with the current breakout structure.
📊 Risk–Reward Structure
🟢 Buy Zone (Accumulation): 15–18 PKR
Price holding above EMAs with strong demand zones.
🟦 Breakout Trigger: Monthly Close > 21.00
Unlocks higher timeframe bullish continuation.
🎯 Upside Targets
T1: 28 PKR → initial swing target
T2: 35.21 PKR → major 2018 resistance
T3: 47.53 PKR → full rounded-bottom measured move
🔴 Stop-Loss
< 13.50 (Monthly Close) → structure invalidation
R:R ranges between 1:2 → 1:6+ depending on target selection.
📌 Why This Setup Stands Out
Multi-year rounded bottom + higher-low structure
Strong volume expansion during right-side breakout
RSI in a bullish regime for the first time since 2017
Earlier Fan Principle breakout (Feb–Mar) validated the trend shift
Sector seasonality supports continuation into the next fiscal cycle
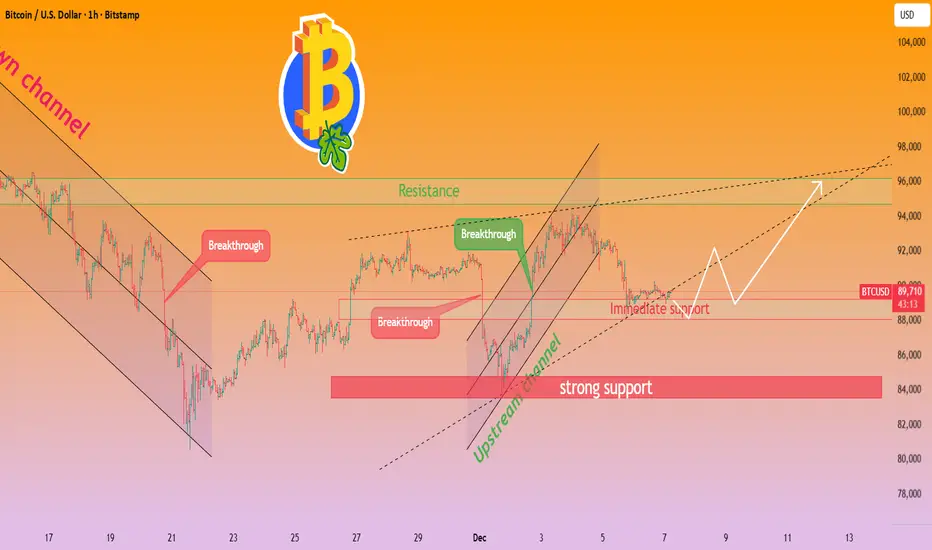
The policy bottom of Bitcoin provides support for going long.Policy Winds: Rate Cut Expectations Dominate, Liquidity Easing Expectations Intensify
The Federal Reserve’s December FOMC meeting (scheduled for December 9-10) has entered the final window, with market expectations for a rate cut surging to a high of 87% Federal Reserve Board of Governors. Major investment banks including Goldman Sachs and Morgan Stanley have confirmed a high degree of certainty for a 25-basis-point cut in December .
Dovish officials continue to send clear signals. San Francisco Fed President Mary Daly emphasizes that the risk of labor market deterioration outweighs the rebound of inflation, warning of the "non-linear" collapse risk of the currently fragile job market . Fed Governor Christopher Waller also publicly supports a December rate cut, framing it as a "sound risk management" measure to curb further labor market weakness and ease pressure on low- and middle-income households .
U.S. economic data shows a "moderate cooling" trend: monthly retail sales and durable goods orders have slowed, and manufacturing performance remains lackluster, providing real-world support for the rate cut . Bitcoin has a significant negative correlation of -0.75 with the U.S. Dollar Index — the recent weakening of the dollar directly benefits crypto assets.
While some hawkish officials within the Fed worry about inflation spread, the policy inertia after two consecutive rate cuts has aligned with market expectations . This synergy forms the core policy support for Bitcoin’s short-term upside.
Bitcoin trading strategy
buy:88500-89500
tp:91000-92000
sl:87500
08.12.25 Daily ForecastPairs on Watch -
FX:CADJPY
FX:AUDJPY
FX:AUDUSD
FX:EURGBP
A short overview of the instruments I am looking at for today, multi-timeframe analysis down to what I will be looking at for an entry. Enjoy!

BTC PERPETUAL TRADE BUY SETUP Long from $88,900BTC PERPETUAL TRADE
BUY SETUP
Long from $88,900
Currently $88'900
Targeting $91k or Above
(Trading plan IF BTC
go down to $87'500 will add more longs)
Follow the notes for updates
In the event of an early exit,
this analysis will be updated.
Its not a Financial advice

XAUUSD – Sideways Ahead of the CPI CatalystGold is currently in a “holding pattern” as the market waits for the U.S. CPI data on December 5. Rising U.S. Treasury yields are putting pressure on prices, but the USD dropping to a 1-month low is helping to cushion the downside. At the same time, labor data remains mixed — initial jobless claims fell sharply , while ADP reported a steep decline in private employment — leaving traders without a clear directional bias. As a result, XAUUSD is stuck in a sideways phase.
On the chart, gold is ranging between 4,200 – 4,280:
4,200 → strong support, aligned with the ascending trendline and Ichimoku cloud base.
4,280–4,300 → strong resistance where sellers consistently appear.
Price action shows buyers holding a slight advantage: candles repeatedly bounce from support, the trendline remains intact, and the Ichimoku cloud supports price like a cushion. However, bullish momentum is still not strong enough to break through 4,280 as the market remains cautious ahead of CPI.
Likely scenario: XAUUSD will continue oscillating within this sideways box — retesting 4,200 then moving back toward 4,280. A clear breakout will depend entirely on the CPI release:
Break above 4,280 → opens the path to 4,300+
Break below 4,200 → signals a deeper correction
For now, the best approach is range trading and waiting for a decisive signal after CPI.

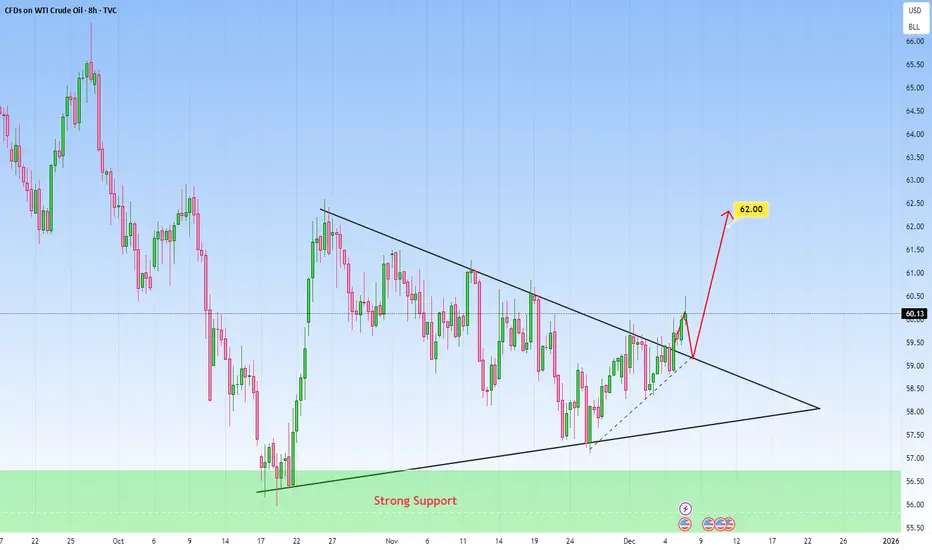
BIG Clue: USOIL Price Compressing Above ResistancePrice is currently compressing, and suggests that a strong impulsive move is likely once price strongly escapes the structure.
See how price has been pressing directly against the upper trendline. This is an area to pay close attention to because repeated tests of this descending resistance can weaken it over time. The recent bullish candles approaching the trendline show growing buying pressure, which increases the probability of an upside continuation.
So for me, a move toward the 62.00 level would be technically well justified and achievable.
The support zone below is a structural base for the entire formation. Price remained above this zone. The failed bearish attempts to push price back into this zone further support the idea that sellers are losing control.
The key confirmation for the bullish scenario is a successful retest of that same trendline as support. If price holds above it and prints continuation strength, a move toward 62.00 becomes the dominant scenario.
But if price instead gets sharply rejected and falls back inside the formation, another rotation toward the lower boundary of the triangle would become likely before any breakout attempt.
This chart is currently in a classic pre-expansion phase. The next impulsive candle will likely define the direction for the next big move.
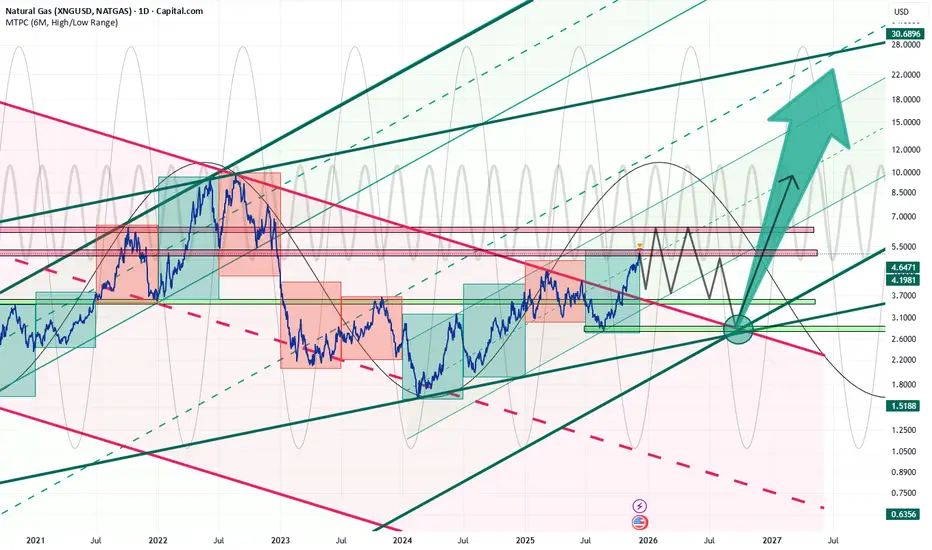
Geometrical Projection 2026: a New Bullish Era Sep.2026By early 2026, we anticipate the emergence of a new six-month green candle. Following this, a downward correction is expected, with the possibility—though not certainty—of forming a second peak in May. Ultimately, the projection points toward a retest of the bottom of the current six-month candle, signaling an exit from the five-year descending channel and defining the lower boundary of a new ascending channel. By September 2026, geometric patterns and buyer alignment suggest the potential onset of a new bullish era.
SOL : LIVE TRADEHello friends
as you can see, after the resistance we set was broken, the price has grown well, and now with this red shadow, there is a sign of sellers entering, and there is a possibility of price correction, and the price can grow again from these areas and move to our targets, of course, if buyers support the support area again...
This analysis is purely from a technical perspective and is not a buy or sell recommendation, so please follow risk and capital management.
*Trade safely with us*

Don’t Miss the GBPJPY Bullish Wave!If I had to choose a pair that’s been climbing steadily while most traders overlook it, right now it would be GBPJPY. The yen remains under pressure as markets doubt the BoJ will raise rates aggressively, while sentiment toward the British pound is more stable after recent budget developments. In short, the macro backdrop is leaning slightly toward GBP buyers over JPY .
On the H4 chart, price is holding beautifully above the rising trendline and above the Ichimoku cloud – classic signs of a strong trend with shallow pullbacks. The area around 206.5 is both horizontal support and aligned with the trendline, making it an ideal “launch point” for buyers. Above, we have the 207.9 resistance zone as the nearest target if price bounces as projected.
My preferred plan: wait for price to dip slightly toward 206.5 and watch how it reacts; if a clear bullish candle forms, buying with a first target at 207.9 makes sense. As long as price holds above the trendline and doesn’t break significantly below 206.5, I continue to treat GBPJPY as a buy-the-dip market rather than trying to short a trend that’s still moving smoothly upward.

ETH LONG Price has completed a textbook bullish market structure shift (MSS) after sweeping significant sell‑side liquidity below the $3,069 level. Following the displacement, price is now in a pullback phase, retesting the newly formed support zone and Fair Value Gap (FVG). This is a high‑quality ICT long setup for continuation toward the recent swing highs.
• Direction: Long
• Entry Zone: 3,135 – 3,145 (retest of FVG support & previous resistance turned support)
• Stop Loss: 3,049 (below the swept low and bullish order block)
• Target: 3,400 (previous high + equal legs projection / HTF liquidity pool)
• R/R: High‑quality expansion setup – risk is well‑defined below the liquidity sweep, reward offers a clear path to the next major liquidity zone.
Key ICT/SMC Observations:
Clear sell‑side liquidity sweep below $3,069 followed by a strong displacement candle.
Bullish Market Structure Shift (MSS) confirmed with a higher high and higher low.
Price is now retracing into the Fair Value Gap (FVG) created during the initial rally, offering a premium entry.
The 3,135–3,145 zone now acts as a support confluence (FVG + previous resistance).
Bias remains bullish above the swept low. A reaction from the 3,135–3,145 support zone will signal buyers are in control, targeting the 3,400 liquidity area for the next leg up.
Trade at your own risk. Manage size and always use a stop.

XAU/USD Short SignalEntryXAU/USD (Gold) Short SignalEntry: Sell Limit @ 4195.00 – 4197.00
Target 1: 4165
Target 2 (extension): 4140 – 4130 zone
Stop Loss: 4222 (above the recent swing high) Reasoning: Price rejected hard from the 4200–4212 supply zone
Bearish order block formed on the 15M/1H after the strong drop
Clear lower-high structure on the 4H timeframe
Momentum shifting lower with increasing selling volume

Bullish bounce off?USD/JPY is reacting off the pivot, which has been identified as a pullback support and could rise to the 1st resistanceance.
Pivot: 154.41
1st Support: 151.03
1st Resistance: 158.33
Disclaimer:
The opinions given above constitute general market commentary and do not constitute the opinion or advice of IC Markets or any form of personal or investment advice.
Any opinions, news, research, analyses, prices, other information, or links to third-party sites contained on this website are provided on an "as-is" basis, are intended to be informative only, and are not advice, a recommendation, research, a record of our trading prices, an offer of, or solicitation for, a transaction in any financial instrument and thus should not be treated as such. The information provided does not involve any specific investment objectives, financial situation, or needs of any specific person who may receive it. Please be aware that past performance is not a reliable indicator of future performance and/or results. Past performance or forward-looking scenarios based upon the reasonable beliefs of the third-party provider are not a guarantee of future performance. Actual results may differ materially from those anticipated in forward-looking or past performance statements. IC Markets makes no representation or warranty and assumes no liability as to the accuracy or completeness of the information provided, nor any loss arising from any investment based on a recommendation, forecast, or any information supplied by any third party.

Bearish reversal of 50% Fibonacci resistance?GBP/USD is reacting off the resistance level, which is a pullback resistance that aligns with the 50% Fibonacci retracement and could fall from this level to our take profit.
Entry: 1.3337
Why we like it:
There is a pullback resistance that aligns with the 50% Fibonacci retracement.
Stop loss: 1.3373
Why we like it:
There is a pullback resistance level.
Take profit: 1.3276
Why we like it:
There is a pullback support level that is slightly below the 50% Fibonacci retracement.
Enjoying your TradingView experience? Review us!
Please be advised that the information presented on TradingView is provided to Vantage (‘Vantage Global Limited’, ‘we’) by a third-party provider (‘Everest Fortune Group’). Please be reminded that you are solely responsible for the trading decisions on your account. There is a very high degree of risk involved in trading. Any information and/or content is intended entirely for research, educational and informational purposes only and does not constitute investment or consultation advice or investment strategy. The information is not tailored to the investment needs of any specific person and therefore does not involve a consideration of any of the investment objectives, financial situation or needs of any viewer that may receive it. Kindly also note that past performance is not a reliable indicator of future results. Actual results may differ materially from those anticipated in forward-looking or past performance statements. We assume no liability as to the accuracy or completeness of any of the information and/or content provided herein and the Company cannot be held responsible for any omission, mistake nor for any loss or damage including without limitation to any loss of profit which may arise from reliance on any information supplied by Everest Fortune Group.

Multi-Cycle Alignment Points to Sharp DownturnThe chart presents a sophisticated multi-cycle composite model overlaid on the prevailing Natural Gas trend. Notably, all four cycles will converge during the January–February 2026 window, creating a concentrated alignment that signals the likely emergence of the second major peak.
When multiple cycles reach their highs in unison, this synchronicity often delineates a critical market turning point—especially here, where prices are confronting significant resistance and aligning with the prior peak from September 2021. This formation suggests a heightened probability of a strong downward phase, potentially initiating a broader structural market correction.

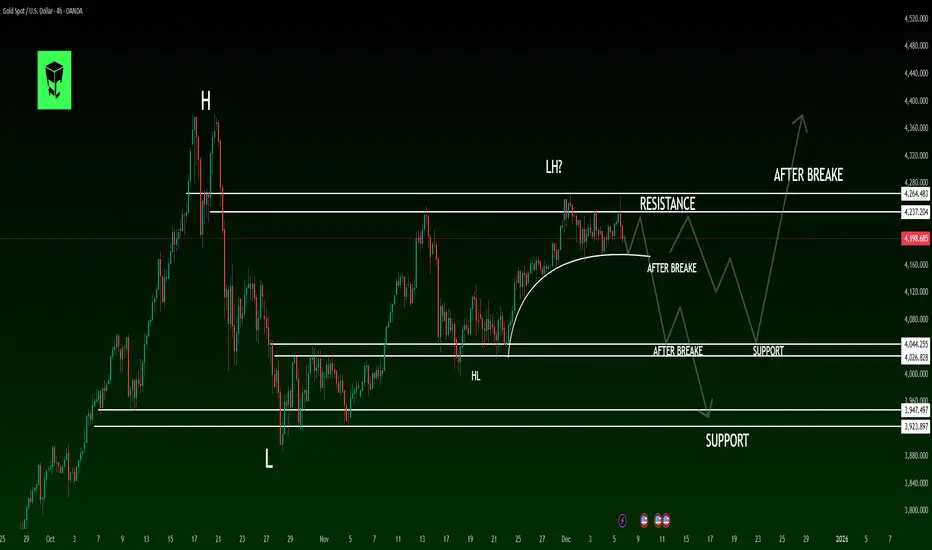
GOLD Technical Analysis: Multi-Layer Structure & Key Scenarios 4H Timeframe Analysis ⏰
Gold has entered a structural corrective phase after a strong bullish trend that formed a Higher High (HH). This correction is visible in momentum, volume, and market structure with a confirmed Lower High (LH) formation. The combination signals a powerful Decision Point that will determine gold's medium-term direction. 🔄
🔶 Market Structure Breakdown
◼️ 1. Main Bullish Wave 🚀
After breaking October resistance, price formed a HH
HH showed buyer strength, but first weakness appeared:
Sharp rejection from top → Declining bullish momentum 📉
◼️ 2. Correction Phase ⬇️
Initial correction formed a Higher Low (HL)
Price failed to break previous high → Valid LH formed
Market entered neutral-to-bearish structure
◼️ 3. Current Status 🎯
Price is trapped between two key zones:
Resistance:4270
Support: 4022
Key Levels:
🔸 Resistance Zone: LH formation area, multiple rejections
Breakout = Correction end + New bullish wave 🟢
🔸 Mid Support: Trend anchor level
Break = First confirmation of bearish structure 🔴
🔸 Major Support:4170
Break = Medium-term correction activation 📉
🔶 Probable Scenarios
🟢 BULLISH SCENARIO (Resistance Break)
Break & close above LH zone
R→S conversion
New bullish wave with volume increase
Targets:4440
🔴 BEARISH SCENARIO (Support Break)
Failure at resistance + Mid support break
Deep correction wave + New LL formation
Targets: 3950
🔶 Market Psychology 🧠
Current price action shows:
Buyer caution ⚠️
Gradual sell orders accumulation at resistance
Limited seller power in corrections
High sensitivity to fundamental news 📰
Typical pre-breakout/breakdown consolidation
📢 Your Thoughts?
Comment below with your analysis! 👇
⚠️ RISK DISCLAIMER:
Trading carries high risk. Always educate yourself and use proper risk management. Not financial advice. 📚
Bearish reversal off 50% Fibonacci resistance?Cable (GBP/USD) is reacting off the pivot which has been identified as a pullback resistance that aligns with the 50% Fibonacci retracement and could reverse to the 1st support.
Pivot: 1.3394
1st Support: 1.3189
1st Resistance: 1.3585
Disclaimer:
The opinions given above constitute general market commentary and do not constitute the opinion or advice of IC Markets or any form of personal or investment advice.
Any opinions, news, research, analyses, prices, other information, or links to third-party sites contained on this website are provided on an "as-is" basis, are intended to be informative only, and are not advice, a recommendation, research, a record of our trading prices, an offer of, or solicitation for, a transaction in any financial instrument and thus should not be treated as such. The information provided does not involve any specific investment objectives, financial situation, or needs of any specific person who may receive it. Please be aware that past performance is not a reliable indicator of future performance and/or results. Past performance or forward-looking scenarios based upon the reasonable beliefs of the third-party provider are not a guarantee of future performance. Actual results may differ materially from those anticipated in forward-looking or past performance statements. IC Markets makes no representation or warranty and assumes no liability as to the accuracy or completeness of the information provided, nor any loss arising from any investment based on a recommendation, forecast, or any information supplied by any third party.
